Luftverschmutzung in Dongmazhuang: Echtzeit-Luft-Qualitätsindex und Smog-Alarm.
Für die Dongmazhuang. Heute ist Donnerstag, 4. Juni 2026. Für Dongmazhuang wurden folgende Luftverschmutzungswerte gemessen:- Feinstaub (PM10) Schwebestaub - 53 (Ungesund für sensible Gruppen)
- Ozon (O3) - 0 (gut)
- Feinstaub (PM2,5) - 7 (gut)
- Schwefeldioxid (SO2) - 18 (gut)
- Stickstoffdioxid (NO2) - 3 (gut)
- Kohlenmonoxid (CO) - 1 (gut)

Wie ist die Luftqualität Dongmazhuang heute? Ist die Luft in Dongmazhuang? verschmutzt. Gibt es Smog?
Wie hoch ist der PM10-Stand heute in Dongmazhuang? (Feinstaub (PM10) Schwebestaub)
Der aktuelle Feinstaubgehalt PM10 in Dongmazhuang is:
53 (Ungesund für sensible Gruppen)
Die höchsten PM10-Werte treten in der Regel im Monat auf: 155 (November 2018).
Der niedrigste Wert der Feinstaub-PM10-Belastung in Dongmazhuang ist in der Regel in: August (49).
Wie ist das O3-Niveau heute in Dongmazhuang? (Ozon (O3))
0 (gut)
Wie hoch ist der aktuelle PM2,5-Wert in Dongmazhuang? (Feinstaub (PM2,5))
Die heutige PM2.5-Stufe ist:
7 (gut)
Zum Vergleich: Der höchste PM2,5-Wert in Dongmazhuang in den letzten 7 Tagen war: 21 (Freitag, 27. Mai 2022) und der niedrigste: 21 (Freitag, 27. Mai 2022).
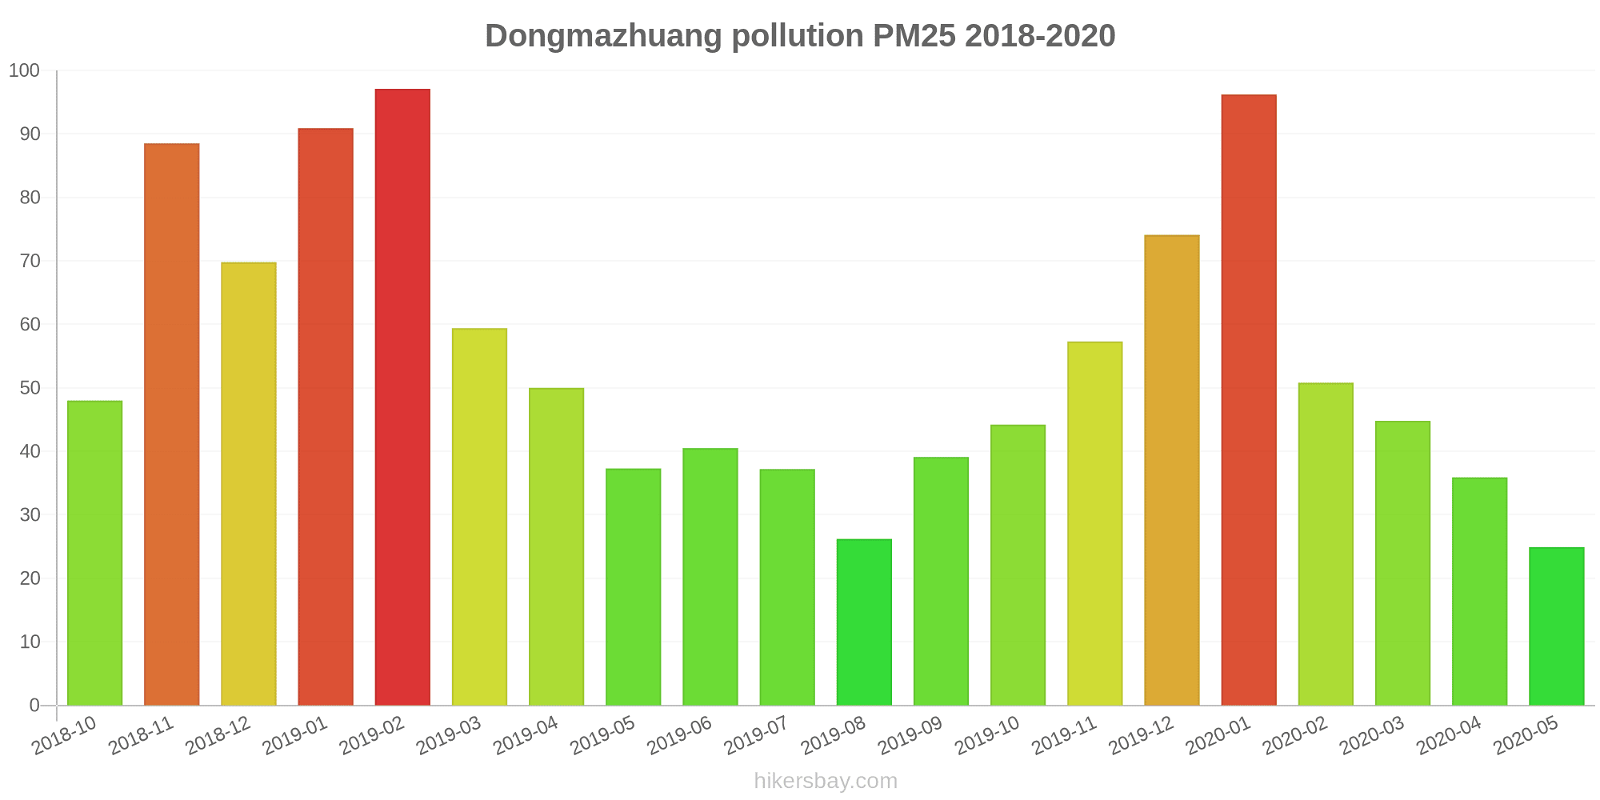
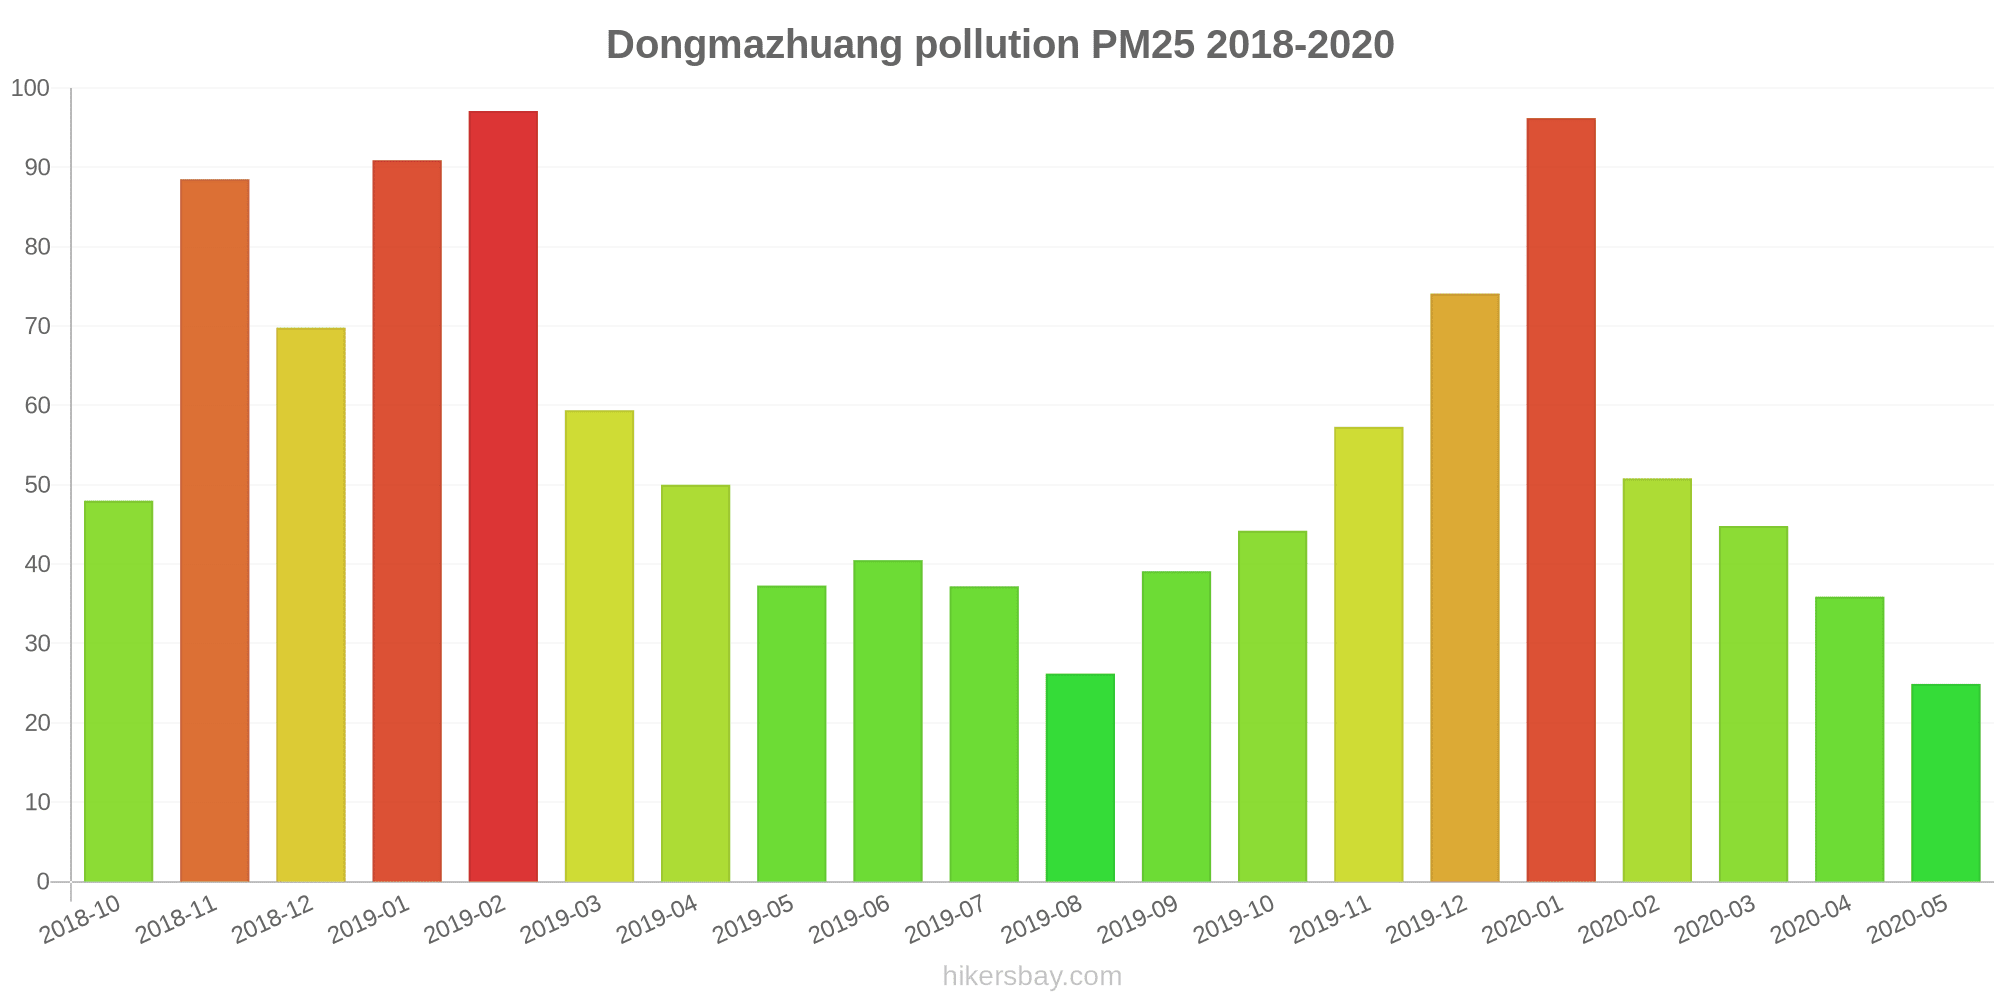
Die höchsten PM2,5-Werte wurden gemessen: 97 (Februar 2019).
Die niedrigste Feinstaubbelastung PM2,5 tritt im Monat auf: Mai (25).
Wie hoch ist die SO2-Belastung? (Schwefeldioxid (SO2))
18 (gut)
Wie hoch ist das NO2-Niveau? (Stickstoffdioxid (NO2))
3 (gut)
Wie hoch ist der CO-Gehalt? (Kohlenmonoxid (CO))
1 (gut)
Aktuelle Daten Freitag, 27. Mai 2022, 12:00
PM10 53 (Ungesund für sensible Gruppen)
O3 0 (gut)
PM2,5 7 (gut)
SO2 18 (gut)
NO2 3 (gut)
CO 1 (gut)
Daten zur Luftverschmutzung der letzten Tage in Dongmazhuang
index
2022-05-27
pm10
51
Unhealthy for Sensitive Groups
o3
0
Good
pm25
21
Moderate
so2
10
Good
no2
0
Good
co
1
Good
data source »
Luftverschmutzung in Dongmazhuang von Oktober 2018 bis Mai 2020
index
2020-05
2020-04
2020-03
2020-02
2020-01
2019-12
2019-11
2019-10
2019-09
2019-08
2019-07
2019-06
2019-05
2019-04
2019-03
2019-02
2019-01
2018-12
2018-11
2018-10
pm25
25 (Moderate)
36 (Unhealthy for Sensitive Groups)
45 (Unhealthy for Sensitive Groups)
51 (Unhealthy for Sensitive Groups)
96 (Very Unhealthy)
74 (Unhealthy)
57 (Unhealthy)
44 (Unhealthy for Sensitive Groups)
39 (Unhealthy for Sensitive Groups)
26 (Moderate)
37 (Unhealthy for Sensitive Groups)
41 (Unhealthy for Sensitive Groups)
37 (Unhealthy for Sensitive Groups)
50 (Unhealthy for Sensitive Groups)
59 (Unhealthy)
97 (Very Unhealthy)
91 (Very Unhealthy)
70 (Unhealthy)
89 (Very Unhealthy)
48 (Unhealthy for Sensitive Groups)
co
625 (Good)
749 (Good)
989 (Good)
995 (Good)
1 (Good)
1 (Good)
982 (Good)
783 (Good)
966 (Good)
878 (Good)
1 (Good)
991 (Good)
880 (Good)
1 (Good)
1 (Good)
1 (Good)
1 (Good)
1 (Good)
1 (Good)
1 (Good)
no2
30 (Good)
38 (Good)
38 (Good)
29 (Good)
55 (Moderate)
60 (Moderate)
57 (Moderate)
48 (Moderate)
42 (Moderate)
29 (Good)
30 (Good)
32 (Good)
34 (Good)
43 (Moderate)
46 (Moderate)
51 (Moderate)
62 (Moderate)
59 (Moderate)
61 (Moderate)
57 (Moderate)
o3
158 (Unhealthy)
139 (Unhealthy for Sensitive Groups)
118 (Moderate)
94 (Moderate)
78 (Moderate)
55 (Good)
84 (Moderate)
133 (Unhealthy for Sensitive Groups)
191 (Very Unhealthy)
157 (Unhealthy)
220 (Very Unhealthy)
234 (Very Unhealthy)
184 (Very Unhealthy)
154 (Unhealthy)
124 (Unhealthy for Sensitive Groups)
101 (Moderate)
60 (Good)
55 (Good)
95 (Moderate)
112 (Moderate)
pm10
58 (Unhealthy for Sensitive Groups)
80 (Unhealthy for Sensitive Groups)
85 (Unhealthy)
65 (Unhealthy for Sensitive Groups)
123 (Very Unhealthy)
113 (Very Unhealthy)
118 (Very Unhealthy)
100 (Unhealthy)
81 (Unhealthy)
49 (Moderate)
62 (Unhealthy for Sensitive Groups)
78 (Unhealthy for Sensitive Groups)
96 (Unhealthy)
111 (Very Unhealthy)
115 (Very Unhealthy)
141 (Very Unhealthy)
148 (Very Unhealthy)
127 (Very Unhealthy)
155 (Very bad Hazardous)
102 (Unhealthy)
so2
14 (Good)
19 (Good)
21 (Good)
21 (Good)
36 (Good)
29 (Good)
24 (Good)
19 (Good)
19 (Good)
17 (Good)
21 (Good)
22 (Good)
25 (Good)
23 (Good)
33 (Good)
44 (Good)
40 (Good)
36 (Good)
38 (Good)
38 (Good)
data source »
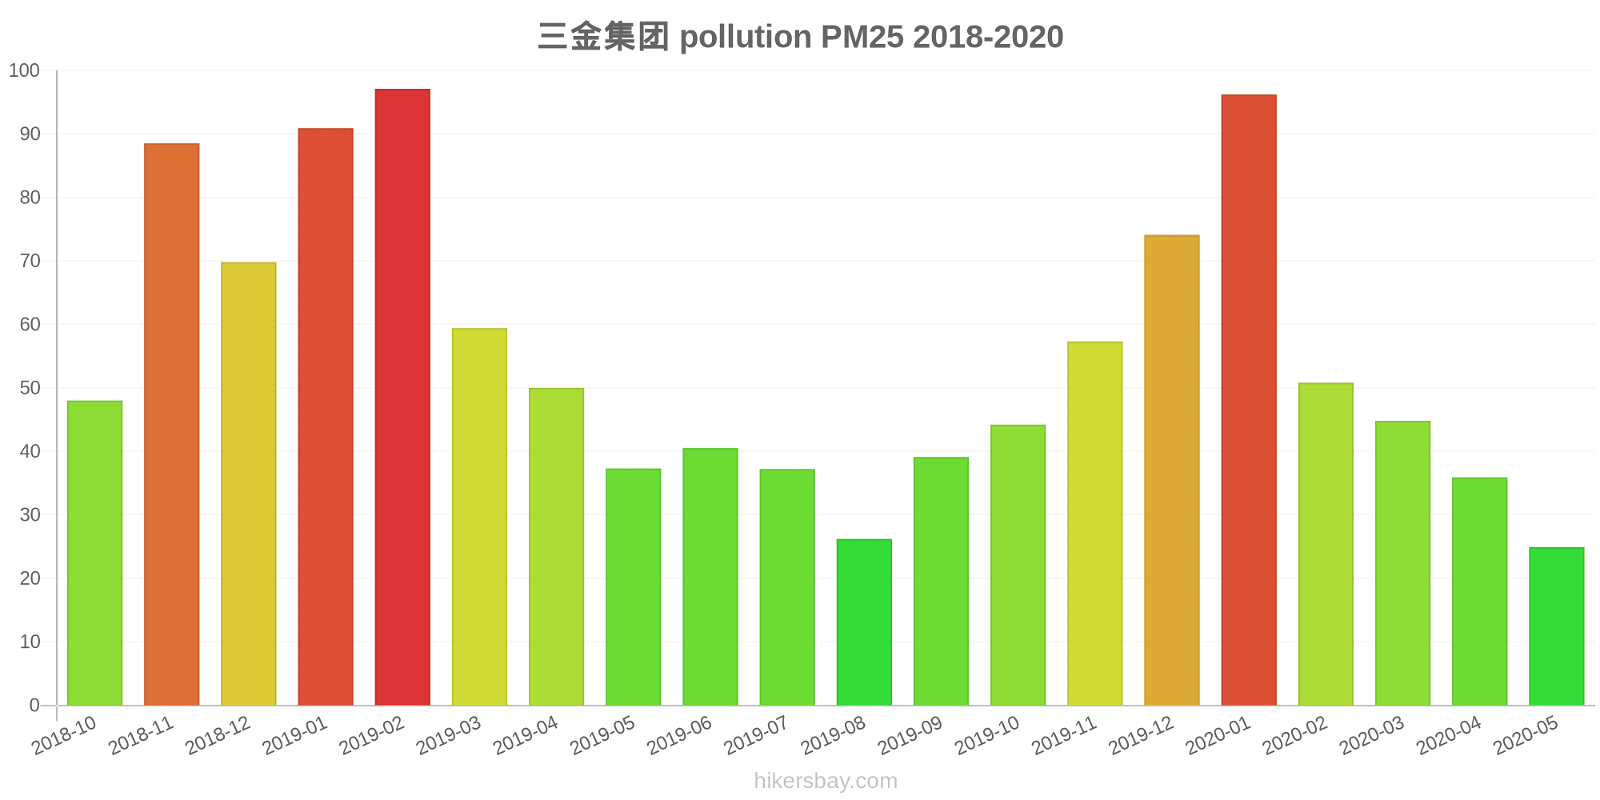
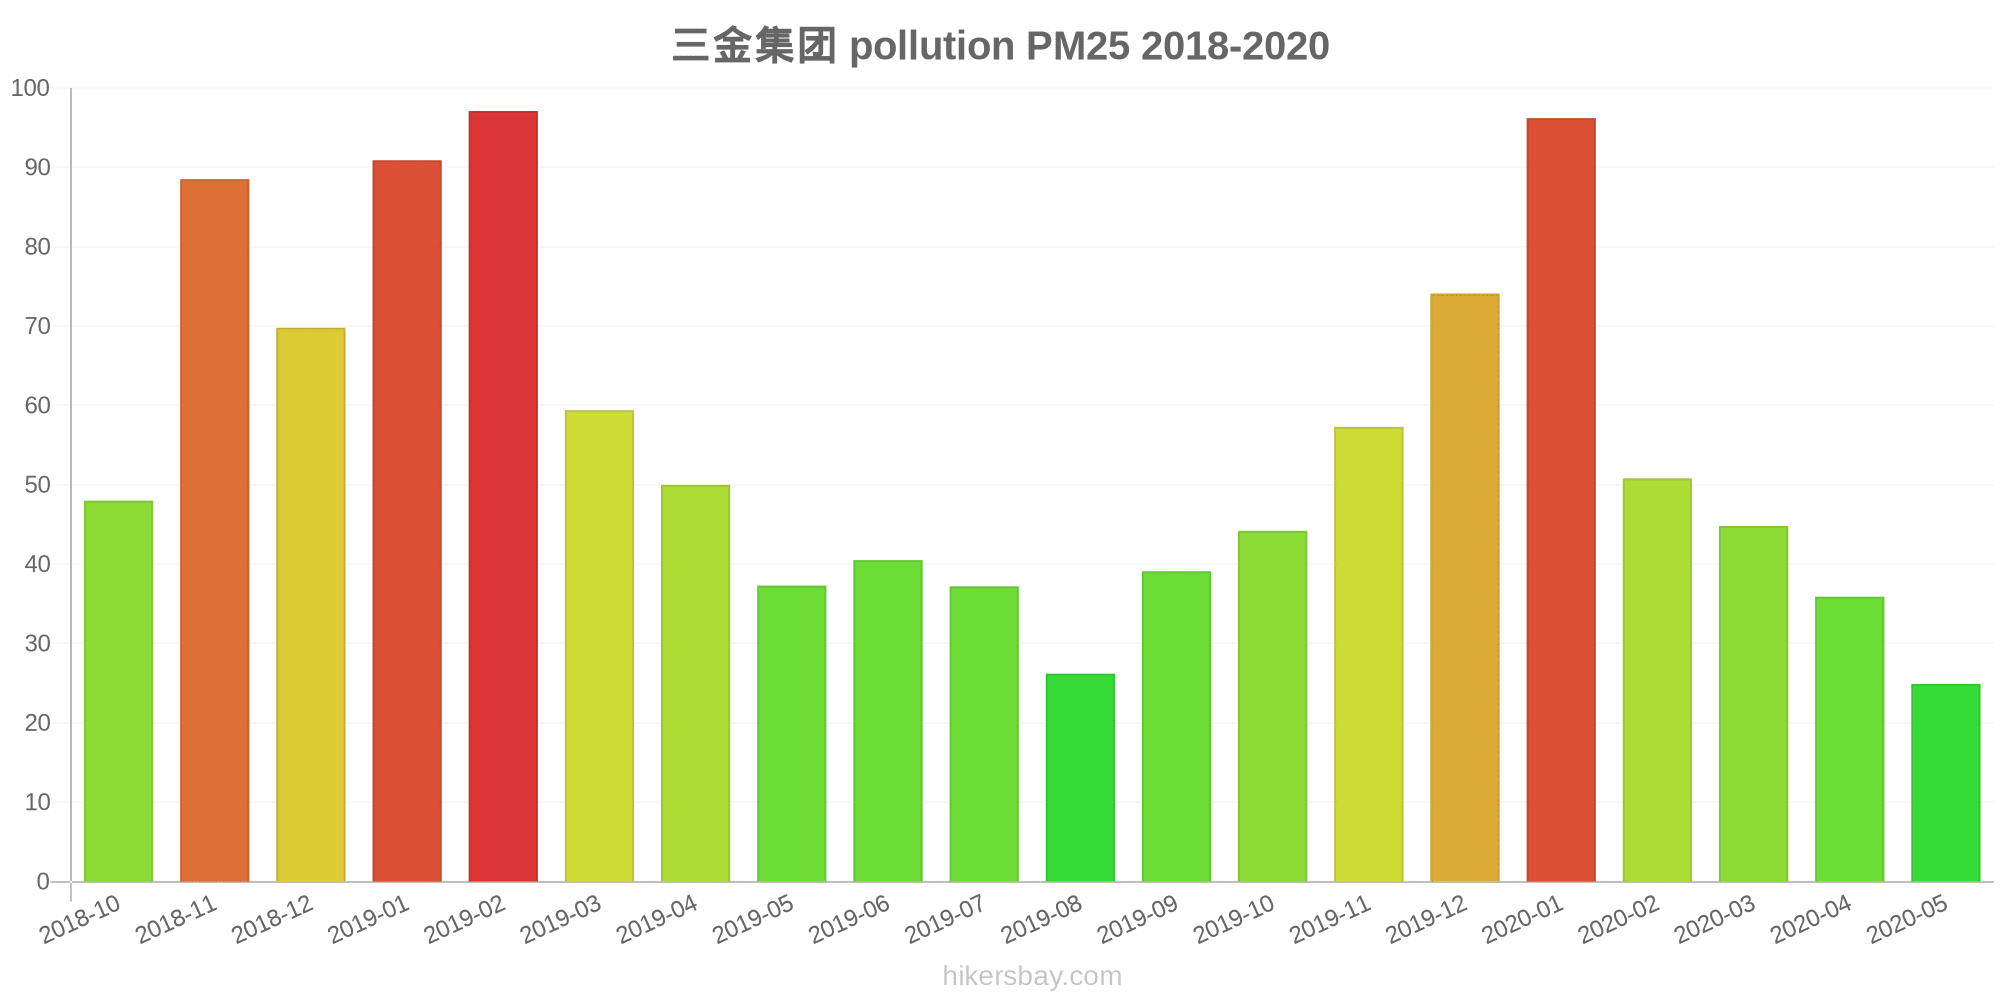
三金集团
Freitag, 27. Mai 2022, 12:00
PM10 53 (Ungesund für sensible Gruppen)
Feinstaub (PM10) Schwebestaub
O3 0.02 (gut)
Ozon (O3)
PM2,5 6.6 (gut)
Feinstaub (PM2,5)
SO2 18 (gut)
Schwefeldioxid (SO2)
NO2 3 (gut)
Stickstoffdioxid (NO2)
CO 1.3 (gut)
Kohlenmonoxid (CO)
三金集团
index
2022-05-27
pm10
51
o3
0.02
pm25
21
so2
9.6
no2
0.38
co
0.64
三金集团
2018-10 2020-05
index
2020-05
2020-04
2020-03
2020-02
2020-01
2019-12
2019-11
2019-10
2019-09
2019-08
2019-07
2019-06
2019-05
2019-04
2019-03
2019-02
2019-01
2018-12
2018-11
2018-10
pm25
25
36
45
51
96
74
57
44
39
26
37
41
37
50
59
97
91
70
89
48
co
625
749
989
995
1
1
982
783
966
878
1
991
880
1
1
1
1
1
1
1
no2
30
38
38
29
55
60
57
48
42
29
30
32
34
43
46
51
62
59
61
57
o3
158
139
118
94
78
55
84
133
191
157
220
234
184
154
124
101
60
55
95
112
pm10
58
80
85
65
123
113
118
100
81
49
62
78
96
111
115
141
148
127
155
102
so2
14
19
21
21
36
29
24
19
19
17
21
22
25
23
33
44
40
36
38
38
* Pollution data source:
https://openaq.org
(ChinaAQIData)
The data is licensed under CC-By 4.0
PM10 53 (Ungesund für sensible Gruppen)
O3 0 (gut)
PM2,5 7 (gut)
SO2 18 (gut)
NO2 3 (gut)
CO 1 (gut)
Daten zur Luftverschmutzung der letzten Tage in Dongmazhuang
| index | 2022-05-27 |
|---|---|
| pm10 | 51 Unhealthy for Sensitive Groups |
| o3 | 0 Good |
| pm25 | 21 Moderate |
| so2 | 10 Good |
| no2 | 0 Good |
| co | 1 Good |
| index | 2020-05 | 2020-04 | 2020-03 | 2020-02 | 2020-01 | 2019-12 | 2019-11 | 2019-10 | 2019-09 | 2019-08 | 2019-07 | 2019-06 | 2019-05 | 2019-04 | 2019-03 | 2019-02 | 2019-01 | 2018-12 | 2018-11 | 2018-10 |
|---|---|---|---|---|---|---|---|---|---|---|---|---|---|---|---|---|---|---|---|---|
| pm25 | 25 (Moderate) | 36 (Unhealthy for Sensitive Groups) | 45 (Unhealthy for Sensitive Groups) | 51 (Unhealthy for Sensitive Groups) | 96 (Very Unhealthy) | 74 (Unhealthy) | 57 (Unhealthy) | 44 (Unhealthy for Sensitive Groups) | 39 (Unhealthy for Sensitive Groups) | 26 (Moderate) | 37 (Unhealthy for Sensitive Groups) | 41 (Unhealthy for Sensitive Groups) | 37 (Unhealthy for Sensitive Groups) | 50 (Unhealthy for Sensitive Groups) | 59 (Unhealthy) | 97 (Very Unhealthy) | 91 (Very Unhealthy) | 70 (Unhealthy) | 89 (Very Unhealthy) | 48 (Unhealthy for Sensitive Groups) |
| co | 625 (Good) | 749 (Good) | 989 (Good) | 995 (Good) | 1 (Good) | 1 (Good) | 982 (Good) | 783 (Good) | 966 (Good) | 878 (Good) | 1 (Good) | 991 (Good) | 880 (Good) | 1 (Good) | 1 (Good) | 1 (Good) | 1 (Good) | 1 (Good) | 1 (Good) | 1 (Good) |
| no2 | 30 (Good) | 38 (Good) | 38 (Good) | 29 (Good) | 55 (Moderate) | 60 (Moderate) | 57 (Moderate) | 48 (Moderate) | 42 (Moderate) | 29 (Good) | 30 (Good) | 32 (Good) | 34 (Good) | 43 (Moderate) | 46 (Moderate) | 51 (Moderate) | 62 (Moderate) | 59 (Moderate) | 61 (Moderate) | 57 (Moderate) |
| o3 | 158 (Unhealthy) | 139 (Unhealthy for Sensitive Groups) | 118 (Moderate) | 94 (Moderate) | 78 (Moderate) | 55 (Good) | 84 (Moderate) | 133 (Unhealthy for Sensitive Groups) | 191 (Very Unhealthy) | 157 (Unhealthy) | 220 (Very Unhealthy) | 234 (Very Unhealthy) | 184 (Very Unhealthy) | 154 (Unhealthy) | 124 (Unhealthy for Sensitive Groups) | 101 (Moderate) | 60 (Good) | 55 (Good) | 95 (Moderate) | 112 (Moderate) |
| pm10 | 58 (Unhealthy for Sensitive Groups) | 80 (Unhealthy for Sensitive Groups) | 85 (Unhealthy) | 65 (Unhealthy for Sensitive Groups) | 123 (Very Unhealthy) | 113 (Very Unhealthy) | 118 (Very Unhealthy) | 100 (Unhealthy) | 81 (Unhealthy) | 49 (Moderate) | 62 (Unhealthy for Sensitive Groups) | 78 (Unhealthy for Sensitive Groups) | 96 (Unhealthy) | 111 (Very Unhealthy) | 115 (Very Unhealthy) | 141 (Very Unhealthy) | 148 (Very Unhealthy) | 127 (Very Unhealthy) | 155 (Very bad Hazardous) | 102 (Unhealthy) |
| so2 | 14 (Good) | 19 (Good) | 21 (Good) | 21 (Good) | 36 (Good) | 29 (Good) | 24 (Good) | 19 (Good) | 19 (Good) | 17 (Good) | 21 (Good) | 22 (Good) | 25 (Good) | 23 (Good) | 33 (Good) | 44 (Good) | 40 (Good) | 36 (Good) | 38 (Good) | 38 (Good) |
PM10 53 (Ungesund für sensible Gruppen)
Feinstaub (PM10) SchwebestaubO3 0.02 (gut)
Ozon (O3)PM2,5 6.6 (gut)
Feinstaub (PM2,5)SO2 18 (gut)
Schwefeldioxid (SO2)NO2 3 (gut)
Stickstoffdioxid (NO2)CO 1.3 (gut)
Kohlenmonoxid (CO)三金集团
| index | 2022-05-27 |
|---|---|
| pm10 | 51 |
| o3 | 0.02 |
| pm25 | 21 |
| so2 | 9.6 |
| no2 | 0.38 |
| co | 0.64 |
三金集团
| index | 2020-05 | 2020-04 | 2020-03 | 2020-02 | 2020-01 | 2019-12 | 2019-11 | 2019-10 | 2019-09 | 2019-08 | 2019-07 | 2019-06 | 2019-05 | 2019-04 | 2019-03 | 2019-02 | 2019-01 | 2018-12 | 2018-11 | 2018-10 |
|---|---|---|---|---|---|---|---|---|---|---|---|---|---|---|---|---|---|---|---|---|
| pm25 | 25 | 36 | 45 | 51 | 96 | 74 | 57 | 44 | 39 | 26 | 37 | 41 | 37 | 50 | 59 | 97 | 91 | 70 | 89 | 48 |
| co | 625 | 749 | 989 | 995 | 1 | 1 | 982 | 783 | 966 | 878 | 1 | 991 | 880 | 1 | 1 | 1 | 1 | 1 | 1 | 1 |
| no2 | 30 | 38 | 38 | 29 | 55 | 60 | 57 | 48 | 42 | 29 | 30 | 32 | 34 | 43 | 46 | 51 | 62 | 59 | 61 | 57 |
| o3 | 158 | 139 | 118 | 94 | 78 | 55 | 84 | 133 | 191 | 157 | 220 | 234 | 184 | 154 | 124 | 101 | 60 | 55 | 95 | 112 |
| pm10 | 58 | 80 | 85 | 65 | 123 | 113 | 118 | 100 | 81 | 49 | 62 | 78 | 96 | 111 | 115 | 141 | 148 | 127 | 155 | 102 |
| so2 | 14 | 19 | 21 | 21 | 36 | 29 | 24 | 19 | 19 | 17 | 21 | 22 | 25 | 23 | 33 | 44 | 40 | 36 | 38 | 38 |