Luftverschmutzung in Quanzi: Echtzeit-Luft-Qualitätsindex und Smog-Alarm.
Für die Quanzi. Heute ist Donnerstag, 4. Juni 2026. Für Quanzi wurden folgende Luftverschmutzungswerte gemessen:- Feinstaub (PM10) Schwebestaub - 53 (Ungesund für sensible Gruppen)
- Ozon (O3) - 0 (gut)
- Feinstaub (PM2,5) - 7 (gut)
- Schwefeldioxid (SO2) - 18 (gut)
- Stickstoffdioxid (NO2) - 3 (gut)
- Kohlenmonoxid (CO) - 1 (gut)

Wie ist die Luftqualität Quanzi heute? Ist die Luft in Quanzi? verschmutzt. Gibt es Smog?
Wie hoch ist der PM10-Stand heute in Quanzi? (Feinstaub (PM10) Schwebestaub)
Der aktuelle Feinstaubgehalt PM10 in Quanzi is:
53 (Ungesund für sensible Gruppen)
Die höchsten PM10-Werte treten in der Regel im Monat auf: 198 (Januar 2019).
Der niedrigste Wert der Feinstaub-PM10-Belastung in Quanzi ist in der Regel in: August (53).
Wie ist das O3-Niveau heute in Quanzi? (Ozon (O3))
0 (gut)
Wie hoch ist der aktuelle PM2,5-Wert in Quanzi? (Feinstaub (PM2,5))
Die heutige PM2.5-Stufe ist:
7 (gut)
Zum Vergleich: Der höchste PM2,5-Wert in Quanzi in den letzten 7 Tagen war: 21 (Freitag, 27. Mai 2022) und der niedrigste: 21 (Freitag, 27. Mai 2022).
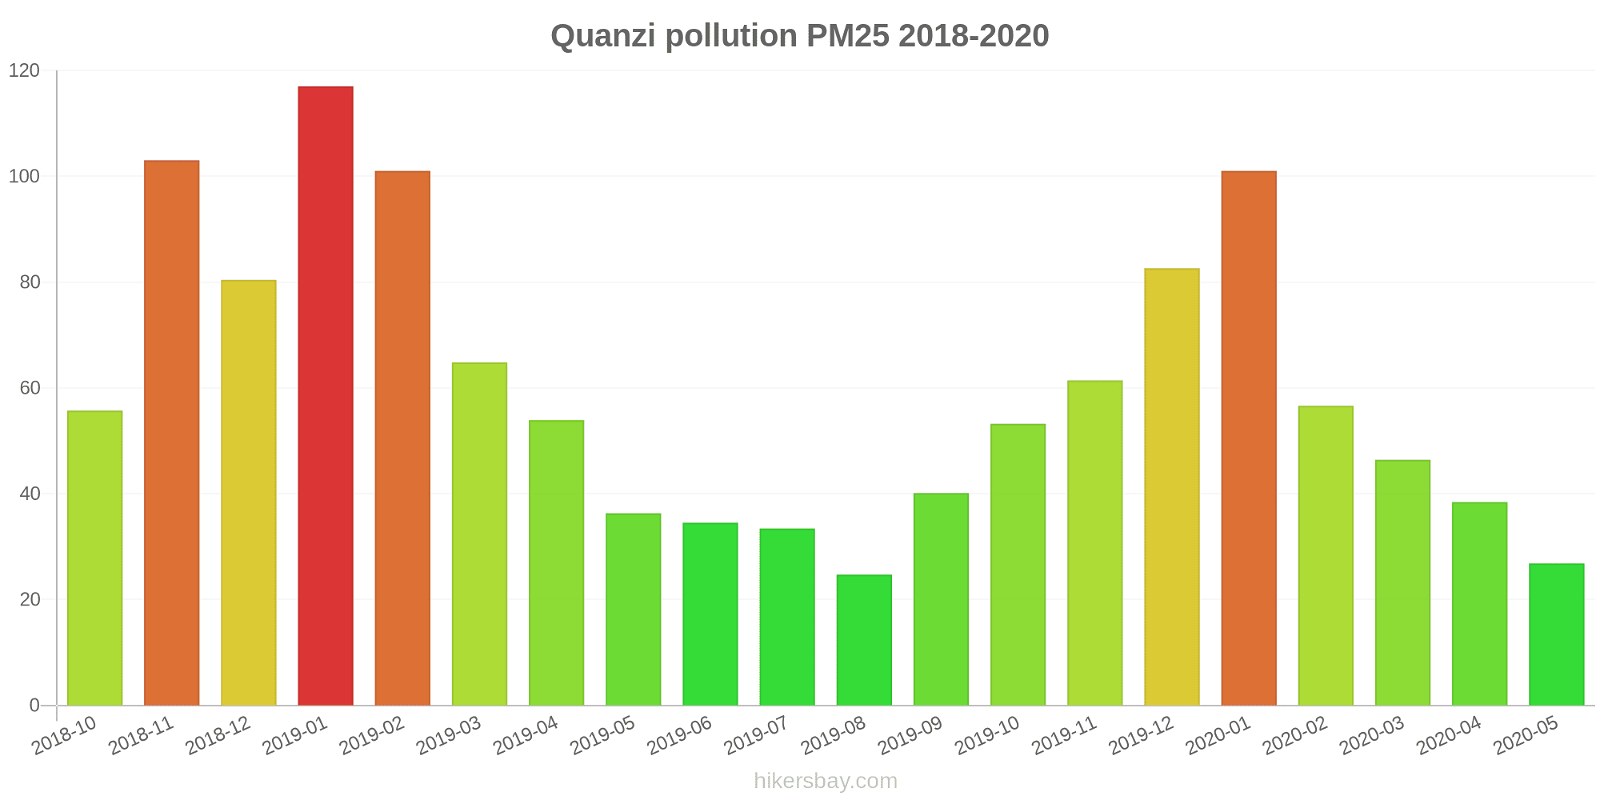
Die höchsten PM2,5-Werte wurden gemessen: 117 (Januar 2019).
Die niedrigste Feinstaubbelastung PM2,5 tritt im Monat auf: August (25).
Wie hoch ist die SO2-Belastung? (Schwefeldioxid (SO2))
18 (gut)
Wie hoch ist das NO2-Niveau? (Stickstoffdioxid (NO2))
3 (gut)
Wie hoch ist der CO-Gehalt? (Kohlenmonoxid (CO))
1 (gut)
Aktuelle Daten Freitag, 27. Mai 2022, 12:00
PM10 53 (Ungesund für sensible Gruppen)
O3 0 (gut)
PM2,5 7 (gut)
SO2 18 (gut)
NO2 3 (gut)
CO 1 (gut)
Daten zur Luftverschmutzung der letzten Tage in Quanzi
index
2022-05-27
pm10
51
Unhealthy for Sensitive Groups
o3
0
Good
pm25
21
Moderate
so2
10
Good
no2
0
Good
co
1
Good
data source »
Luftverschmutzung in Quanzi von Oktober 2018 bis Mai 2020
index
2020-05
2020-04
2020-03
2020-02
2020-01
2019-12
2019-11
2019-10
2019-09
2019-08
2019-07
2019-06
2019-05
2019-04
2019-03
2019-02
2019-01
2018-12
2018-11
2018-10
pm25
27 (Moderate)
38 (Unhealthy for Sensitive Groups)
46 (Unhealthy for Sensitive Groups)
57 (Unhealthy)
101 (Very Unhealthy)
83 (Very Unhealthy)
61 (Unhealthy)
53 (Unhealthy for Sensitive Groups)
40 (Unhealthy for Sensitive Groups)
25 (Moderate)
33 (Moderate)
35 (Moderate)
36 (Unhealthy for Sensitive Groups)
54 (Unhealthy for Sensitive Groups)
65 (Unhealthy)
101 (Very Unhealthy)
117 (Very bad Hazardous)
80 (Very Unhealthy)
103 (Very Unhealthy)
56 (Unhealthy)
co
981 (Good)
876 (Good)
1 (Good)
1 (Good)
1 (Good)
1 (Good)
1 (Good)
1 (Good)
937 (Good)
848 (Good)
1 (Good)
770 (Good)
734 (Good)
822 (Good)
926 (Good)
1 (Good)
1 (Good)
1 (Good)
1 (Good)
851 (Good)
no2
21 (Good)
35 (Good)
32 (Good)
23 (Good)
36 (Good)
48 (Moderate)
46 (Moderate)
42 (Moderate)
40 (Moderate)
26 (Good)
25 (Good)
26 (Good)
37 (Good)
38 (Good)
40 (Moderate)
47 (Moderate)
59 (Moderate)
52 (Moderate)
53 (Moderate)
49 (Moderate)
o3
150 (Unhealthy)
130 (Unhealthy for Sensitive Groups)
112 (Moderate)
91 (Moderate)
73 (Moderate)
61 (Good)
87 (Moderate)
122 (Unhealthy for Sensitive Groups)
176 (Unhealthy)
134 (Unhealthy for Sensitive Groups)
193 (Very Unhealthy)
219 (Very Unhealthy)
174 (Unhealthy)
143 (Unhealthy for Sensitive Groups)
127 (Unhealthy for Sensitive Groups)
99 (Moderate)
66 (Good)
59 (Good)
86 (Moderate)
110 (Moderate)
pm10
61 (Unhealthy for Sensitive Groups)
94 (Unhealthy)
108 (Unhealthy)
83 (Unhealthy)
144 (Very Unhealthy)
129 (Very Unhealthy)
135 (Very Unhealthy)
120 (Very Unhealthy)
87 (Unhealthy)
53 (Unhealthy for Sensitive Groups)
65 (Unhealthy for Sensitive Groups)
78 (Unhealthy for Sensitive Groups)
101 (Unhealthy)
106 (Unhealthy)
133 (Very Unhealthy)
154 (Very bad Hazardous)
198 (Very bad Hazardous)
155 (Very bad Hazardous)
189 (Very bad Hazardous)
123 (Very Unhealthy)
so2
12 (Good)
15 (Good)
13 (Good)
12 (Good)
19 (Good)
21 (Good)
15 (Good)
12 (Good)
12 (Good)
11 (Good)
10 (Good)
15 (Good)
16 (Good)
18 (Good)
20 (Good)
26 (Good)
33 (Good)
19 (Good)
15 (Good)
13 (Good)
data source »
泰兴公司(启用170519)
Freitag, 27. Mai 2022, 12:00
PM10 53 (Ungesund für sensible Gruppen)
Feinstaub (PM10) Schwebestaub
O3 0.02 (gut)
Ozon (O3)
PM2,5 6.6 (gut)
Feinstaub (PM2,5)
SO2 18 (gut)
Schwefeldioxid (SO2)
NO2 3 (gut)
Stickstoffdioxid (NO2)
CO 1.3 (gut)
Kohlenmonoxid (CO)
泰兴公司(启用170519)
index
2022-05-27
pm10
51
o3
0.02
pm25
21
so2
9.6
no2
0.38
co
0.64
泰兴公司
2018-10 2020-05
index
2020-05
2020-04
2020-03
2020-02
2020-01
2019-12
2019-11
2019-10
2019-09
2019-08
2019-07
2019-06
2019-05
2019-04
2019-03
2019-02
2019-01
2018-12
2018-11
2018-10
pm25
27
38
46
57
101
83
61
53
40
25
33
35
36
54
65
101
117
80
103
56
co
981
876
1
1
1
1
1
1
937
848
1
770
734
822
926
1
1
1
1
851
no2
21
35
32
23
36
48
46
42
40
26
25
26
37
38
40
47
59
52
53
49
o3
150
130
112
91
73
61
87
122
176
134
193
219
174
143
127
99
66
59
86
110
pm10
61
94
108
83
144
129
135
120
87
53
65
78
101
106
133
154
198
155
189
123
so2
12
15
13
12
19
21
15
12
12
11
10
15
16
18
20
26
33
19
15
13
* Pollution data source:
https://openaq.org
(ChinaAQIData)
The data is licensed under CC-By 4.0
PM10 53 (Ungesund für sensible Gruppen)
O3 0 (gut)
PM2,5 7 (gut)
SO2 18 (gut)
NO2 3 (gut)
CO 1 (gut)
Daten zur Luftverschmutzung der letzten Tage in Quanzi
| index | 2022-05-27 |
|---|---|
| pm10 | 51 Unhealthy for Sensitive Groups |
| o3 | 0 Good |
| pm25 | 21 Moderate |
| so2 | 10 Good |
| no2 | 0 Good |
| co | 1 Good |

| index | 2020-05 | 2020-04 | 2020-03 | 2020-02 | 2020-01 | 2019-12 | 2019-11 | 2019-10 | 2019-09 | 2019-08 | 2019-07 | 2019-06 | 2019-05 | 2019-04 | 2019-03 | 2019-02 | 2019-01 | 2018-12 | 2018-11 | 2018-10 |
|---|---|---|---|---|---|---|---|---|---|---|---|---|---|---|---|---|---|---|---|---|
| pm25 | 27 (Moderate) | 38 (Unhealthy for Sensitive Groups) | 46 (Unhealthy for Sensitive Groups) | 57 (Unhealthy) | 101 (Very Unhealthy) | 83 (Very Unhealthy) | 61 (Unhealthy) | 53 (Unhealthy for Sensitive Groups) | 40 (Unhealthy for Sensitive Groups) | 25 (Moderate) | 33 (Moderate) | 35 (Moderate) | 36 (Unhealthy for Sensitive Groups) | 54 (Unhealthy for Sensitive Groups) | 65 (Unhealthy) | 101 (Very Unhealthy) | 117 (Very bad Hazardous) | 80 (Very Unhealthy) | 103 (Very Unhealthy) | 56 (Unhealthy) |
| co | 981 (Good) | 876 (Good) | 1 (Good) | 1 (Good) | 1 (Good) | 1 (Good) | 1 (Good) | 1 (Good) | 937 (Good) | 848 (Good) | 1 (Good) | 770 (Good) | 734 (Good) | 822 (Good) | 926 (Good) | 1 (Good) | 1 (Good) | 1 (Good) | 1 (Good) | 851 (Good) |
| no2 | 21 (Good) | 35 (Good) | 32 (Good) | 23 (Good) | 36 (Good) | 48 (Moderate) | 46 (Moderate) | 42 (Moderate) | 40 (Moderate) | 26 (Good) | 25 (Good) | 26 (Good) | 37 (Good) | 38 (Good) | 40 (Moderate) | 47 (Moderate) | 59 (Moderate) | 52 (Moderate) | 53 (Moderate) | 49 (Moderate) |
| o3 | 150 (Unhealthy) | 130 (Unhealthy for Sensitive Groups) | 112 (Moderate) | 91 (Moderate) | 73 (Moderate) | 61 (Good) | 87 (Moderate) | 122 (Unhealthy for Sensitive Groups) | 176 (Unhealthy) | 134 (Unhealthy for Sensitive Groups) | 193 (Very Unhealthy) | 219 (Very Unhealthy) | 174 (Unhealthy) | 143 (Unhealthy for Sensitive Groups) | 127 (Unhealthy for Sensitive Groups) | 99 (Moderate) | 66 (Good) | 59 (Good) | 86 (Moderate) | 110 (Moderate) |
| pm10 | 61 (Unhealthy for Sensitive Groups) | 94 (Unhealthy) | 108 (Unhealthy) | 83 (Unhealthy) | 144 (Very Unhealthy) | 129 (Very Unhealthy) | 135 (Very Unhealthy) | 120 (Very Unhealthy) | 87 (Unhealthy) | 53 (Unhealthy for Sensitive Groups) | 65 (Unhealthy for Sensitive Groups) | 78 (Unhealthy for Sensitive Groups) | 101 (Unhealthy) | 106 (Unhealthy) | 133 (Very Unhealthy) | 154 (Very bad Hazardous) | 198 (Very bad Hazardous) | 155 (Very bad Hazardous) | 189 (Very bad Hazardous) | 123 (Very Unhealthy) |
| so2 | 12 (Good) | 15 (Good) | 13 (Good) | 12 (Good) | 19 (Good) | 21 (Good) | 15 (Good) | 12 (Good) | 12 (Good) | 11 (Good) | 10 (Good) | 15 (Good) | 16 (Good) | 18 (Good) | 20 (Good) | 26 (Good) | 33 (Good) | 19 (Good) | 15 (Good) | 13 (Good) |
PM10 53 (Ungesund für sensible Gruppen)
Feinstaub (PM10) SchwebestaubO3 0.02 (gut)
Ozon (O3)PM2,5 6.6 (gut)
Feinstaub (PM2,5)SO2 18 (gut)
Schwefeldioxid (SO2)NO2 3 (gut)
Stickstoffdioxid (NO2)CO 1.3 (gut)
Kohlenmonoxid (CO)泰兴公司(启用170519)
| index | 2022-05-27 |
|---|---|
| pm10 | 51 |
| o3 | 0.02 |
| pm25 | 21 |
| so2 | 9.6 |
| no2 | 0.38 |
| co | 0.64 |
泰兴公司

| index | 2020-05 | 2020-04 | 2020-03 | 2020-02 | 2020-01 | 2019-12 | 2019-11 | 2019-10 | 2019-09 | 2019-08 | 2019-07 | 2019-06 | 2019-05 | 2019-04 | 2019-03 | 2019-02 | 2019-01 | 2018-12 | 2018-11 | 2018-10 |
|---|---|---|---|---|---|---|---|---|---|---|---|---|---|---|---|---|---|---|---|---|
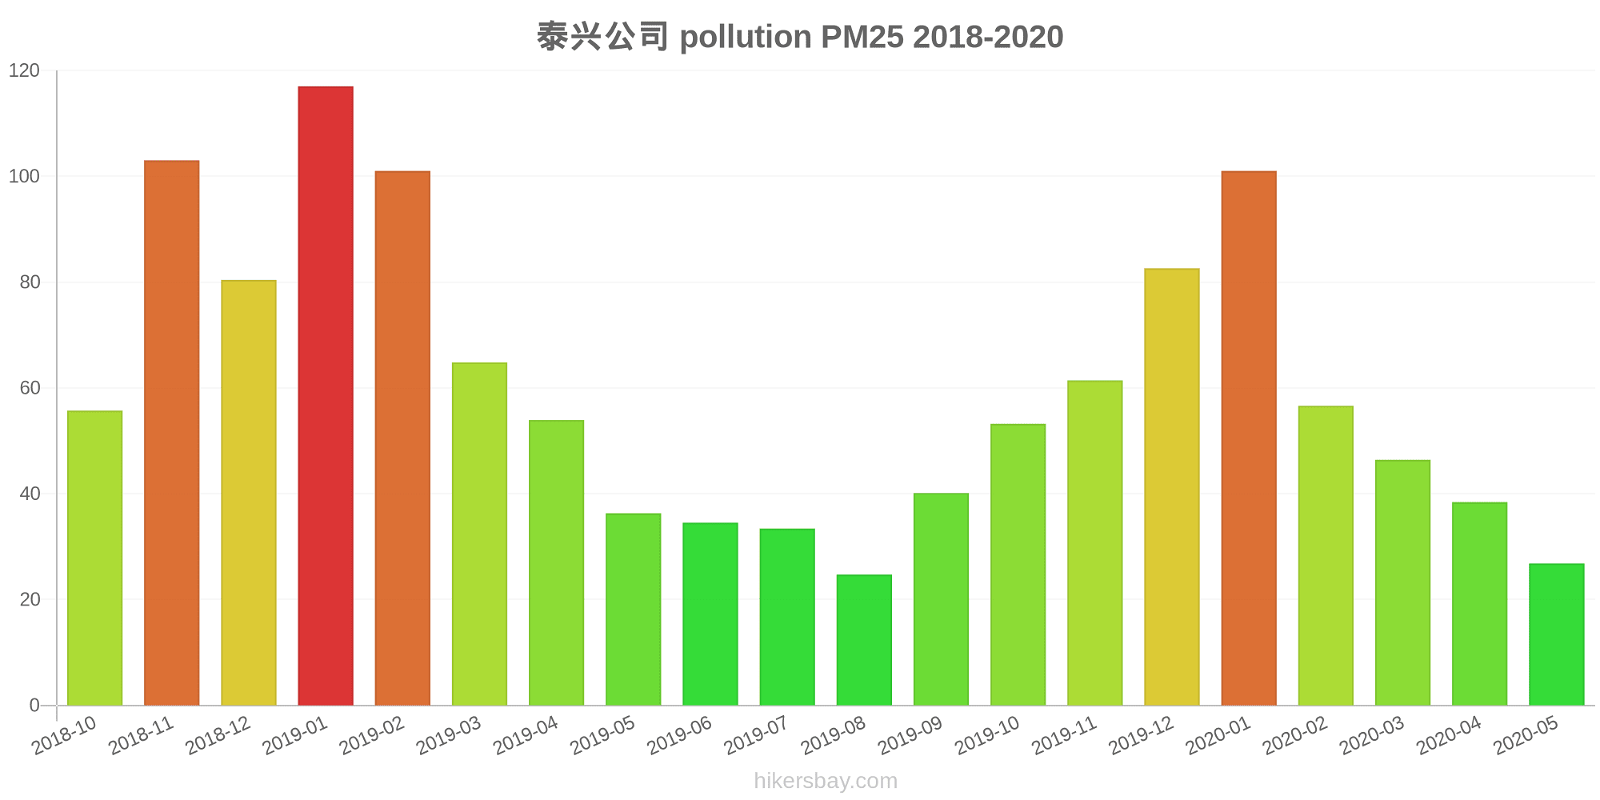
| pm25 | 27 | 38 | 46 | 57 | 101 | 83 | 61 | 53 | 40 | 25 | 33 | 35 | 36 | 54 | 65 | 101 | 117 | 80 | 103 | 56 |
| co | 981 | 876 | 1 | 1 | 1 | 1 | 1 | 1 | 937 | 848 | 1 | 770 | 734 | 822 | 926 | 1 | 1 | 1 | 1 | 851 |
| no2 | 21 | 35 | 32 | 23 | 36 | 48 | 46 | 42 | 40 | 26 | 25 | 26 | 37 | 38 | 40 | 47 | 59 | 52 | 53 | 49 |
| o3 | 150 | 130 | 112 | 91 | 73 | 61 | 87 | 122 | 176 | 134 | 193 | 219 | 174 | 143 | 127 | 99 | 66 | 59 | 86 | 110 |
| pm10 | 61 | 94 | 108 | 83 | 144 | 129 | 135 | 120 | 87 | 53 | 65 | 78 | 101 | 106 | 133 | 154 | 198 | 155 | 189 | 123 |
| so2 | 12 | 15 | 13 | 12 | 19 | 21 | 15 | 12 | 12 | 11 | 10 | 15 | 16 | 18 | 20 | 26 | 33 | 19 | 15 | 13 |