Luftverschmutzung in Weijia: Echtzeit-Luft-Qualitätsindex und Smog-Alarm.
Für die Weijia. Heute ist Donnerstag, 4. Juni 2026. Für Weijia wurden folgende Luftverschmutzungswerte gemessen:- Feinstaub (PM10) Schwebestaub - 53 (Ungesund für sensible Gruppen)
- Ozon (O3) - 0 (gut)
- Feinstaub (PM2,5) - 7 (gut)
- Schwefeldioxid (SO2) - 18 (gut)
- Stickstoffdioxid (NO2) - 3 (gut)
- Kohlenmonoxid (CO) - 1 (gut)

Wie ist die Luftqualität Weijia heute? Ist die Luft in Weijia? verschmutzt. Gibt es Smog?
Wie hoch ist der PM10-Stand heute in Weijia? (Feinstaub (PM10) Schwebestaub)
Der aktuelle Feinstaubgehalt PM10 in Weijia is:
53 (Ungesund für sensible Gruppen)
Die höchsten PM10-Werte treten in der Regel im Monat auf: 169 (November 2018).
Der niedrigste Wert der Feinstaub-PM10-Belastung in Weijia ist in der Regel in: August (56).
Wie ist das O3-Niveau heute in Weijia? (Ozon (O3))
0 (gut)
Wie hoch ist der aktuelle PM2,5-Wert in Weijia? (Feinstaub (PM2,5))
Die heutige PM2.5-Stufe ist:
7 (gut)
Zum Vergleich: Der höchste PM2,5-Wert in Weijia in den letzten 7 Tagen war: 21 (Freitag, 27. Mai 2022) und der niedrigste: 21 (Freitag, 27. Mai 2022).
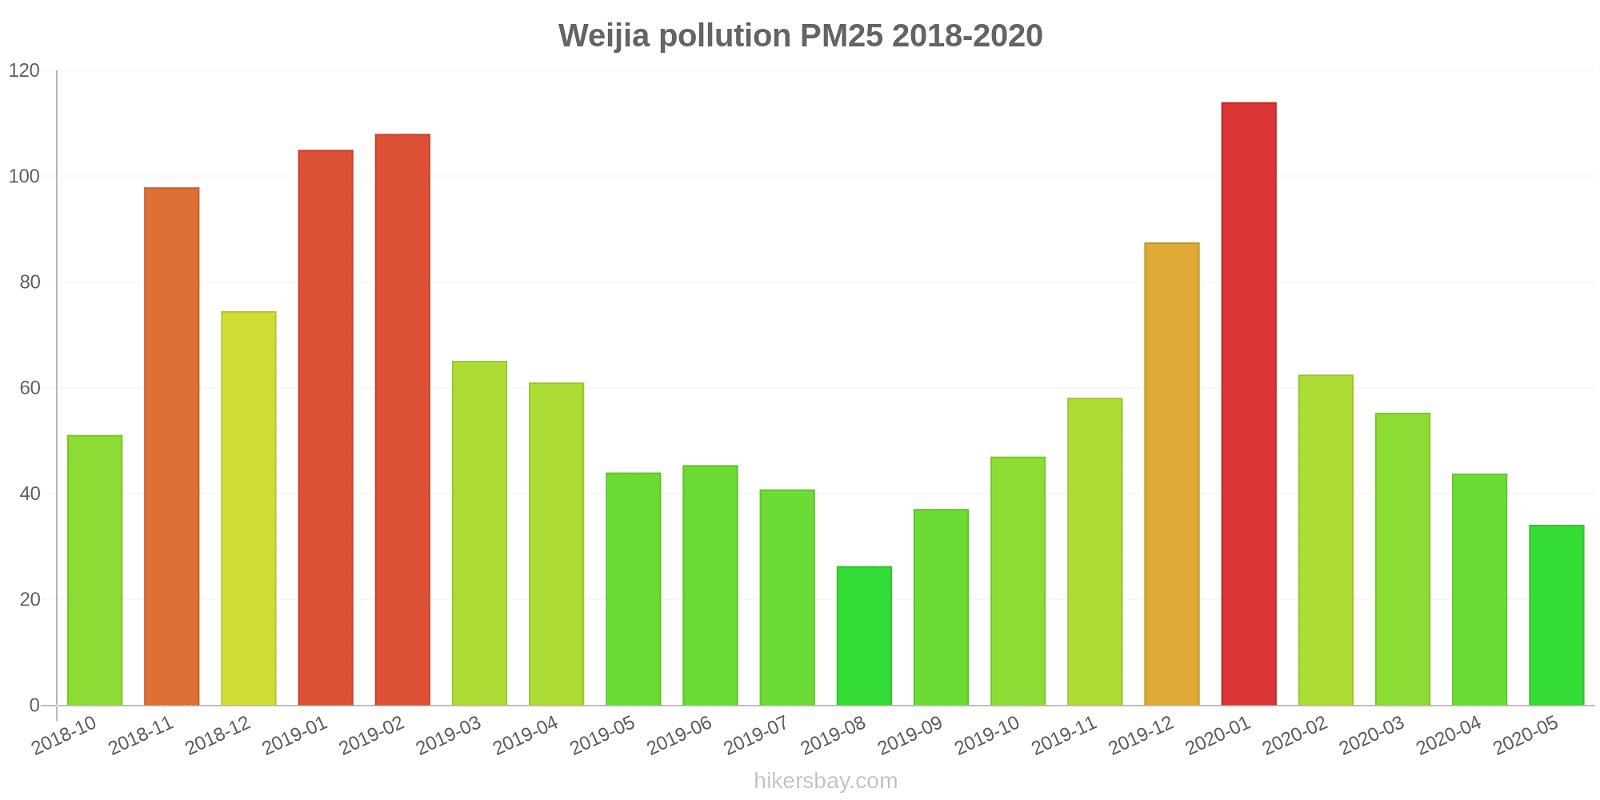
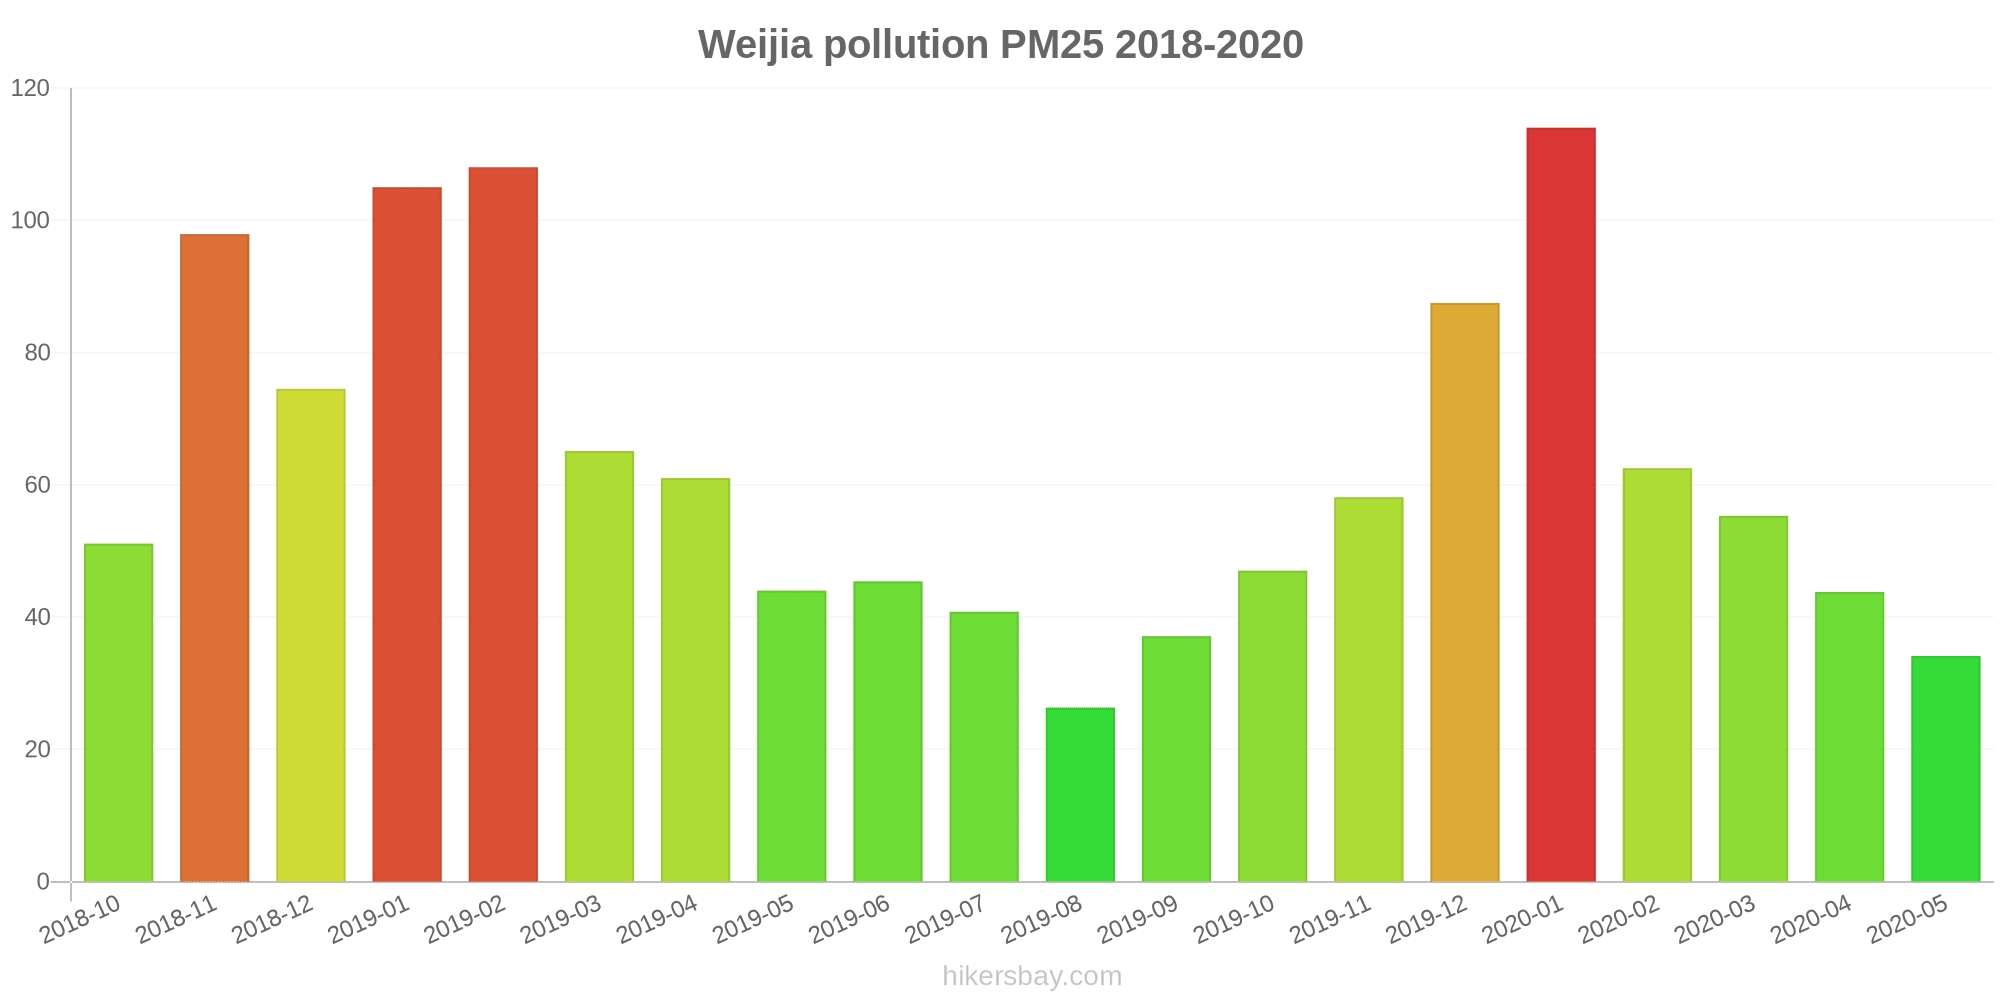
Die höchsten PM2,5-Werte wurden gemessen: 114 (Januar 2020).
Die niedrigste Feinstaubbelastung PM2,5 tritt im Monat auf: August (26).
Wie hoch ist die SO2-Belastung? (Schwefeldioxid (SO2))
18 (gut)
Wie hoch ist das NO2-Niveau? (Stickstoffdioxid (NO2))
3 (gut)
Wie hoch ist der CO-Gehalt? (Kohlenmonoxid (CO))
1 (gut)
Aktuelle Daten Freitag, 27. Mai 2022, 12:00
PM10 53 (Ungesund für sensible Gruppen)
O3 0 (gut)
PM2,5 7 (gut)
SO2 18 (gut)
NO2 3 (gut)
CO 1 (gut)
Daten zur Luftverschmutzung der letzten Tage in Weijia
index
2022-05-27
pm10
51
Unhealthy for Sensitive Groups
o3
0
Good
pm25
21
Moderate
so2
10
Good
no2
0
Good
co
1
Good
data source »
Luftverschmutzung in Weijia von Oktober 2018 bis Mai 2020
index
2020-05
2020-04
2020-03
2020-02
2020-01
2019-12
2019-11
2019-10
2019-09
2019-08
2019-07
2019-06
2019-05
2019-04
2019-03
2019-02
2019-01
2018-12
2018-11
2018-10
pm25
34 (Moderate)
44 (Unhealthy for Sensitive Groups)
55 (Unhealthy)
63 (Unhealthy)
114 (Very bad Hazardous)
88 (Very Unhealthy)
58 (Unhealthy)
47 (Unhealthy for Sensitive Groups)
37 (Unhealthy for Sensitive Groups)
26 (Moderate)
41 (Unhealthy for Sensitive Groups)
45 (Unhealthy for Sensitive Groups)
44 (Unhealthy for Sensitive Groups)
61 (Unhealthy)
65 (Unhealthy)
108 (Very Unhealthy)
105 (Very Unhealthy)
75 (Unhealthy)
98 (Very Unhealthy)
51 (Unhealthy for Sensitive Groups)
co
702 (Good)
738 (Good)
752 (Good)
811 (Good)
1 (Good)
1 (Good)
1 (Good)
788 (Good)
668 (Good)
474 (Good)
734 (Good)
536 (Good)
643 (Good)
846 (Good)
890 (Good)
1 (Good)
1 (Good)
1 (Good)
1 (Good)
996 (Good)
no2
29 (Good)
47 (Moderate)
47 (Moderate)
30 (Good)
56 (Moderate)
56 (Moderate)
54 (Moderate)
51 (Moderate)
48 (Moderate)
34 (Good)
28 (Good)
32 (Good)
37 (Good)
43 (Moderate)
48 (Moderate)
50 (Moderate)
58 (Moderate)
57 (Moderate)
61 (Moderate)
61 (Moderate)
o3
148 (Unhealthy for Sensitive Groups)
131 (Unhealthy for Sensitive Groups)
114 (Moderate)
91 (Moderate)
75 (Moderate)
51 (Good)
76 (Moderate)
124 (Unhealthy for Sensitive Groups)
185 (Very Unhealthy)
152 (Unhealthy)
209 (Very Unhealthy)
231 (Very Unhealthy)
186 (Very Unhealthy)
148 (Unhealthy for Sensitive Groups)
127 (Unhealthy for Sensitive Groups)
101 (Moderate)
58 (Good)
57 (Good)
99 (Moderate)
111 (Moderate)
pm10
71 (Unhealthy for Sensitive Groups)
99 (Unhealthy)
105 (Unhealthy)
76 (Unhealthy for Sensitive Groups)
143 (Very Unhealthy)
129 (Very Unhealthy)
132 (Very Unhealthy)
120 (Very Unhealthy)
93 (Unhealthy)
56 (Unhealthy for Sensitive Groups)
65 (Unhealthy for Sensitive Groups)
80 (Unhealthy)
104 (Unhealthy)
120 (Very Unhealthy)
128 (Very Unhealthy)
151 (Very bad Hazardous)
167 (Very bad Hazardous)
136 (Very Unhealthy)
169 (Very bad Hazardous)
119 (Very Unhealthy)
so2
15 (Good)
17 (Good)
15 (Good)
11 (Good)
26 (Good)
19 (Good)
19 (Good)
15 (Good)
13 (Good)
8.6 (Good)
8.9 (Good)
17 (Good)
22 (Good)
22 (Good)
29 (Good)
27 (Good)
30 (Good)
27 (Good)
29 (Good)
24 (Good)
data source »
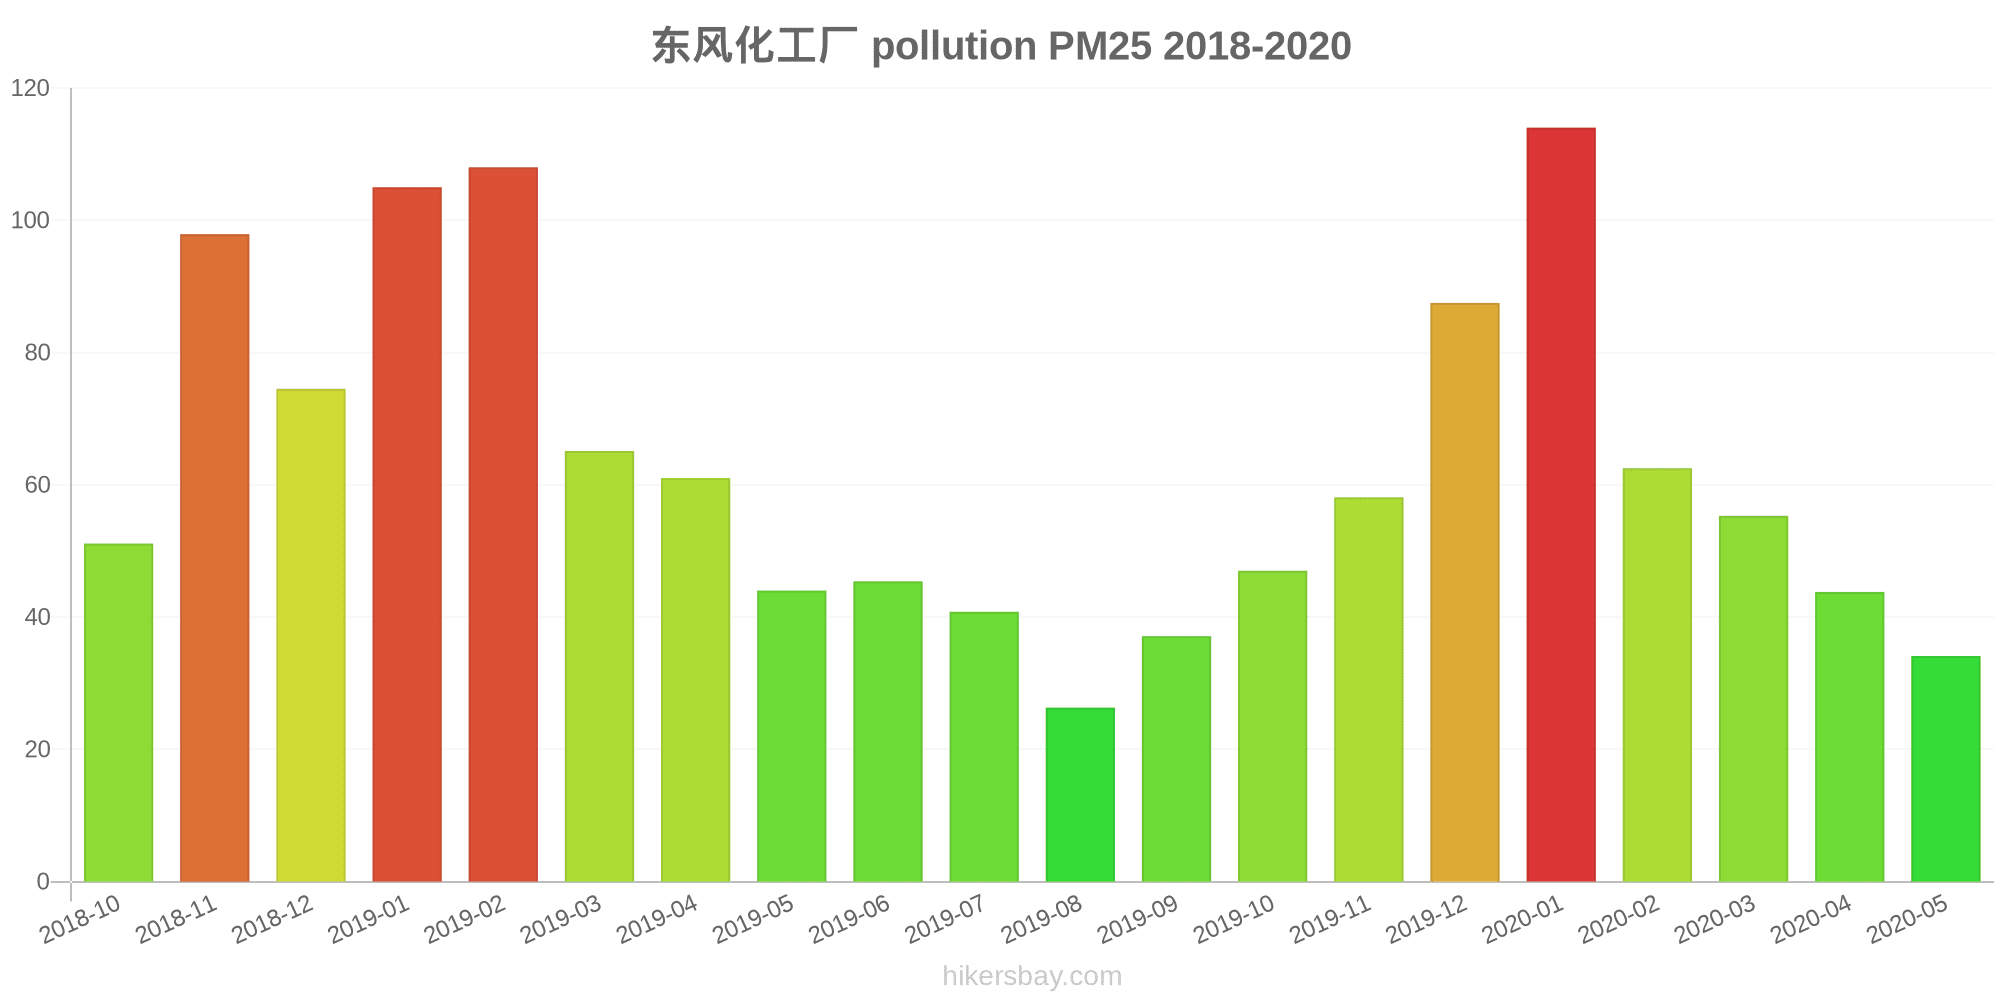
东风化工厂
Freitag, 27. Mai 2022, 12:00
PM10 53 (Ungesund für sensible Gruppen)
Feinstaub (PM10) Schwebestaub
O3 0.02 (gut)
Ozon (O3)
PM2,5 6.6 (gut)
Feinstaub (PM2,5)
SO2 18 (gut)
Schwefeldioxid (SO2)
NO2 3 (gut)
Stickstoffdioxid (NO2)
CO 1.3 (gut)
Kohlenmonoxid (CO)
东风化工厂
index
2022-05-27
pm10
51
o3
0.02
pm25
21
so2
9.6
no2
0.38
co
0.64
东风化工厂
2018-10 2020-05

index
2020-05
2020-04
2020-03
2020-02
2020-01
2019-12
2019-11
2019-10
2019-09
2019-08
2019-07
2019-06
2019-05
2019-04
2019-03
2019-02
2019-01
2018-12
2018-11
2018-10
pm25
34
44
55
63
114
88
58
47
37
26
41
45
44
61
65
108
105
75
98
51
co
702
738
752
811
1
1
1
788
668
474
734
536
643
846
890
1
1
1
1
996
no2
29
47
47
30
56
56
54
51
48
34
28
32
37
43
48
50
58
57
61
61
o3
148
131
114
91
75
51
76
124
185
152
209
231
186
148
127
101
58
57
99
111
pm10
71
99
105
76
143
129
132
120
93
56
65
80
104
120
128
151
167
136
169
119
so2
15
17
15
11
26
19
19
15
13
8.6
8.9
17
22
22
29
27
30
27
29
24
* Pollution data source:
https://openaq.org
(ChinaAQIData)
The data is licensed under CC-By 4.0
PM10 53 (Ungesund für sensible Gruppen)
O3 0 (gut)
PM2,5 7 (gut)
SO2 18 (gut)
NO2 3 (gut)
CO 1 (gut)
Daten zur Luftverschmutzung der letzten Tage in Weijia
| index | 2022-05-27 |
|---|---|
| pm10 | 51 Unhealthy for Sensitive Groups |
| o3 | 0 Good |
| pm25 | 21 Moderate |
| so2 | 10 Good |
| no2 | 0 Good |
| co | 1 Good |
| index | 2020-05 | 2020-04 | 2020-03 | 2020-02 | 2020-01 | 2019-12 | 2019-11 | 2019-10 | 2019-09 | 2019-08 | 2019-07 | 2019-06 | 2019-05 | 2019-04 | 2019-03 | 2019-02 | 2019-01 | 2018-12 | 2018-11 | 2018-10 |
|---|---|---|---|---|---|---|---|---|---|---|---|---|---|---|---|---|---|---|---|---|
| pm25 | 34 (Moderate) | 44 (Unhealthy for Sensitive Groups) | 55 (Unhealthy) | 63 (Unhealthy) | 114 (Very bad Hazardous) | 88 (Very Unhealthy) | 58 (Unhealthy) | 47 (Unhealthy for Sensitive Groups) | 37 (Unhealthy for Sensitive Groups) | 26 (Moderate) | 41 (Unhealthy for Sensitive Groups) | 45 (Unhealthy for Sensitive Groups) | 44 (Unhealthy for Sensitive Groups) | 61 (Unhealthy) | 65 (Unhealthy) | 108 (Very Unhealthy) | 105 (Very Unhealthy) | 75 (Unhealthy) | 98 (Very Unhealthy) | 51 (Unhealthy for Sensitive Groups) |
| co | 702 (Good) | 738 (Good) | 752 (Good) | 811 (Good) | 1 (Good) | 1 (Good) | 1 (Good) | 788 (Good) | 668 (Good) | 474 (Good) | 734 (Good) | 536 (Good) | 643 (Good) | 846 (Good) | 890 (Good) | 1 (Good) | 1 (Good) | 1 (Good) | 1 (Good) | 996 (Good) |
| no2 | 29 (Good) | 47 (Moderate) | 47 (Moderate) | 30 (Good) | 56 (Moderate) | 56 (Moderate) | 54 (Moderate) | 51 (Moderate) | 48 (Moderate) | 34 (Good) | 28 (Good) | 32 (Good) | 37 (Good) | 43 (Moderate) | 48 (Moderate) | 50 (Moderate) | 58 (Moderate) | 57 (Moderate) | 61 (Moderate) | 61 (Moderate) |
| o3 | 148 (Unhealthy for Sensitive Groups) | 131 (Unhealthy for Sensitive Groups) | 114 (Moderate) | 91 (Moderate) | 75 (Moderate) | 51 (Good) | 76 (Moderate) | 124 (Unhealthy for Sensitive Groups) | 185 (Very Unhealthy) | 152 (Unhealthy) | 209 (Very Unhealthy) | 231 (Very Unhealthy) | 186 (Very Unhealthy) | 148 (Unhealthy for Sensitive Groups) | 127 (Unhealthy for Sensitive Groups) | 101 (Moderate) | 58 (Good) | 57 (Good) | 99 (Moderate) | 111 (Moderate) |
| pm10 | 71 (Unhealthy for Sensitive Groups) | 99 (Unhealthy) | 105 (Unhealthy) | 76 (Unhealthy for Sensitive Groups) | 143 (Very Unhealthy) | 129 (Very Unhealthy) | 132 (Very Unhealthy) | 120 (Very Unhealthy) | 93 (Unhealthy) | 56 (Unhealthy for Sensitive Groups) | 65 (Unhealthy for Sensitive Groups) | 80 (Unhealthy) | 104 (Unhealthy) | 120 (Very Unhealthy) | 128 (Very Unhealthy) | 151 (Very bad Hazardous) | 167 (Very bad Hazardous) | 136 (Very Unhealthy) | 169 (Very bad Hazardous) | 119 (Very Unhealthy) |
| so2 | 15 (Good) | 17 (Good) | 15 (Good) | 11 (Good) | 26 (Good) | 19 (Good) | 19 (Good) | 15 (Good) | 13 (Good) | 8.6 (Good) | 8.9 (Good) | 17 (Good) | 22 (Good) | 22 (Good) | 29 (Good) | 27 (Good) | 30 (Good) | 27 (Good) | 29 (Good) | 24 (Good) |
PM10 53 (Ungesund für sensible Gruppen)
Feinstaub (PM10) SchwebestaubO3 0.02 (gut)
Ozon (O3)PM2,5 6.6 (gut)
Feinstaub (PM2,5)SO2 18 (gut)
Schwefeldioxid (SO2)NO2 3 (gut)
Stickstoffdioxid (NO2)CO 1.3 (gut)
Kohlenmonoxid (CO)东风化工厂
| index | 2022-05-27 |
|---|---|
| pm10 | 51 |
| o3 | 0.02 |
| pm25 | 21 |
| so2 | 9.6 |
| no2 | 0.38 |
| co | 0.64 |
东风化工厂
| index | 2020-05 | 2020-04 | 2020-03 | 2020-02 | 2020-01 | 2019-12 | 2019-11 | 2019-10 | 2019-09 | 2019-08 | 2019-07 | 2019-06 | 2019-05 | 2019-04 | 2019-03 | 2019-02 | 2019-01 | 2018-12 | 2018-11 | 2018-10 |
|---|---|---|---|---|---|---|---|---|---|---|---|---|---|---|---|---|---|---|---|---|
| pm25 | 34 | 44 | 55 | 63 | 114 | 88 | 58 | 47 | 37 | 26 | 41 | 45 | 44 | 61 | 65 | 108 | 105 | 75 | 98 | 51 |
| co | 702 | 738 | 752 | 811 | 1 | 1 | 1 | 788 | 668 | 474 | 734 | 536 | 643 | 846 | 890 | 1 | 1 | 1 | 1 | 996 |
| no2 | 29 | 47 | 47 | 30 | 56 | 56 | 54 | 51 | 48 | 34 | 28 | 32 | 37 | 43 | 48 | 50 | 58 | 57 | 61 | 61 |
| o3 | 148 | 131 | 114 | 91 | 75 | 51 | 76 | 124 | 185 | 152 | 209 | 231 | 186 | 148 | 127 | 101 | 58 | 57 | 99 | 111 |
| pm10 | 71 | 99 | 105 | 76 | 143 | 129 | 132 | 120 | 93 | 56 | 65 | 80 | 104 | 120 | 128 | 151 | 167 | 136 | 169 | 119 |
| so2 | 15 | 17 | 15 | 11 | 26 | 19 | 19 | 15 | 13 | 8.6 | 8.9 | 17 | 22 | 22 | 29 | 27 | 30 | 27 | 29 | 24 |