Luftverschmutzung in Shihuayuan: Echtzeit-Luft-Qualitätsindex und Smog-Alarm.
Für die Shihuayuan. Heute ist Donnerstag, 4. Juni 2026. Für Shihuayuan wurden folgende Luftverschmutzungswerte gemessen:- Feinstaub (PM10) Schwebestaub - 53 (Ungesund für sensible Gruppen)
- Ozon (O3) - 0 (gut)
- Feinstaub (PM2,5) - 7 (gut)
- Schwefeldioxid (SO2) - 18 (gut)
- Stickstoffdioxid (NO2) - 3 (gut)
- Kohlenmonoxid (CO) - 1 (gut)

Wie ist die Luftqualität Shihuayuan heute? Ist die Luft in Shihuayuan? verschmutzt. Gibt es Smog?
Wie hoch ist der PM10-Stand heute in Shihuayuan? (Feinstaub (PM10) Schwebestaub)
Der aktuelle Feinstaubgehalt PM10 in Shihuayuan is:
53 (Ungesund für sensible Gruppen)
Die höchsten PM10-Werte treten in der Regel im Monat auf: 161 (Januar 2020).
Der niedrigste Wert der Feinstaub-PM10-Belastung in Shihuayuan ist in der Regel in: August (63).
Wie ist das O3-Niveau heute in Shihuayuan? (Ozon (O3))
0 (gut)
Wie hoch ist der aktuelle PM2,5-Wert in Shihuayuan? (Feinstaub (PM2,5))
Die heutige PM2.5-Stufe ist:
7 (gut)
Zum Vergleich: Der höchste PM2,5-Wert in Shihuayuan in den letzten 7 Tagen war: 21 (Freitag, 27. Mai 2022) und der niedrigste: 21 (Freitag, 27. Mai 2022).
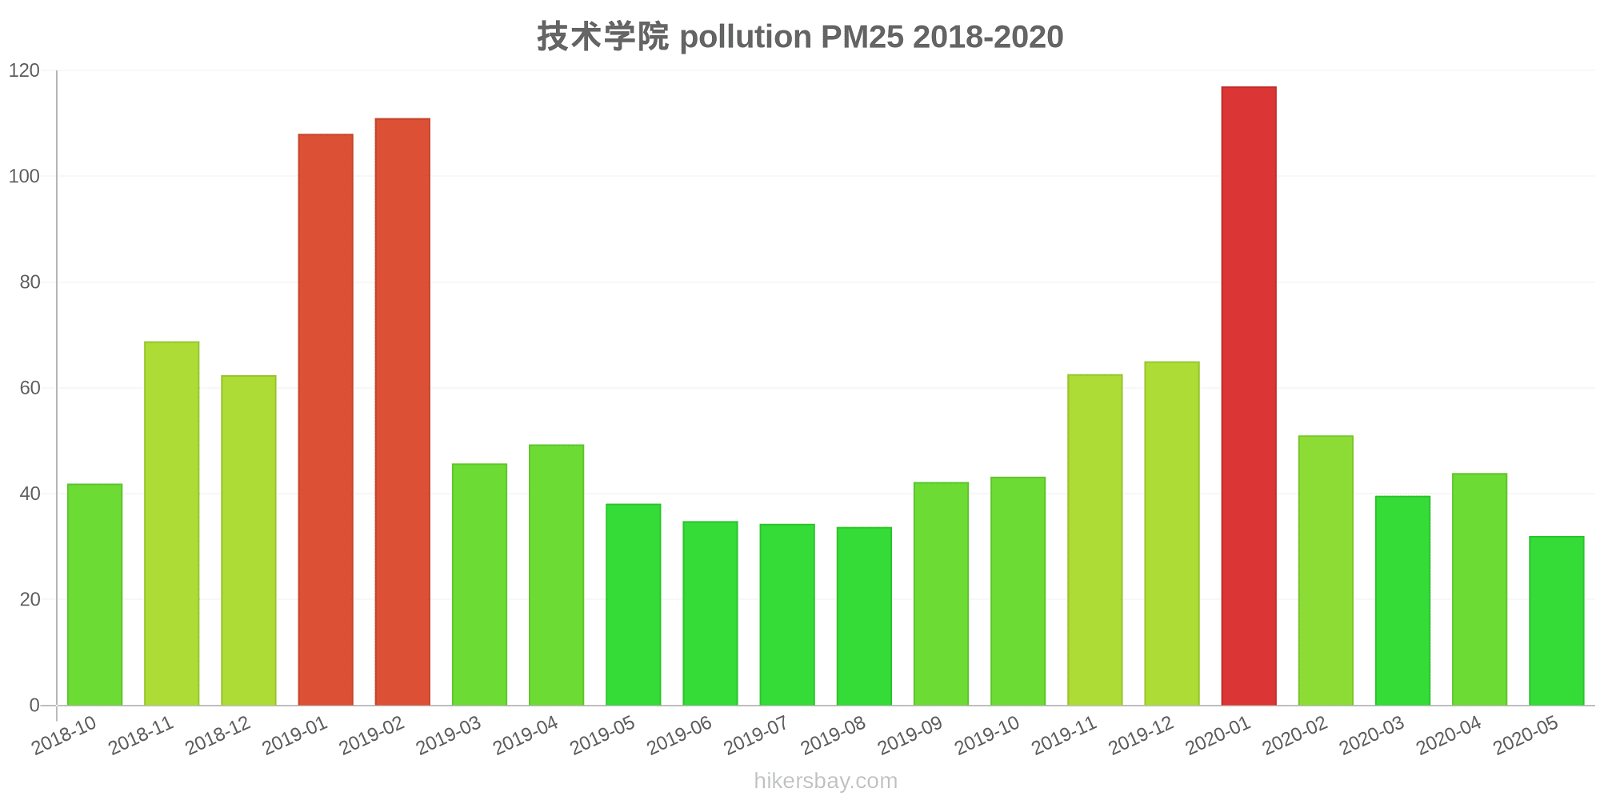
Die höchsten PM2,5-Werte wurden gemessen: 117 (Januar 2020).
Die niedrigste Feinstaubbelastung PM2,5 tritt im Monat auf: Mai (32).
Wie hoch ist die SO2-Belastung? (Schwefeldioxid (SO2))
18 (gut)
Wie hoch ist das NO2-Niveau? (Stickstoffdioxid (NO2))
3 (gut)
Wie hoch ist der CO-Gehalt? (Kohlenmonoxid (CO))
1 (gut)
Aktuelle Daten Freitag, 27. Mai 2022, 12:00
PM10 53 (Ungesund für sensible Gruppen)
O3 0 (gut)
PM2,5 7 (gut)
SO2 18 (gut)
NO2 3 (gut)
CO 1 (gut)
Daten zur Luftverschmutzung der letzten Tage in Shihuayuan
index
2022-05-27
pm10
51
Unhealthy for Sensitive Groups
o3
0
Good
pm25
21
Moderate
so2
10
Good
no2
0
Good
co
1
Good
data source »
Luftverschmutzung in Shihuayuan von Oktober 2018 bis Mai 2020

index
2020-05
2020-04
2020-03
2020-02
2020-01
2019-12
2019-11
2019-10
2019-09
2019-08
2019-07
2019-06
2019-05
2019-04
2019-03
2019-02
2019-01
2018-12
2018-11
2018-10
pm25
32 (Moderate)
44 (Unhealthy for Sensitive Groups)
40 (Unhealthy for Sensitive Groups)
51 (Unhealthy for Sensitive Groups)
117 (Very bad Hazardous)
65 (Unhealthy)
63 (Unhealthy)
43 (Unhealthy for Sensitive Groups)
42 (Unhealthy for Sensitive Groups)
34 (Moderate)
34 (Moderate)
35 (Moderate)
38 (Unhealthy for Sensitive Groups)
49 (Unhealthy for Sensitive Groups)
46 (Unhealthy for Sensitive Groups)
111 (Very bad Hazardous)
108 (Very Unhealthy)
62 (Unhealthy)
69 (Unhealthy)
42 (Unhealthy for Sensitive Groups)
co
1 (Good)
1 (Good)
942 (Good)
1 (Good)
2 (Good)
1 (Good)
1 (Good)
1 (Good)
1 (Good)
987 (Good)
967 (Good)
763 (Good)
863 (Good)
1 (Good)
1 (Good)
1 (Good)
1 (Good)
1 (Good)
1 (Good)
1 (Good)
no2
35 (Good)
42 (Moderate)
33 (Good)
23 (Good)
42 (Moderate)
42 (Moderate)
45 (Moderate)
43 (Moderate)
45 (Moderate)
27 (Good)
30 (Good)
38 (Good)
40 (Moderate)
39 (Good)
44 (Moderate)
40 (Good)
55 (Moderate)
47 (Moderate)
48 (Moderate)
53 (Moderate)
o3
155 (Unhealthy)
143 (Unhealthy for Sensitive Groups)
115 (Moderate)
104 (Moderate)
88 (Moderate)
75 (Moderate)
89 (Moderate)
113 (Moderate)
168 (Unhealthy)
179 (Unhealthy)
203 (Very Unhealthy)
208 (Very Unhealthy)
172 (Unhealthy)
149 (Unhealthy for Sensitive Groups)
127 (Unhealthy for Sensitive Groups)
109 (Moderate)
78 (Moderate)
64 (Good)
94 (Moderate)
117 (Moderate)
pm10
90 (Unhealthy)
121 (Very Unhealthy)
107 (Unhealthy)
90 (Unhealthy)
161 (Very bad Hazardous)
113 (Very Unhealthy)
127 (Very Unhealthy)
93 (Unhealthy)
78 (Unhealthy for Sensitive Groups)
63 (Unhealthy for Sensitive Groups)
70 (Unhealthy for Sensitive Groups)
79 (Unhealthy for Sensitive Groups)
110 (Very Unhealthy)
116 (Very Unhealthy)
109 (Unhealthy)
158 (Very bad Hazardous)
160 (Very bad Hazardous)
129 (Very Unhealthy)
156 (Very bad Hazardous)
96 (Unhealthy)
so2
11 (Good)
14 (Good)
14 (Good)
17 (Good)
24 (Good)
23 (Good)
19 (Good)
12 (Good)
13 (Good)
9.6 (Good)
9.2 (Good)
13 (Good)
15 (Good)
14 (Good)
21 (Good)
21 (Good)
36 (Good)
32 (Good)
23 (Good)
19 (Good)
data source »
技术学院
Freitag, 27. Mai 2022, 12:00
PM10 53 (Ungesund für sensible Gruppen)
Feinstaub (PM10) Schwebestaub
O3 0.02 (gut)
Ozon (O3)
PM2,5 6.6 (gut)
Feinstaub (PM2,5)
SO2 18 (gut)
Schwefeldioxid (SO2)
NO2 3 (gut)
Stickstoffdioxid (NO2)
CO 1.3 (gut)
Kohlenmonoxid (CO)
技术学院
index
2022-05-27
pm10
51
o3
0.02
pm25
21
so2
9.6
no2
0.38
co
0.64
技术学院
2018-10 2020-05
index
2020-05
2020-04
2020-03
2020-02
2020-01
2019-12
2019-11
2019-10
2019-09
2019-08
2019-07
2019-06
2019-05
2019-04
2019-03
2019-02
2019-01
2018-12
2018-11
2018-10
pm25
32
44
40
51
117
65
63
43
42
34
34
35
38
49
46
111
108
62
69
42
co
1
1
942
1
2
1
1
1
1
987
967
763
863
1
1
1
1
1
1
1
no2
35
42
33
23
42
42
45
43
45
27
30
38
40
39
44
40
55
47
48
53
o3
155
143
115
104
88
75
89
113
168
179
203
208
172
149
127
109
78
64
94
117
pm10
90
121
107
90
161
113
127
93
78
63
70
79
110
116
109
158
160
129
156
96
so2
11
14
14
17
24
23
19
12
13
9.6
9.2
13
15
14
21
21
36
32
23
19
* Pollution data source:
https://openaq.org
(ChinaAQIData)
The data is licensed under CC-By 4.0
PM10 53 (Ungesund für sensible Gruppen)
O3 0 (gut)
PM2,5 7 (gut)
SO2 18 (gut)
NO2 3 (gut)
CO 1 (gut)
Daten zur Luftverschmutzung der letzten Tage in Shihuayuan
| index | 2022-05-27 |
|---|---|
| pm10 | 51 Unhealthy for Sensitive Groups |
| o3 | 0 Good |
| pm25 | 21 Moderate |
| so2 | 10 Good |
| no2 | 0 Good |
| co | 1 Good |

| index | 2020-05 | 2020-04 | 2020-03 | 2020-02 | 2020-01 | 2019-12 | 2019-11 | 2019-10 | 2019-09 | 2019-08 | 2019-07 | 2019-06 | 2019-05 | 2019-04 | 2019-03 | 2019-02 | 2019-01 | 2018-12 | 2018-11 | 2018-10 |
|---|---|---|---|---|---|---|---|---|---|---|---|---|---|---|---|---|---|---|---|---|
| pm25 | 32 (Moderate) | 44 (Unhealthy for Sensitive Groups) | 40 (Unhealthy for Sensitive Groups) | 51 (Unhealthy for Sensitive Groups) | 117 (Very bad Hazardous) | 65 (Unhealthy) | 63 (Unhealthy) | 43 (Unhealthy for Sensitive Groups) | 42 (Unhealthy for Sensitive Groups) | 34 (Moderate) | 34 (Moderate) | 35 (Moderate) | 38 (Unhealthy for Sensitive Groups) | 49 (Unhealthy for Sensitive Groups) | 46 (Unhealthy for Sensitive Groups) | 111 (Very bad Hazardous) | 108 (Very Unhealthy) | 62 (Unhealthy) | 69 (Unhealthy) | 42 (Unhealthy for Sensitive Groups) |
| co | 1 (Good) | 1 (Good) | 942 (Good) | 1 (Good) | 2 (Good) | 1 (Good) | 1 (Good) | 1 (Good) | 1 (Good) | 987 (Good) | 967 (Good) | 763 (Good) | 863 (Good) | 1 (Good) | 1 (Good) | 1 (Good) | 1 (Good) | 1 (Good) | 1 (Good) | 1 (Good) |
| no2 | 35 (Good) | 42 (Moderate) | 33 (Good) | 23 (Good) | 42 (Moderate) | 42 (Moderate) | 45 (Moderate) | 43 (Moderate) | 45 (Moderate) | 27 (Good) | 30 (Good) | 38 (Good) | 40 (Moderate) | 39 (Good) | 44 (Moderate) | 40 (Good) | 55 (Moderate) | 47 (Moderate) | 48 (Moderate) | 53 (Moderate) |
| o3 | 155 (Unhealthy) | 143 (Unhealthy for Sensitive Groups) | 115 (Moderate) | 104 (Moderate) | 88 (Moderate) | 75 (Moderate) | 89 (Moderate) | 113 (Moderate) | 168 (Unhealthy) | 179 (Unhealthy) | 203 (Very Unhealthy) | 208 (Very Unhealthy) | 172 (Unhealthy) | 149 (Unhealthy for Sensitive Groups) | 127 (Unhealthy for Sensitive Groups) | 109 (Moderate) | 78 (Moderate) | 64 (Good) | 94 (Moderate) | 117 (Moderate) |
| pm10 | 90 (Unhealthy) | 121 (Very Unhealthy) | 107 (Unhealthy) | 90 (Unhealthy) | 161 (Very bad Hazardous) | 113 (Very Unhealthy) | 127 (Very Unhealthy) | 93 (Unhealthy) | 78 (Unhealthy for Sensitive Groups) | 63 (Unhealthy for Sensitive Groups) | 70 (Unhealthy for Sensitive Groups) | 79 (Unhealthy for Sensitive Groups) | 110 (Very Unhealthy) | 116 (Very Unhealthy) | 109 (Unhealthy) | 158 (Very bad Hazardous) | 160 (Very bad Hazardous) | 129 (Very Unhealthy) | 156 (Very bad Hazardous) | 96 (Unhealthy) |
| so2 | 11 (Good) | 14 (Good) | 14 (Good) | 17 (Good) | 24 (Good) | 23 (Good) | 19 (Good) | 12 (Good) | 13 (Good) | 9.6 (Good) | 9.2 (Good) | 13 (Good) | 15 (Good) | 14 (Good) | 21 (Good) | 21 (Good) | 36 (Good) | 32 (Good) | 23 (Good) | 19 (Good) |
PM10 53 (Ungesund für sensible Gruppen)
Feinstaub (PM10) SchwebestaubO3 0.02 (gut)
Ozon (O3)PM2,5 6.6 (gut)
Feinstaub (PM2,5)SO2 18 (gut)
Schwefeldioxid (SO2)NO2 3 (gut)
Stickstoffdioxid (NO2)CO 1.3 (gut)
Kohlenmonoxid (CO)技术学院
| index | 2022-05-27 |
|---|---|
| pm10 | 51 |
| o3 | 0.02 |
| pm25 | 21 |
| so2 | 9.6 |
| no2 | 0.38 |
| co | 0.64 |
技术学院

| index | 2020-05 | 2020-04 | 2020-03 | 2020-02 | 2020-01 | 2019-12 | 2019-11 | 2019-10 | 2019-09 | 2019-08 | 2019-07 | 2019-06 | 2019-05 | 2019-04 | 2019-03 | 2019-02 | 2019-01 | 2018-12 | 2018-11 | 2018-10 |
|---|---|---|---|---|---|---|---|---|---|---|---|---|---|---|---|---|---|---|---|---|
| pm25 | 32 | 44 | 40 | 51 | 117 | 65 | 63 | 43 | 42 | 34 | 34 | 35 | 38 | 49 | 46 | 111 | 108 | 62 | 69 | 42 |
| co | 1 | 1 | 942 | 1 | 2 | 1 | 1 | 1 | 1 | 987 | 967 | 763 | 863 | 1 | 1 | 1 | 1 | 1 | 1 | 1 |
| no2 | 35 | 42 | 33 | 23 | 42 | 42 | 45 | 43 | 45 | 27 | 30 | 38 | 40 | 39 | 44 | 40 | 55 | 47 | 48 | 53 |
| o3 | 155 | 143 | 115 | 104 | 88 | 75 | 89 | 113 | 168 | 179 | 203 | 208 | 172 | 149 | 127 | 109 | 78 | 64 | 94 | 117 |
| pm10 | 90 | 121 | 107 | 90 | 161 | 113 | 127 | 93 | 78 | 63 | 70 | 79 | 110 | 116 | 109 | 158 | 160 | 129 | 156 | 96 |
| so2 | 11 | 14 | 14 | 17 | 24 | 23 | 19 | 12 | 13 | 9.6 | 9.2 | 13 | 15 | 14 | 21 | 21 | 36 | 32 | 23 | 19 |