Luftverschmutzung in Xibali: Echtzeit-Luft-Qualitätsindex und Smog-Alarm.
Für die Xibali. Heute ist Donnerstag, 4. Juni 2026. Für Xibali wurden folgende Luftverschmutzungswerte gemessen:- Feinstaub (PM10) Schwebestaub - 53 (Ungesund für sensible Gruppen)
- Ozon (O3) - 0 (gut)
- Feinstaub (PM2,5) - 7 (gut)
- Schwefeldioxid (SO2) - 18 (gut)
- Stickstoffdioxid (NO2) - 3 (gut)
- Kohlenmonoxid (CO) - 1 (gut)

Wie ist die Luftqualität Xibali heute? Ist die Luft in Xibali? verschmutzt. Gibt es Smog?
Wie hoch ist der PM10-Stand heute in Xibali? (Feinstaub (PM10) Schwebestaub)
Der aktuelle Feinstaubgehalt PM10 in Xibali is:
53 (Ungesund für sensible Gruppen)
Die höchsten PM10-Werte treten in der Regel im Monat auf: 161 (Januar 2019).
Der niedrigste Wert der Feinstaub-PM10-Belastung in Xibali ist in der Regel in: August (53).
Wie ist das O3-Niveau heute in Xibali? (Ozon (O3))
0 (gut)
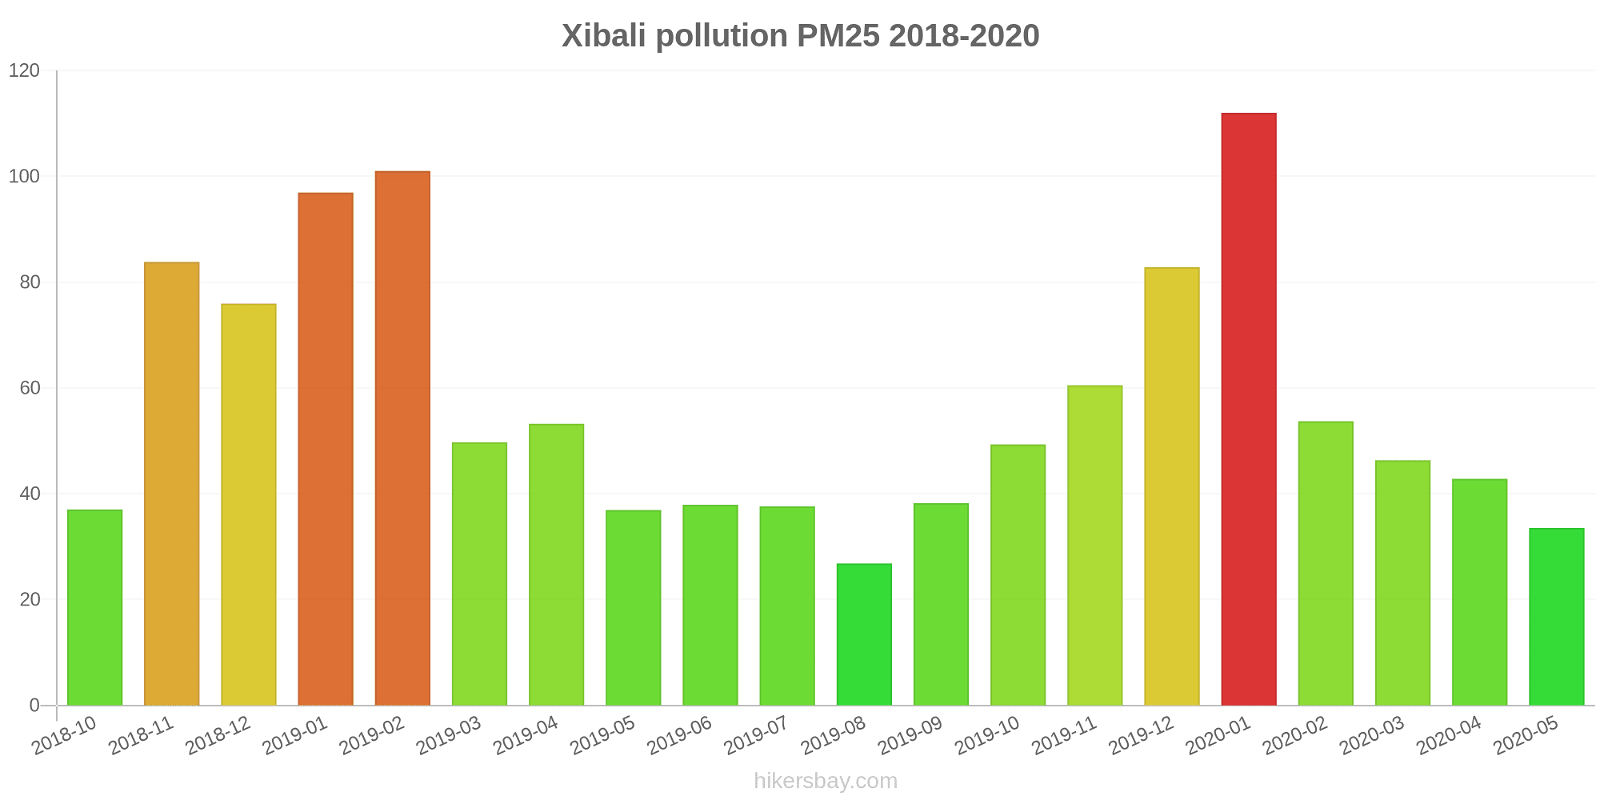
Wie hoch ist der aktuelle PM2,5-Wert in Xibali? (Feinstaub (PM2,5))
Die heutige PM2.5-Stufe ist:
7 (gut)
Zum Vergleich: Der höchste PM2,5-Wert in Xibali in den letzten 7 Tagen war: 21 (Freitag, 27. Mai 2022) und der niedrigste: 21 (Freitag, 27. Mai 2022).
Die höchsten PM2,5-Werte wurden gemessen: 112 (Januar 2020).
Die niedrigste Feinstaubbelastung PM2,5 tritt im Monat auf: August (27).
Wie hoch ist die SO2-Belastung? (Schwefeldioxid (SO2))
18 (gut)
Wie hoch ist das NO2-Niveau? (Stickstoffdioxid (NO2))
3 (gut)
Wie hoch ist der CO-Gehalt? (Kohlenmonoxid (CO))
1 (gut)
Aktuelle Daten Freitag, 27. Mai 2022, 12:00
PM10 53 (Ungesund für sensible Gruppen)
O3 0 (gut)
PM2,5 7 (gut)
SO2 18 (gut)
NO2 3 (gut)
CO 1 (gut)
Daten zur Luftverschmutzung der letzten Tage in Xibali
index
2022-05-27
pm10
51
Unhealthy for Sensitive Groups
o3
0
Good
pm25
21
Moderate
so2
10
Good
no2
0
Good
co
1
Good
data source »
Luftverschmutzung in Xibali von Oktober 2018 bis Mai 2020
index
2020-05
2020-04
2020-03
2020-02
2020-01
2019-12
2019-11
2019-10
2019-09
2019-08
2019-07
2019-06
2019-05
2019-04
2019-03
2019-02
2019-01
2018-12
2018-11
2018-10
pm25
34 (Moderate)
43 (Unhealthy for Sensitive Groups)
46 (Unhealthy for Sensitive Groups)
54 (Unhealthy for Sensitive Groups)
112 (Very bad Hazardous)
83 (Very Unhealthy)
61 (Unhealthy)
49 (Unhealthy for Sensitive Groups)
38 (Unhealthy for Sensitive Groups)
27 (Moderate)
38 (Unhealthy for Sensitive Groups)
38 (Unhealthy for Sensitive Groups)
37 (Unhealthy for Sensitive Groups)
53 (Unhealthy for Sensitive Groups)
50 (Unhealthy for Sensitive Groups)
101 (Very Unhealthy)
97 (Very Unhealthy)
76 (Very Unhealthy)
84 (Very Unhealthy)
37 (Unhealthy for Sensitive Groups)
co
430 (Good)
808 (Good)
600 (Good)
908 (Good)
1 (Good)
1 (Good)
797 (Good)
675 (Good)
554 (Good)
593 (Good)
691 (Good)
615 (Good)
554 (Good)
719 (Good)
618 (Good)
989 (Good)
1 (Good)
976 (Good)
803 (Good)
433 (Good)
no2
19 (Good)
31 (Good)
29 (Good)
21 (Good)
52 (Moderate)
54 (Moderate)
49 (Moderate)
45 (Moderate)
41 (Moderate)
30 (Good)
24 (Good)
23 (Good)
26 (Good)
49 (Moderate)
52 (Moderate)
57 (Moderate)
65 (Moderate)
64 (Moderate)
52 (Moderate)
51 (Moderate)
o3
168 (Unhealthy)
137 (Unhealthy for Sensitive Groups)
110 (Moderate)
93 (Moderate)
78 (Moderate)
60 (Good)
76 (Moderate)
115 (Moderate)
171 (Unhealthy)
139 (Unhealthy for Sensitive Groups)
198 (Very Unhealthy)
219 (Very Unhealthy)
170 (Unhealthy)
136 (Unhealthy for Sensitive Groups)
132 (Unhealthy for Sensitive Groups)
100 (Moderate)
72 (Moderate)
53 (Good)
90 (Moderate)
109 (Moderate)
pm10
63 (Unhealthy for Sensitive Groups)
89 (Unhealthy)
99 (Unhealthy)
76 (Unhealthy for Sensitive Groups)
148 (Very Unhealthy)
125 (Very Unhealthy)
133 (Very Unhealthy)
108 (Unhealthy)
78 (Unhealthy for Sensitive Groups)
53 (Unhealthy for Sensitive Groups)
66 (Unhealthy for Sensitive Groups)
89 (Unhealthy)
98 (Unhealthy)
122 (Very Unhealthy)
118 (Very Unhealthy)
147 (Very Unhealthy)
161 (Very bad Hazardous)
148 (Very Unhealthy)
159 (Very bad Hazardous)
102 (Unhealthy)
so2
8.3 (Good)
12 (Good)
13 (Good)
11 (Good)
22 (Good)
16 (Good)
12 (Good)
9.8 (Good)
11 (Good)
8.3 (Good)
9 (Good)
13 (Good)
13 (Good)
14 (Good)
14 (Good)
21 (Good)
28 (Good)
23 (Good)
12 (Good)
11 (Good)
data source »
长清党校
Freitag, 27. Mai 2022, 12:00
PM10 53 (Ungesund für sensible Gruppen)
Feinstaub (PM10) Schwebestaub
O3 0.02 (gut)
Ozon (O3)
PM2,5 6.6 (gut)
Feinstaub (PM2,5)
SO2 18 (gut)
Schwefeldioxid (SO2)
NO2 3 (gut)
Stickstoffdioxid (NO2)
CO 1.3 (gut)
Kohlenmonoxid (CO)
长清党校
index
2022-05-27
pm10
51
o3
0.02
pm25
21
so2
9.6
no2
0.38
co
0.64
长清党校
2018-10 2020-05

index
2020-05
2020-04
2020-03
2020-02
2020-01
2019-12
2019-11
2019-10
2019-09
2019-08
2019-07
2019-06
2019-05
2019-04
2019-03
2019-02
2019-01
2018-12
2018-11
2018-10
pm25
34
43
46
54
112
83
61
49
38
27
38
38
37
53
50
101
97
76
84
37
co
430
808
600
908
1
1
797
675
554
593
691
615
554
719
618
989
1
976
803
433
no2
19
31
29
21
52
54
49
45
41
30
24
23
26
49
52
57
65
64
52
51
o3
168
137
110
93
78
60
76
115
171
139
198
219
170
136
132
100
72
53
90
109
pm10
63
89
99
76
148
125
133
108
78
53
66
89
98
122
118
147
161
148
159
102
so2
8.3
12
13
11
22
16
12
9.8
11
8.3
9
13
13
14
14
21
28
23
12
11
* Pollution data source:
https://openaq.org
(ChinaAQIData)
The data is licensed under CC-By 4.0
PM10 53 (Ungesund für sensible Gruppen)
O3 0 (gut)
PM2,5 7 (gut)
SO2 18 (gut)
NO2 3 (gut)
CO 1 (gut)
Daten zur Luftverschmutzung der letzten Tage in Xibali
| index | 2022-05-27 |
|---|---|
| pm10 | 51 Unhealthy for Sensitive Groups |
| o3 | 0 Good |
| pm25 | 21 Moderate |
| so2 | 10 Good |
| no2 | 0 Good |
| co | 1 Good |

| index | 2020-05 | 2020-04 | 2020-03 | 2020-02 | 2020-01 | 2019-12 | 2019-11 | 2019-10 | 2019-09 | 2019-08 | 2019-07 | 2019-06 | 2019-05 | 2019-04 | 2019-03 | 2019-02 | 2019-01 | 2018-12 | 2018-11 | 2018-10 |
|---|---|---|---|---|---|---|---|---|---|---|---|---|---|---|---|---|---|---|---|---|
| pm25 | 34 (Moderate) | 43 (Unhealthy for Sensitive Groups) | 46 (Unhealthy for Sensitive Groups) | 54 (Unhealthy for Sensitive Groups) | 112 (Very bad Hazardous) | 83 (Very Unhealthy) | 61 (Unhealthy) | 49 (Unhealthy for Sensitive Groups) | 38 (Unhealthy for Sensitive Groups) | 27 (Moderate) | 38 (Unhealthy for Sensitive Groups) | 38 (Unhealthy for Sensitive Groups) | 37 (Unhealthy for Sensitive Groups) | 53 (Unhealthy for Sensitive Groups) | 50 (Unhealthy for Sensitive Groups) | 101 (Very Unhealthy) | 97 (Very Unhealthy) | 76 (Very Unhealthy) | 84 (Very Unhealthy) | 37 (Unhealthy for Sensitive Groups) |
| co | 430 (Good) | 808 (Good) | 600 (Good) | 908 (Good) | 1 (Good) | 1 (Good) | 797 (Good) | 675 (Good) | 554 (Good) | 593 (Good) | 691 (Good) | 615 (Good) | 554 (Good) | 719 (Good) | 618 (Good) | 989 (Good) | 1 (Good) | 976 (Good) | 803 (Good) | 433 (Good) |
| no2 | 19 (Good) | 31 (Good) | 29 (Good) | 21 (Good) | 52 (Moderate) | 54 (Moderate) | 49 (Moderate) | 45 (Moderate) | 41 (Moderate) | 30 (Good) | 24 (Good) | 23 (Good) | 26 (Good) | 49 (Moderate) | 52 (Moderate) | 57 (Moderate) | 65 (Moderate) | 64 (Moderate) | 52 (Moderate) | 51 (Moderate) |
| o3 | 168 (Unhealthy) | 137 (Unhealthy for Sensitive Groups) | 110 (Moderate) | 93 (Moderate) | 78 (Moderate) | 60 (Good) | 76 (Moderate) | 115 (Moderate) | 171 (Unhealthy) | 139 (Unhealthy for Sensitive Groups) | 198 (Very Unhealthy) | 219 (Very Unhealthy) | 170 (Unhealthy) | 136 (Unhealthy for Sensitive Groups) | 132 (Unhealthy for Sensitive Groups) | 100 (Moderate) | 72 (Moderate) | 53 (Good) | 90 (Moderate) | 109 (Moderate) |
| pm10 | 63 (Unhealthy for Sensitive Groups) | 89 (Unhealthy) | 99 (Unhealthy) | 76 (Unhealthy for Sensitive Groups) | 148 (Very Unhealthy) | 125 (Very Unhealthy) | 133 (Very Unhealthy) | 108 (Unhealthy) | 78 (Unhealthy for Sensitive Groups) | 53 (Unhealthy for Sensitive Groups) | 66 (Unhealthy for Sensitive Groups) | 89 (Unhealthy) | 98 (Unhealthy) | 122 (Very Unhealthy) | 118 (Very Unhealthy) | 147 (Very Unhealthy) | 161 (Very bad Hazardous) | 148 (Very Unhealthy) | 159 (Very bad Hazardous) | 102 (Unhealthy) |
| so2 | 8.3 (Good) | 12 (Good) | 13 (Good) | 11 (Good) | 22 (Good) | 16 (Good) | 12 (Good) | 9.8 (Good) | 11 (Good) | 8.3 (Good) | 9 (Good) | 13 (Good) | 13 (Good) | 14 (Good) | 14 (Good) | 21 (Good) | 28 (Good) | 23 (Good) | 12 (Good) | 11 (Good) |
PM10 53 (Ungesund für sensible Gruppen)
Feinstaub (PM10) SchwebestaubO3 0.02 (gut)
Ozon (O3)PM2,5 6.6 (gut)
Feinstaub (PM2,5)SO2 18 (gut)
Schwefeldioxid (SO2)NO2 3 (gut)
Stickstoffdioxid (NO2)CO 1.3 (gut)
Kohlenmonoxid (CO)长清党校
| index | 2022-05-27 |
|---|---|
| pm10 | 51 |
| o3 | 0.02 |
| pm25 | 21 |
| so2 | 9.6 |
| no2 | 0.38 |
| co | 0.64 |
长清党校

| index | 2020-05 | 2020-04 | 2020-03 | 2020-02 | 2020-01 | 2019-12 | 2019-11 | 2019-10 | 2019-09 | 2019-08 | 2019-07 | 2019-06 | 2019-05 | 2019-04 | 2019-03 | 2019-02 | 2019-01 | 2018-12 | 2018-11 | 2018-10 |
|---|---|---|---|---|---|---|---|---|---|---|---|---|---|---|---|---|---|---|---|---|
| pm25 | 34 | 43 | 46 | 54 | 112 | 83 | 61 | 49 | 38 | 27 | 38 | 38 | 37 | 53 | 50 | 101 | 97 | 76 | 84 | 37 |
| co | 430 | 808 | 600 | 908 | 1 | 1 | 797 | 675 | 554 | 593 | 691 | 615 | 554 | 719 | 618 | 989 | 1 | 976 | 803 | 433 |
| no2 | 19 | 31 | 29 | 21 | 52 | 54 | 49 | 45 | 41 | 30 | 24 | 23 | 26 | 49 | 52 | 57 | 65 | 64 | 52 | 51 |
| o3 | 168 | 137 | 110 | 93 | 78 | 60 | 76 | 115 | 171 | 139 | 198 | 219 | 170 | 136 | 132 | 100 | 72 | 53 | 90 | 109 |
| pm10 | 63 | 89 | 99 | 76 | 148 | 125 | 133 | 108 | 78 | 53 | 66 | 89 | 98 | 122 | 118 | 147 | 161 | 148 | 159 | 102 |
| so2 | 8.3 | 12 | 13 | 11 | 22 | 16 | 12 | 9.8 | 11 | 8.3 | 9 | 13 | 13 | 14 | 14 | 21 | 28 | 23 | 12 | 11 |