Luftverschmutzung in Qianweihuazhuang: Echtzeit-Luft-Qualitätsindex und Smog-Alarm.
Für die Qianweihuazhuang. Heute ist Donnerstag, 4. Juni 2026. Für Qianweihuazhuang wurden folgende Luftverschmutzungswerte gemessen:- Feinstaub (PM10) Schwebestaub - 53 (Ungesund für sensible Gruppen)
- Ozon (O3) - 0 (gut)
- Feinstaub (PM2,5) - 7 (gut)
- Schwefeldioxid (SO2) - 18 (gut)
- Stickstoffdioxid (NO2) - 3 (gut)
- Kohlenmonoxid (CO) - 1 (gut)

Wie ist die Luftqualität Qianweihuazhuang heute? Ist die Luft in Qianweihuazhuang? verschmutzt. Gibt es Smog?
Wie hoch ist der PM10-Stand heute in Qianweihuazhuang? (Feinstaub (PM10) Schwebestaub)
Der aktuelle Feinstaubgehalt PM10 in Qianweihuazhuang is:
53 (Ungesund für sensible Gruppen)
Die höchsten PM10-Werte treten in der Regel im Monat auf: 175 (Januar 2019).
Der niedrigste Wert der Feinstaub-PM10-Belastung in Qianweihuazhuang ist in der Regel in: August (60).
Wie ist das O3-Niveau heute in Qianweihuazhuang? (Ozon (O3))
0 (gut)
Wie hoch ist der aktuelle PM2,5-Wert in Qianweihuazhuang? (Feinstaub (PM2,5))
Die heutige PM2.5-Stufe ist:
7 (gut)
Zum Vergleich: Der höchste PM2,5-Wert in Qianweihuazhuang in den letzten 7 Tagen war: 21 (Freitag, 27. Mai 2022) und der niedrigste: 21 (Freitag, 27. Mai 2022).
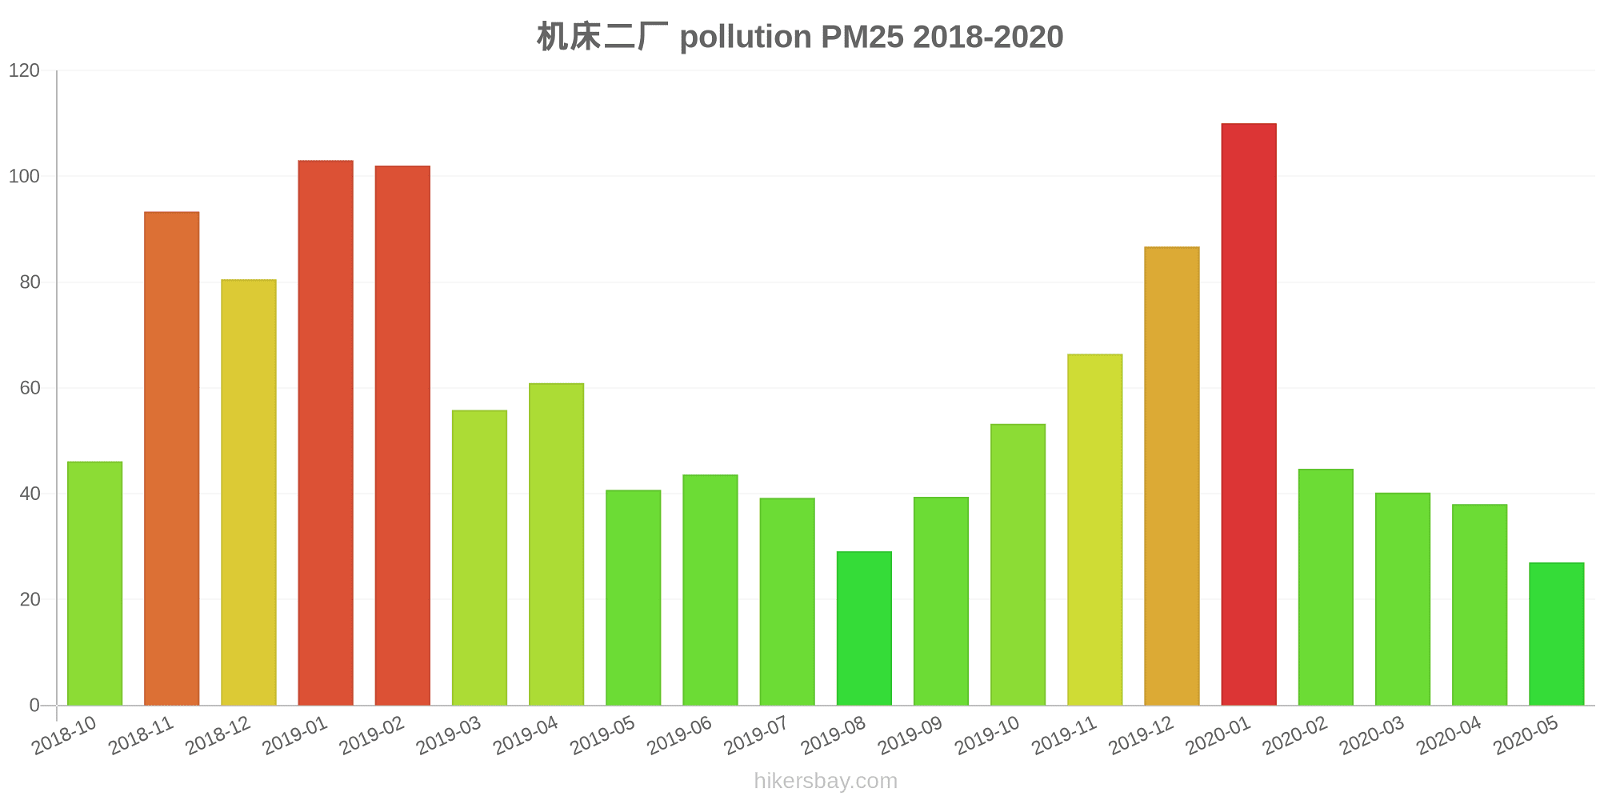
Die höchsten PM2,5-Werte wurden gemessen: 110 (Januar 2020).
Die niedrigste Feinstaubbelastung PM2,5 tritt im Monat auf: Mai (27).
Wie hoch ist die SO2-Belastung? (Schwefeldioxid (SO2))
18 (gut)
Wie hoch ist das NO2-Niveau? (Stickstoffdioxid (NO2))
3 (gut)
Wie hoch ist der CO-Gehalt? (Kohlenmonoxid (CO))
1 (gut)
Aktuelle Daten Freitag, 27. Mai 2022, 12:00
PM10 53 (Ungesund für sensible Gruppen)
O3 0 (gut)
PM2,5 7 (gut)
SO2 18 (gut)
NO2 3 (gut)
CO 1 (gut)
Daten zur Luftverschmutzung der letzten Tage in Qianweihuazhuang
index
2022-05-27
pm10
51
Unhealthy for Sensitive Groups
o3
0
Good
pm25
21
Moderate
so2
10
Good
no2
0
Good
co
1
Good
data source »
Luftverschmutzung in Qianweihuazhuang von Oktober 2018 bis Mai 2020

index
2020-05
2020-04
2020-03
2020-02
2020-01
2019-12
2019-11
2019-10
2019-09
2019-08
2019-07
2019-06
2019-05
2019-04
2019-03
2019-02
2019-01
2018-12
2018-11
2018-10
pm25
27 (Moderate)
38 (Unhealthy for Sensitive Groups)
40 (Unhealthy for Sensitive Groups)
45 (Unhealthy for Sensitive Groups)
110 (Very bad Hazardous)
87 (Very Unhealthy)
66 (Unhealthy)
53 (Unhealthy for Sensitive Groups)
39 (Unhealthy for Sensitive Groups)
29 (Moderate)
39 (Unhealthy for Sensitive Groups)
44 (Unhealthy for Sensitive Groups)
41 (Unhealthy for Sensitive Groups)
61 (Unhealthy)
56 (Unhealthy)
102 (Very Unhealthy)
103 (Very Unhealthy)
81 (Very Unhealthy)
93 (Very Unhealthy)
46 (Unhealthy for Sensitive Groups)
co
575 (Good)
661 (Good)
569 (Good)
660 (Good)
1 (Good)
1 (Good)
933 (Good)
706 (Good)
647 (Good)
528 (Good)
473 (Good)
545 (Good)
553 (Good)
785 (Good)
668 (Good)
1 (Good)
1 (Good)
1 (Good)
1 (Good)
638 (Good)
no2
27 (Good)
35 (Good)
32 (Good)
26 (Good)
61 (Moderate)
58 (Moderate)
59 (Moderate)
50 (Moderate)
47 (Moderate)
34 (Good)
28 (Good)
28 (Good)
32 (Good)
46 (Moderate)
46 (Moderate)
53 (Moderate)
66 (Moderate)
62 (Moderate)
61 (Moderate)
55 (Moderate)
o3
164 (Unhealthy)
142 (Unhealthy for Sensitive Groups)
118 (Moderate)
96 (Moderate)
71 (Moderate)
54 (Good)
79 (Moderate)
124 (Unhealthy for Sensitive Groups)
183 (Very Unhealthy)
158 (Unhealthy)
223 (Very Unhealthy)
241 (Very bad Hazardous)
179 (Unhealthy)
138 (Unhealthy for Sensitive Groups)
124 (Unhealthy for Sensitive Groups)
97 (Moderate)
60 (Good)
47 (Good)
90 (Moderate)
114 (Moderate)
pm10
77 (Unhealthy for Sensitive Groups)
104 (Unhealthy)
98 (Unhealthy)
73 (Unhealthy for Sensitive Groups)
150 (Very bad Hazardous)
134 (Very Unhealthy)
143 (Very Unhealthy)
121 (Very Unhealthy)
93 (Unhealthy)
60 (Unhealthy for Sensitive Groups)
74 (Unhealthy for Sensitive Groups)
97 (Unhealthy)
113 (Very Unhealthy)
132 (Very Unhealthy)
133 (Very Unhealthy)
155 (Very bad Hazardous)
175 (Very bad Hazardous)
166 (Very bad Hazardous)
168 (Very bad Hazardous)
122 (Very Unhealthy)
so2
8.5 (Good)
10 (Good)
13 (Good)
17 (Good)
38 (Good)
28 (Good)
16 (Good)
11 (Good)
9.3 (Good)
6.7 (Good)
6.7 (Good)
11 (Good)
9.9 (Good)
13 (Good)
14 (Good)
29 (Good)
41 (Good)
30 (Good)
16 (Good)
12 (Good)
data source »
机床二厂
Freitag, 27. Mai 2022, 12:00
PM10 53 (Ungesund für sensible Gruppen)
Feinstaub (PM10) Schwebestaub
O3 0.02 (gut)
Ozon (O3)
PM2,5 6.6 (gut)
Feinstaub (PM2,5)
SO2 18 (gut)
Schwefeldioxid (SO2)
NO2 3 (gut)
Stickstoffdioxid (NO2)
CO 1.3 (gut)
Kohlenmonoxid (CO)
机床二厂
index
2022-05-27
pm10
51
o3
0.02
pm25
21
so2
9.6
no2
0.38
co
0.64
机床二厂
2018-10 2020-05
index
2020-05
2020-04
2020-03
2020-02
2020-01
2019-12
2019-11
2019-10
2019-09
2019-08
2019-07
2019-06
2019-05
2019-04
2019-03
2019-02
2019-01
2018-12
2018-11
2018-10
pm25
27
38
40
45
110
87
66
53
39
29
39
44
41
61
56
102
103
81
93
46
co
575
661
569
660
1
1
933
706
647
528
473
545
553
785
668
1
1
1
1
638
no2
27
35
32
26
61
58
59
50
47
34
28
28
32
46
46
53
66
62
61
55
o3
164
142
118
96
71
54
79
124
183
158
223
241
179
138
124
97
60
47
90
114
pm10
77
104
98
73
150
134
143
121
93
60
74
97
113
132
133
155
175
166
168
122
so2
8.5
10
13
17
38
28
16
11
9.3
6.7
6.7
11
9.9
13
14
29
41
30
16
12
* Pollution data source:
https://openaq.org
(ChinaAQIData)
The data is licensed under CC-By 4.0
PM10 53 (Ungesund für sensible Gruppen)
O3 0 (gut)
PM2,5 7 (gut)
SO2 18 (gut)
NO2 3 (gut)
CO 1 (gut)
Daten zur Luftverschmutzung der letzten Tage in Qianweihuazhuang
| index | 2022-05-27 |
|---|---|
| pm10 | 51 Unhealthy for Sensitive Groups |
| o3 | 0 Good |
| pm25 | 21 Moderate |
| so2 | 10 Good |
| no2 | 0 Good |
| co | 1 Good |

| index | 2020-05 | 2020-04 | 2020-03 | 2020-02 | 2020-01 | 2019-12 | 2019-11 | 2019-10 | 2019-09 | 2019-08 | 2019-07 | 2019-06 | 2019-05 | 2019-04 | 2019-03 | 2019-02 | 2019-01 | 2018-12 | 2018-11 | 2018-10 |
|---|---|---|---|---|---|---|---|---|---|---|---|---|---|---|---|---|---|---|---|---|
| pm25 | 27 (Moderate) | 38 (Unhealthy for Sensitive Groups) | 40 (Unhealthy for Sensitive Groups) | 45 (Unhealthy for Sensitive Groups) | 110 (Very bad Hazardous) | 87 (Very Unhealthy) | 66 (Unhealthy) | 53 (Unhealthy for Sensitive Groups) | 39 (Unhealthy for Sensitive Groups) | 29 (Moderate) | 39 (Unhealthy for Sensitive Groups) | 44 (Unhealthy for Sensitive Groups) | 41 (Unhealthy for Sensitive Groups) | 61 (Unhealthy) | 56 (Unhealthy) | 102 (Very Unhealthy) | 103 (Very Unhealthy) | 81 (Very Unhealthy) | 93 (Very Unhealthy) | 46 (Unhealthy for Sensitive Groups) |
| co | 575 (Good) | 661 (Good) | 569 (Good) | 660 (Good) | 1 (Good) | 1 (Good) | 933 (Good) | 706 (Good) | 647 (Good) | 528 (Good) | 473 (Good) | 545 (Good) | 553 (Good) | 785 (Good) | 668 (Good) | 1 (Good) | 1 (Good) | 1 (Good) | 1 (Good) | 638 (Good) |
| no2 | 27 (Good) | 35 (Good) | 32 (Good) | 26 (Good) | 61 (Moderate) | 58 (Moderate) | 59 (Moderate) | 50 (Moderate) | 47 (Moderate) | 34 (Good) | 28 (Good) | 28 (Good) | 32 (Good) | 46 (Moderate) | 46 (Moderate) | 53 (Moderate) | 66 (Moderate) | 62 (Moderate) | 61 (Moderate) | 55 (Moderate) |
| o3 | 164 (Unhealthy) | 142 (Unhealthy for Sensitive Groups) | 118 (Moderate) | 96 (Moderate) | 71 (Moderate) | 54 (Good) | 79 (Moderate) | 124 (Unhealthy for Sensitive Groups) | 183 (Very Unhealthy) | 158 (Unhealthy) | 223 (Very Unhealthy) | 241 (Very bad Hazardous) | 179 (Unhealthy) | 138 (Unhealthy for Sensitive Groups) | 124 (Unhealthy for Sensitive Groups) | 97 (Moderate) | 60 (Good) | 47 (Good) | 90 (Moderate) | 114 (Moderate) |
| pm10 | 77 (Unhealthy for Sensitive Groups) | 104 (Unhealthy) | 98 (Unhealthy) | 73 (Unhealthy for Sensitive Groups) | 150 (Very bad Hazardous) | 134 (Very Unhealthy) | 143 (Very Unhealthy) | 121 (Very Unhealthy) | 93 (Unhealthy) | 60 (Unhealthy for Sensitive Groups) | 74 (Unhealthy for Sensitive Groups) | 97 (Unhealthy) | 113 (Very Unhealthy) | 132 (Very Unhealthy) | 133 (Very Unhealthy) | 155 (Very bad Hazardous) | 175 (Very bad Hazardous) | 166 (Very bad Hazardous) | 168 (Very bad Hazardous) | 122 (Very Unhealthy) |
| so2 | 8.5 (Good) | 10 (Good) | 13 (Good) | 17 (Good) | 38 (Good) | 28 (Good) | 16 (Good) | 11 (Good) | 9.3 (Good) | 6.7 (Good) | 6.7 (Good) | 11 (Good) | 9.9 (Good) | 13 (Good) | 14 (Good) | 29 (Good) | 41 (Good) | 30 (Good) | 16 (Good) | 12 (Good) |
PM10 53 (Ungesund für sensible Gruppen)
Feinstaub (PM10) SchwebestaubO3 0.02 (gut)
Ozon (O3)PM2,5 6.6 (gut)
Feinstaub (PM2,5)SO2 18 (gut)
Schwefeldioxid (SO2)NO2 3 (gut)
Stickstoffdioxid (NO2)CO 1.3 (gut)
Kohlenmonoxid (CO)机床二厂
| index | 2022-05-27 |
|---|---|
| pm10 | 51 |
| o3 | 0.02 |
| pm25 | 21 |
| so2 | 9.6 |
| no2 | 0.38 |
| co | 0.64 |
机床二厂

| index | 2020-05 | 2020-04 | 2020-03 | 2020-02 | 2020-01 | 2019-12 | 2019-11 | 2019-10 | 2019-09 | 2019-08 | 2019-07 | 2019-06 | 2019-05 | 2019-04 | 2019-03 | 2019-02 | 2019-01 | 2018-12 | 2018-11 | 2018-10 |
|---|---|---|---|---|---|---|---|---|---|---|---|---|---|---|---|---|---|---|---|---|
| pm25 | 27 | 38 | 40 | 45 | 110 | 87 | 66 | 53 | 39 | 29 | 39 | 44 | 41 | 61 | 56 | 102 | 103 | 81 | 93 | 46 |
| co | 575 | 661 | 569 | 660 | 1 | 1 | 933 | 706 | 647 | 528 | 473 | 545 | 553 | 785 | 668 | 1 | 1 | 1 | 1 | 638 |
| no2 | 27 | 35 | 32 | 26 | 61 | 58 | 59 | 50 | 47 | 34 | 28 | 28 | 32 | 46 | 46 | 53 | 66 | 62 | 61 | 55 |
| o3 | 164 | 142 | 118 | 96 | 71 | 54 | 79 | 124 | 183 | 158 | 223 | 241 | 179 | 138 | 124 | 97 | 60 | 47 | 90 | 114 |
| pm10 | 77 | 104 | 98 | 73 | 150 | 134 | 143 | 121 | 93 | 60 | 74 | 97 | 113 | 132 | 133 | 155 | 175 | 166 | 168 | 122 |
| so2 | 8.5 | 10 | 13 | 17 | 38 | 28 | 16 | 11 | 9.3 | 6.7 | 6.7 | 11 | 9.9 | 13 | 14 | 29 | 41 | 30 | 16 | 12 |