Luftverschmutzung in Wangtun: Echtzeit-Luft-Qualitätsindex und Smog-Alarm.
Für die Wangtun. Heute ist Donnerstag, 4. Juni 2026. Für Wangtun wurden folgende Luftverschmutzungswerte gemessen:- Feinstaub (PM10) Schwebestaub - 53 (Ungesund für sensible Gruppen)
- Ozon (O3) - 0 (gut)
- Feinstaub (PM2,5) - 7 (gut)
- Schwefeldioxid (SO2) - 18 (gut)
- Stickstoffdioxid (NO2) - 3 (gut)
- Kohlenmonoxid (CO) - 1 (gut)

Wie ist die Luftqualität Wangtun heute? Ist die Luft in Wangtun? verschmutzt. Gibt es Smog?
Wie hoch ist der PM10-Stand heute in Wangtun? (Feinstaub (PM10) Schwebestaub)
Der aktuelle Feinstaubgehalt PM10 in Wangtun is:
53 (Ungesund für sensible Gruppen)
Die höchsten PM10-Werte treten in der Regel im Monat auf: 208 (Februar 2019).
Der niedrigste Wert der Feinstaub-PM10-Belastung in Wangtun ist in der Regel in: August (51).
Wie ist das O3-Niveau heute in Wangtun? (Ozon (O3))
0 (gut)
Wie hoch ist der aktuelle PM2,5-Wert in Wangtun? (Feinstaub (PM2,5))
Die heutige PM2.5-Stufe ist:
7 (gut)
Zum Vergleich: Der höchste PM2,5-Wert in Wangtun in den letzten 7 Tagen war: 21 (Freitag, 27. Mai 2022) und der niedrigste: 21 (Freitag, 27. Mai 2022).
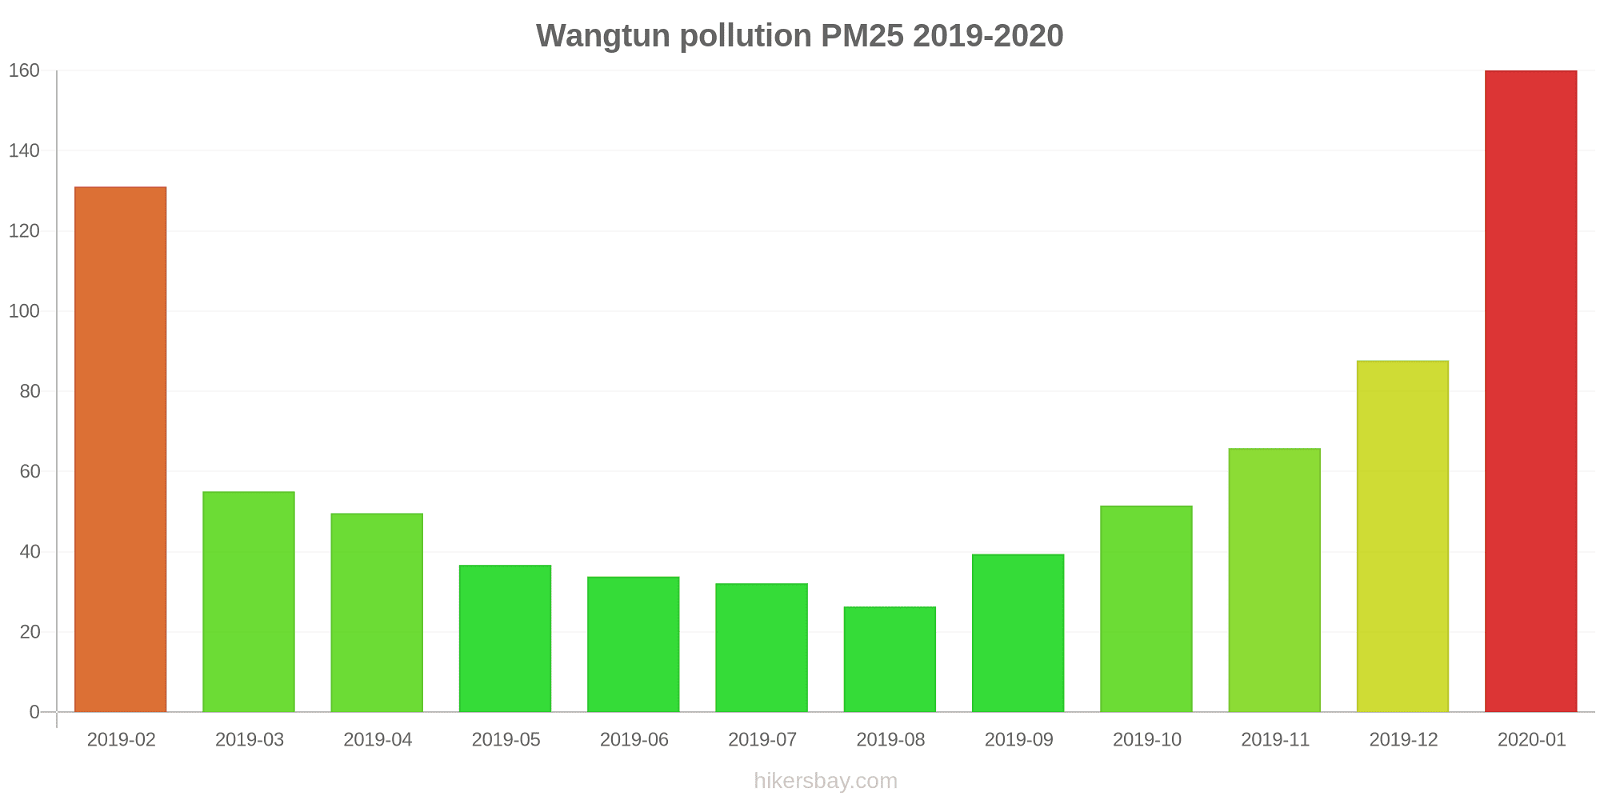
Die höchsten PM2,5-Werte wurden gemessen: 160 (Januar 2020).
Die niedrigste Feinstaubbelastung PM2,5 tritt im Monat auf: August (26).
Wie hoch ist die SO2-Belastung? (Schwefeldioxid (SO2))
18 (gut)
Wie hoch ist das NO2-Niveau? (Stickstoffdioxid (NO2))
3 (gut)
Wie hoch ist der CO-Gehalt? (Kohlenmonoxid (CO))
1 (gut)
Aktuelle Daten Freitag, 27. Mai 2022, 12:00
PM10 53 (Ungesund für sensible Gruppen)
O3 0 (gut)
PM2,5 7 (gut)
SO2 18 (gut)
NO2 3 (gut)
CO 1 (gut)
Daten zur Luftverschmutzung der letzten Tage in Wangtun
index
2022-05-27
pm10
51
Unhealthy for Sensitive Groups
o3
0
Good
pm25
21
Moderate
so2
10
Good
no2
0
Good
co
1
Good
data source »
Luftverschmutzung in Wangtun von Februar 2019 bis Januar 2020
index
2020-01
2019-12
2019-11
2019-10
2019-09
2019-08
2019-07
2019-06
2019-05
2019-04
2019-03
2019-02
pm25
160 (Very bad Hazardous)
88 (Very Unhealthy)
66 (Unhealthy)
52 (Unhealthy for Sensitive Groups)
39 (Unhealthy for Sensitive Groups)
26 (Moderate)
32 (Moderate)
34 (Moderate)
37 (Unhealthy for Sensitive Groups)
50 (Unhealthy for Sensitive Groups)
55 (Unhealthy)
131 (Very bad Hazardous)
co
2 (Good)
1 (Good)
899 (Good)
788 (Good)
719 (Good)
680 (Good)
750 (Good)
617 (Good)
545 (Good)
739 (Good)
831 (Good)
1 (Good)
no2
73 (Moderate)
52 (Moderate)
51 (Moderate)
48 (Moderate)
39 (Good)
29 (Good)
26 (Good)
29 (Good)
29 (Good)
35 (Good)
43 (Moderate)
73 (Moderate)
o3
54 (Good)
49 (Good)
82 (Moderate)
122 (Unhealthy for Sensitive Groups)
178 (Unhealthy)
146 (Unhealthy for Sensitive Groups)
199 (Very Unhealthy)
231 (Very Unhealthy)
180 (Very Unhealthy)
141 (Unhealthy for Sensitive Groups)
131 (Unhealthy for Sensitive Groups)
127 (Unhealthy for Sensitive Groups)
pm10
200 (Very bad Hazardous)
127 (Very Unhealthy)
136 (Very Unhealthy)
118 (Very Unhealthy)
85 (Unhealthy)
51 (Unhealthy for Sensitive Groups)
63 (Unhealthy for Sensitive Groups)
87 (Unhealthy)
98 (Unhealthy)
113 (Very Unhealthy)
132 (Very Unhealthy)
208 (Very bad Hazardous)
so2
14 (Good)
12 (Good)
14 (Good)
11 (Good)
11 (Good)
9 (Good)
9.4 (Good)
15 (Good)
16 (Good)
14 (Good)
17 (Good)
25 (Good)
data source »
监控中心(20190222启用)
Freitag, 27. Mai 2022, 12:00
PM10 53 (Ungesund für sensible Gruppen)
Feinstaub (PM10) Schwebestaub
O3 0.02 (gut)
Ozon (O3)
PM2,5 6.6 (gut)
Feinstaub (PM2,5)
SO2 18 (gut)
Schwefeldioxid (SO2)
NO2 3 (gut)
Stickstoffdioxid (NO2)
CO 1.3 (gut)
Kohlenmonoxid (CO)
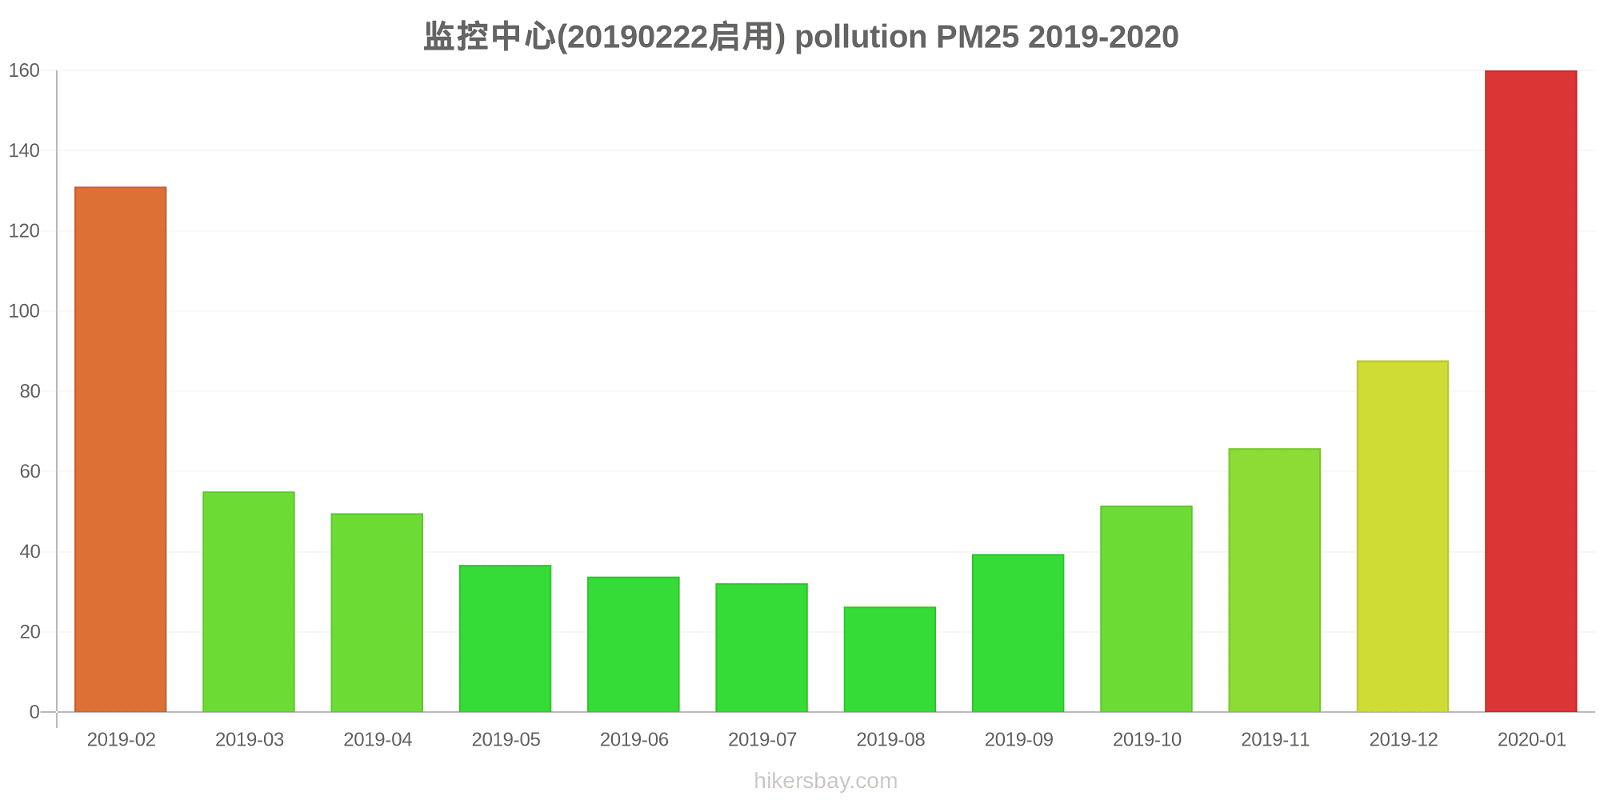
监控中心(20190222启用)
index
2022-05-27
pm10
51
o3
0.02
pm25
21
so2
9.6
no2
0.38
co
0.64
监控中心(20190222启用)
2019-02 2020-01
index
2020-01
2019-12
2019-11
2019-10
2019-09
2019-08
2019-07
2019-06
2019-05
2019-04
2019-03
2019-02
pm25
160
88
66
52
39
26
32
34
37
50
55
131
co
2
1
899
788
719
680
750
617
545
739
831
1
no2
73
52
51
48
39
29
26
29
29
35
43
73
o3
54
49
82
122
178
146
199
231
180
141
131
127
pm10
200
127
136
118
85
51
63
87
98
113
132
208
so2
14
12
14
11
11
9
9.4
15
16
14
17
25
* Pollution data source:
https://openaq.org
()
The data is licensed under CC-By 4.0
PM10 53 (Ungesund für sensible Gruppen)
O3 0 (gut)
PM2,5 7 (gut)
SO2 18 (gut)
NO2 3 (gut)
CO 1 (gut)
Daten zur Luftverschmutzung der letzten Tage in Wangtun
| index | 2022-05-27 |
|---|---|
| pm10 | 51 Unhealthy for Sensitive Groups |
| o3 | 0 Good |
| pm25 | 21 Moderate |
| so2 | 10 Good |
| no2 | 0 Good |
| co | 1 Good |

| index | 2020-01 | 2019-12 | 2019-11 | 2019-10 | 2019-09 | 2019-08 | 2019-07 | 2019-06 | 2019-05 | 2019-04 | 2019-03 | 2019-02 |
|---|---|---|---|---|---|---|---|---|---|---|---|---|
| pm25 | 160 (Very bad Hazardous) | 88 (Very Unhealthy) | 66 (Unhealthy) | 52 (Unhealthy for Sensitive Groups) | 39 (Unhealthy for Sensitive Groups) | 26 (Moderate) | 32 (Moderate) | 34 (Moderate) | 37 (Unhealthy for Sensitive Groups) | 50 (Unhealthy for Sensitive Groups) | 55 (Unhealthy) | 131 (Very bad Hazardous) |
| co | 2 (Good) | 1 (Good) | 899 (Good) | 788 (Good) | 719 (Good) | 680 (Good) | 750 (Good) | 617 (Good) | 545 (Good) | 739 (Good) | 831 (Good) | 1 (Good) |
| no2 | 73 (Moderate) | 52 (Moderate) | 51 (Moderate) | 48 (Moderate) | 39 (Good) | 29 (Good) | 26 (Good) | 29 (Good) | 29 (Good) | 35 (Good) | 43 (Moderate) | 73 (Moderate) |
| o3 | 54 (Good) | 49 (Good) | 82 (Moderate) | 122 (Unhealthy for Sensitive Groups) | 178 (Unhealthy) | 146 (Unhealthy for Sensitive Groups) | 199 (Very Unhealthy) | 231 (Very Unhealthy) | 180 (Very Unhealthy) | 141 (Unhealthy for Sensitive Groups) | 131 (Unhealthy for Sensitive Groups) | 127 (Unhealthy for Sensitive Groups) |
| pm10 | 200 (Very bad Hazardous) | 127 (Very Unhealthy) | 136 (Very Unhealthy) | 118 (Very Unhealthy) | 85 (Unhealthy) | 51 (Unhealthy for Sensitive Groups) | 63 (Unhealthy for Sensitive Groups) | 87 (Unhealthy) | 98 (Unhealthy) | 113 (Very Unhealthy) | 132 (Very Unhealthy) | 208 (Very bad Hazardous) |
| so2 | 14 (Good) | 12 (Good) | 14 (Good) | 11 (Good) | 11 (Good) | 9 (Good) | 9.4 (Good) | 15 (Good) | 16 (Good) | 14 (Good) | 17 (Good) | 25 (Good) |
PM10 53 (Ungesund für sensible Gruppen)
Feinstaub (PM10) SchwebestaubO3 0.02 (gut)
Ozon (O3)PM2,5 6.6 (gut)
Feinstaub (PM2,5)SO2 18 (gut)
Schwefeldioxid (SO2)NO2 3 (gut)
Stickstoffdioxid (NO2)CO 1.3 (gut)
Kohlenmonoxid (CO)监控中心(20190222启用)
| index | 2022-05-27 |
|---|---|
| pm10 | 51 |
| o3 | 0.02 |
| pm25 | 21 |
| so2 | 9.6 |
| no2 | 0.38 |
| co | 0.64 |
监控中心(20190222启用)

| index | 2020-01 | 2019-12 | 2019-11 | 2019-10 | 2019-09 | 2019-08 | 2019-07 | 2019-06 | 2019-05 | 2019-04 | 2019-03 | 2019-02 |
|---|---|---|---|---|---|---|---|---|---|---|---|---|
| pm25 | 160 | 88 | 66 | 52 | 39 | 26 | 32 | 34 | 37 | 50 | 55 | 131 |
| co | 2 | 1 | 899 | 788 | 719 | 680 | 750 | 617 | 545 | 739 | 831 | 1 |
| no2 | 73 | 52 | 51 | 48 | 39 | 29 | 26 | 29 | 29 | 35 | 43 | 73 |
| o3 | 54 | 49 | 82 | 122 | 178 | 146 | 199 | 231 | 180 | 141 | 131 | 127 |
| pm10 | 200 | 127 | 136 | 118 | 85 | 51 | 63 | 87 | 98 | 113 | 132 | 208 |
| so2 | 14 | 12 | 14 | 11 | 11 | 9 | 9.4 | 15 | 16 | 14 | 17 | 25 |