Luftverschmutzung in Kuangshan: Echtzeit-Luft-Qualitätsindex und Smog-Alarm.
Für die Kuangshan. Heute ist Donnerstag, 4. Juni 2026. Für Kuangshan wurden folgende Luftverschmutzungswerte gemessen:- Feinstaub (PM10) Schwebestaub - 53 (Ungesund für sensible Gruppen)
- Ozon (O3) - 0 (gut)
- Feinstaub (PM2,5) - 7 (gut)
- Schwefeldioxid (SO2) - 18 (gut)
- Stickstoffdioxid (NO2) - 3 (gut)
- Kohlenmonoxid (CO) - 1 (gut)

Wie ist die Luftqualität Kuangshan heute? Ist die Luft in Kuangshan? verschmutzt. Gibt es Smog?
Wie hoch ist der PM10-Stand heute in Kuangshan? (Feinstaub (PM10) Schwebestaub)
Der aktuelle Feinstaubgehalt PM10 in Kuangshan is:
53 (Ungesund für sensible Gruppen)
Die höchsten PM10-Werte treten in der Regel im Monat auf: 221 (Januar 2019).
Der niedrigste Wert der Feinstaub-PM10-Belastung in Kuangshan ist in der Regel in: Juli (52).
Wie ist das O3-Niveau heute in Kuangshan? (Ozon (O3))
0 (gut)
Wie hoch ist der aktuelle PM2,5-Wert in Kuangshan? (Feinstaub (PM2,5))
Die heutige PM2.5-Stufe ist:
7 (gut)
Zum Vergleich: Der höchste PM2,5-Wert in Kuangshan in den letzten 7 Tagen war: 21 (Freitag, 27. Mai 2022) und der niedrigste: 21 (Freitag, 27. Mai 2022).
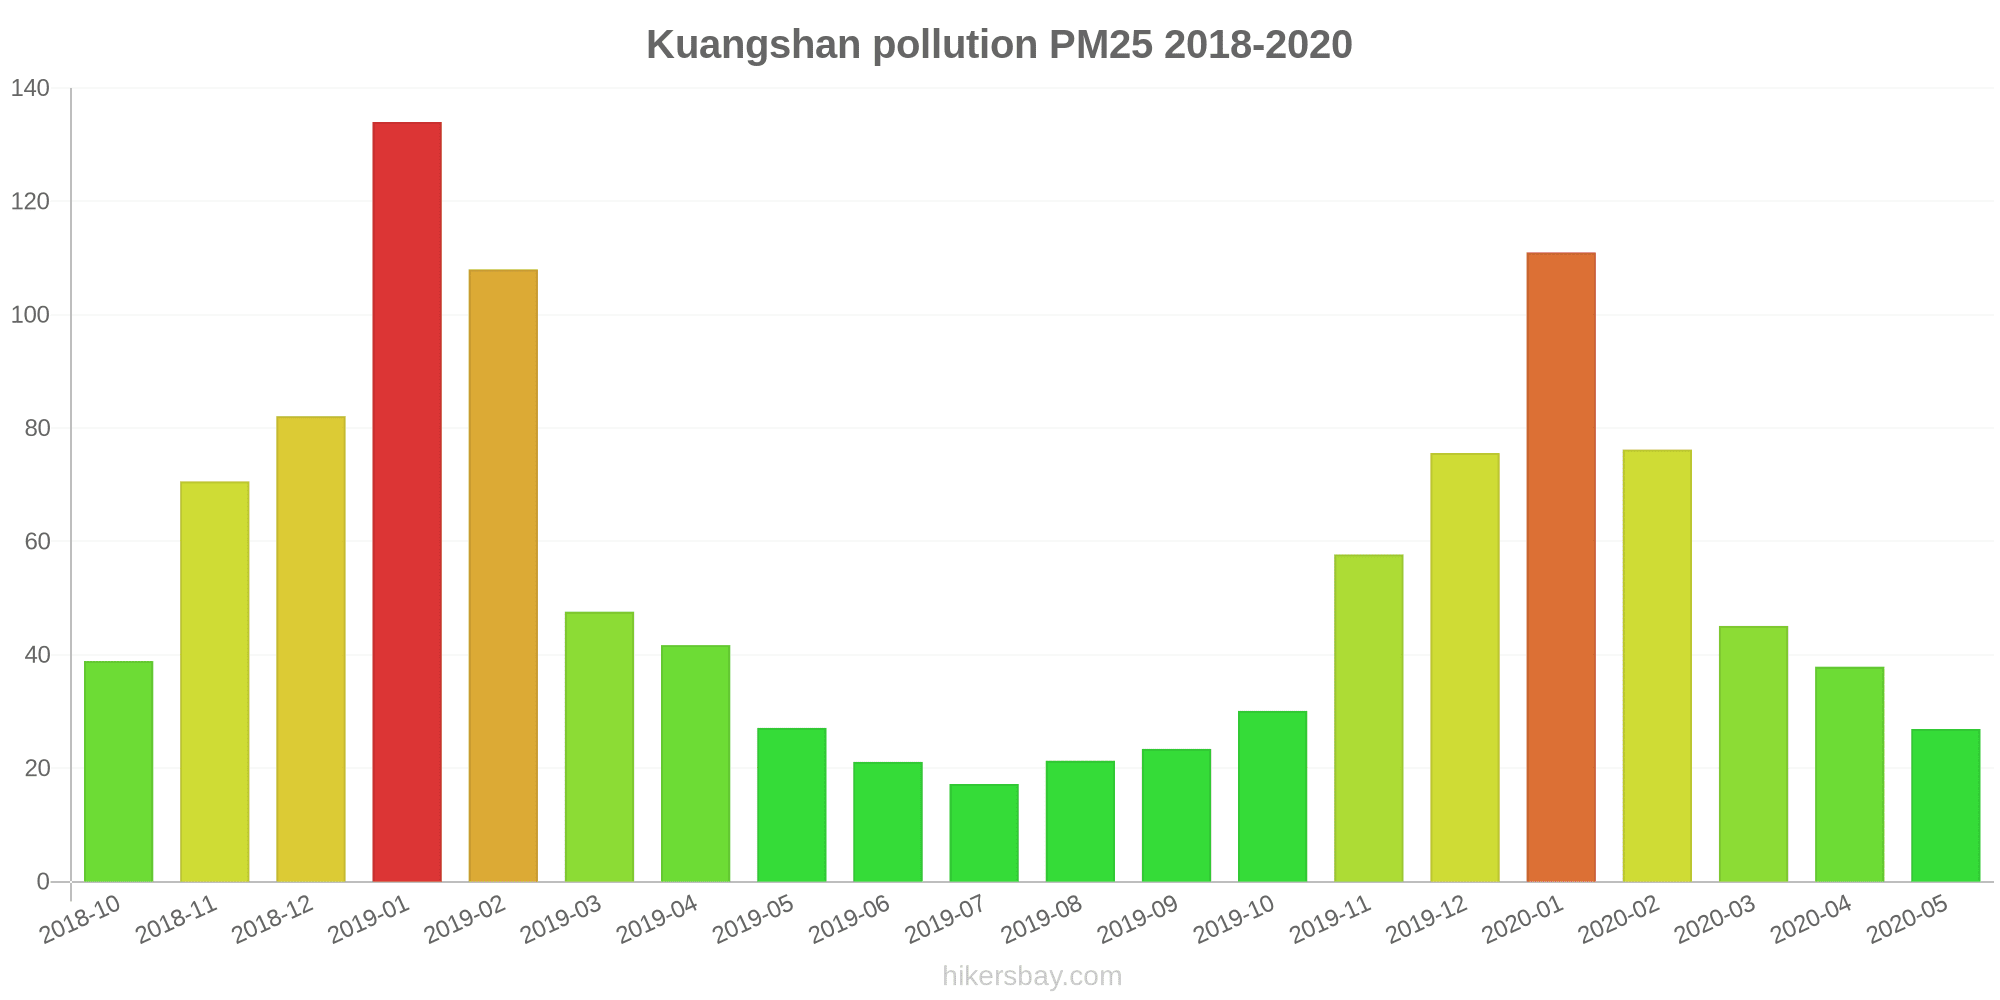
Die höchsten PM2,5-Werte wurden gemessen: 134 (Januar 2019).
Die niedrigste Feinstaubbelastung PM2,5 tritt im Monat auf: Juli (17).
Wie hoch ist die SO2-Belastung? (Schwefeldioxid (SO2))
18 (gut)
Wie hoch ist das NO2-Niveau? (Stickstoffdioxid (NO2))
3 (gut)
Wie hoch ist der CO-Gehalt? (Kohlenmonoxid (CO))
1 (gut)
Aktuelle Daten Freitag, 27. Mai 2022, 12:00
PM10 53 (Ungesund für sensible Gruppen)
O3 0 (gut)
PM2,5 7 (gut)
SO2 18 (gut)
NO2 3 (gut)
CO 1 (gut)
Daten zur Luftverschmutzung der letzten Tage in Kuangshan
index
2022-05-27
pm10
51
Unhealthy for Sensitive Groups
o3
0
Good
pm25
21
Moderate
so2
10
Good
no2
0
Good
co
1
Good
data source »
Luftverschmutzung in Kuangshan von Oktober 2018 bis Mai 2020

index
2020-05
2020-04
2020-03
2020-02
2020-01
2019-12
2019-11
2019-10
2019-09
2019-08
2019-07
2019-06
2019-05
2019-04
2019-03
2019-02
2019-01
2018-12
2018-11
2018-10
pm25
27 (Moderate)
38 (Unhealthy for Sensitive Groups)
45 (Unhealthy for Sensitive Groups)
76 (Very Unhealthy)
111 (Very bad Hazardous)
76 (Very Unhealthy)
58 (Unhealthy)
30 (Moderate)
23 (Moderate)
21 (Moderate)
17 (Moderate)
21 (Moderate)
27 (Moderate)
42 (Unhealthy for Sensitive Groups)
48 (Unhealthy for Sensitive Groups)
108 (Very Unhealthy)
134 (Very bad Hazardous)
82 (Very Unhealthy)
71 (Unhealthy)
39 (Unhealthy for Sensitive Groups)
co
340 (Good)
495 (Good)
581 (Good)
1 (Good)
1 (Good)
1 (Good)
920 (Good)
886 (Good)
684 (Good)
633 (Good)
425 (Good)
382 (Good)
344 (Good)
326 (Good)
422 (Good)
1 (Good)
1 (Good)
1 (Good)
1 (Good)
694 (Good)
no2
27 (Good)
33 (Good)
32 (Good)
20 (Good)
39 (Good)
55 (Moderate)
48 (Moderate)
35 (Good)
27 (Good)
21 (Good)
21 (Good)
24 (Good)
25 (Good)
24 (Good)
40 (Good)
35 (Good)
48 (Moderate)
50 (Moderate)
52 (Moderate)
42 (Moderate)
o3
141 (Unhealthy for Sensitive Groups)
125 (Unhealthy for Sensitive Groups)
100 (Moderate)
98 (Moderate)
62 (Good)
54 (Good)
60 (Good)
81 (Moderate)
135 (Unhealthy for Sensitive Groups)
154 (Unhealthy)
161 (Unhealthy)
161 (Unhealthy)
143 (Unhealthy for Sensitive Groups)
128 (Unhealthy for Sensitive Groups)
113 (Moderate)
89 (Moderate)
53 (Good)
49 (Good)
70 (Good)
100 (Moderate)
pm10
78 (Unhealthy for Sensitive Groups)
88 (Unhealthy)
109 (Unhealthy)
116 (Very Unhealthy)
162 (Very bad Hazardous)
154 (Very bad Hazardous)
134 (Very Unhealthy)
85 (Unhealthy)
54 (Unhealthy for Sensitive Groups)
57 (Unhealthy for Sensitive Groups)
52 (Unhealthy for Sensitive Groups)
66 (Unhealthy for Sensitive Groups)
119 (Very Unhealthy)
129 (Very Unhealthy)
134 (Very Unhealthy)
183 (Very bad Hazardous)
221 (Very bad Hazardous)
195 (Very bad Hazardous)
176 (Very bad Hazardous)
111 (Very Unhealthy)
so2
7.3 (Good)
12 (Good)
11 (Good)
13 (Good)
14 (Good)
15 (Good)
7.9 (Good)
5.3 (Good)
6.6 (Good)
6.9 (Good)
5.2 (Good)
7.6 (Good)
9.3 (Good)
7.7 (Good)
13 (Good)
14 (Good)
20 (Good)
23 (Good)
12 (Good)
9.4 (Good)
data source »
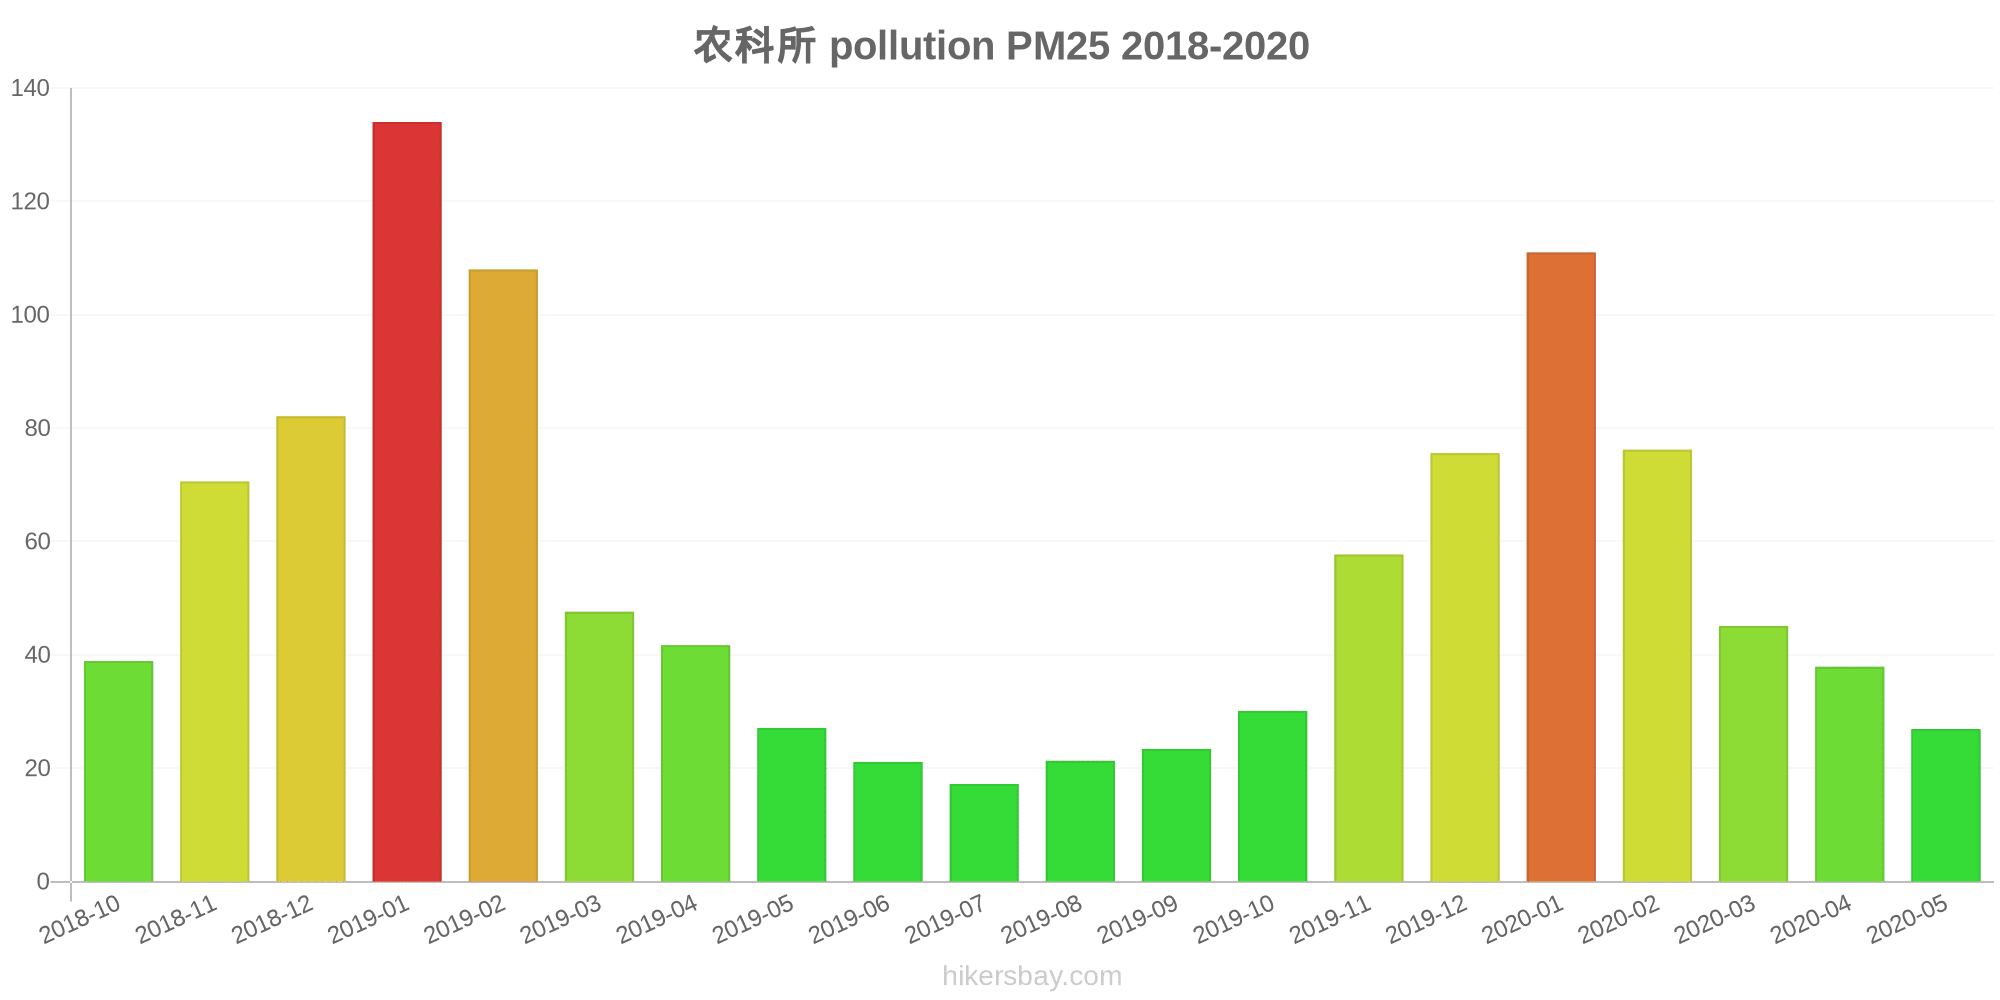
农科所
Freitag, 27. Mai 2022, 12:00
PM10 53 (Ungesund für sensible Gruppen)
Feinstaub (PM10) Schwebestaub
O3 0.02 (gut)
Ozon (O3)
PM2,5 6.6 (gut)
Feinstaub (PM2,5)
SO2 18 (gut)
Schwefeldioxid (SO2)
NO2 3 (gut)
Stickstoffdioxid (NO2)
CO 1.3 (gut)
Kohlenmonoxid (CO)
农科所
index
2022-05-27
pm10
51
o3
0.02
pm25
21
so2
9.6
no2
0.38
co
0.64
农科所
2018-10 2020-05

index
2020-05
2020-04
2020-03
2020-02
2020-01
2019-12
2019-11
2019-10
2019-09
2019-08
2019-07
2019-06
2019-05
2019-04
2019-03
2019-02
2019-01
2018-12
2018-11
2018-10
pm25
27
38
45
76
111
76
58
30
23
21
17
21
27
42
48
108
134
82
71
39
co
340
495
581
1
1
1
920
886
684
633
425
382
344
326
422
1
1
1
1
694
no2
27
33
32
20
39
55
48
35
27
21
21
24
25
24
40
35
48
50
52
42
o3
141
125
100
98
62
54
60
81
135
154
161
161
143
128
113
89
53
49
70
100
pm10
78
88
109
116
162
154
134
85
54
57
52
66
119
129
134
183
221
195
176
111
so2
7.3
12
11
13
14
15
7.9
5.3
6.6
6.9
5.2
7.6
9.3
7.7
13
14
20
23
12
9.4
* Pollution data source:
https://openaq.org
(ChinaAQIData)
The data is licensed under CC-By 4.0
PM10 53 (Ungesund für sensible Gruppen)
O3 0 (gut)
PM2,5 7 (gut)
SO2 18 (gut)
NO2 3 (gut)
CO 1 (gut)
Daten zur Luftverschmutzung der letzten Tage in Kuangshan
| index | 2022-05-27 |
|---|---|
| pm10 | 51 Unhealthy for Sensitive Groups |
| o3 | 0 Good |
| pm25 | 21 Moderate |
| so2 | 10 Good |
| no2 | 0 Good |
| co | 1 Good |
| index | 2020-05 | 2020-04 | 2020-03 | 2020-02 | 2020-01 | 2019-12 | 2019-11 | 2019-10 | 2019-09 | 2019-08 | 2019-07 | 2019-06 | 2019-05 | 2019-04 | 2019-03 | 2019-02 | 2019-01 | 2018-12 | 2018-11 | 2018-10 |
|---|---|---|---|---|---|---|---|---|---|---|---|---|---|---|---|---|---|---|---|---|
| pm25 | 27 (Moderate) | 38 (Unhealthy for Sensitive Groups) | 45 (Unhealthy for Sensitive Groups) | 76 (Very Unhealthy) | 111 (Very bad Hazardous) | 76 (Very Unhealthy) | 58 (Unhealthy) | 30 (Moderate) | 23 (Moderate) | 21 (Moderate) | 17 (Moderate) | 21 (Moderate) | 27 (Moderate) | 42 (Unhealthy for Sensitive Groups) | 48 (Unhealthy for Sensitive Groups) | 108 (Very Unhealthy) | 134 (Very bad Hazardous) | 82 (Very Unhealthy) | 71 (Unhealthy) | 39 (Unhealthy for Sensitive Groups) |
| co | 340 (Good) | 495 (Good) | 581 (Good) | 1 (Good) | 1 (Good) | 1 (Good) | 920 (Good) | 886 (Good) | 684 (Good) | 633 (Good) | 425 (Good) | 382 (Good) | 344 (Good) | 326 (Good) | 422 (Good) | 1 (Good) | 1 (Good) | 1 (Good) | 1 (Good) | 694 (Good) |
| no2 | 27 (Good) | 33 (Good) | 32 (Good) | 20 (Good) | 39 (Good) | 55 (Moderate) | 48 (Moderate) | 35 (Good) | 27 (Good) | 21 (Good) | 21 (Good) | 24 (Good) | 25 (Good) | 24 (Good) | 40 (Good) | 35 (Good) | 48 (Moderate) | 50 (Moderate) | 52 (Moderate) | 42 (Moderate) |
| o3 | 141 (Unhealthy for Sensitive Groups) | 125 (Unhealthy for Sensitive Groups) | 100 (Moderate) | 98 (Moderate) | 62 (Good) | 54 (Good) | 60 (Good) | 81 (Moderate) | 135 (Unhealthy for Sensitive Groups) | 154 (Unhealthy) | 161 (Unhealthy) | 161 (Unhealthy) | 143 (Unhealthy for Sensitive Groups) | 128 (Unhealthy for Sensitive Groups) | 113 (Moderate) | 89 (Moderate) | 53 (Good) | 49 (Good) | 70 (Good) | 100 (Moderate) |
| pm10 | 78 (Unhealthy for Sensitive Groups) | 88 (Unhealthy) | 109 (Unhealthy) | 116 (Very Unhealthy) | 162 (Very bad Hazardous) | 154 (Very bad Hazardous) | 134 (Very Unhealthy) | 85 (Unhealthy) | 54 (Unhealthy for Sensitive Groups) | 57 (Unhealthy for Sensitive Groups) | 52 (Unhealthy for Sensitive Groups) | 66 (Unhealthy for Sensitive Groups) | 119 (Very Unhealthy) | 129 (Very Unhealthy) | 134 (Very Unhealthy) | 183 (Very bad Hazardous) | 221 (Very bad Hazardous) | 195 (Very bad Hazardous) | 176 (Very bad Hazardous) | 111 (Very Unhealthy) |
| so2 | 7.3 (Good) | 12 (Good) | 11 (Good) | 13 (Good) | 14 (Good) | 15 (Good) | 7.9 (Good) | 5.3 (Good) | 6.6 (Good) | 6.9 (Good) | 5.2 (Good) | 7.6 (Good) | 9.3 (Good) | 7.7 (Good) | 13 (Good) | 14 (Good) | 20 (Good) | 23 (Good) | 12 (Good) | 9.4 (Good) |
PM10 53 (Ungesund für sensible Gruppen)
Feinstaub (PM10) SchwebestaubO3 0.02 (gut)
Ozon (O3)PM2,5 6.6 (gut)
Feinstaub (PM2,5)SO2 18 (gut)
Schwefeldioxid (SO2)NO2 3 (gut)
Stickstoffdioxid (NO2)CO 1.3 (gut)
Kohlenmonoxid (CO)农科所
| index | 2022-05-27 |
|---|---|
| pm10 | 51 |
| o3 | 0.02 |
| pm25 | 21 |
| so2 | 9.6 |
| no2 | 0.38 |
| co | 0.64 |
农科所
| index | 2020-05 | 2020-04 | 2020-03 | 2020-02 | 2020-01 | 2019-12 | 2019-11 | 2019-10 | 2019-09 | 2019-08 | 2019-07 | 2019-06 | 2019-05 | 2019-04 | 2019-03 | 2019-02 | 2019-01 | 2018-12 | 2018-11 | 2018-10 |
|---|---|---|---|---|---|---|---|---|---|---|---|---|---|---|---|---|---|---|---|---|
| pm25 | 27 | 38 | 45 | 76 | 111 | 76 | 58 | 30 | 23 | 21 | 17 | 21 | 27 | 42 | 48 | 108 | 134 | 82 | 71 | 39 |
| co | 340 | 495 | 581 | 1 | 1 | 1 | 920 | 886 | 684 | 633 | 425 | 382 | 344 | 326 | 422 | 1 | 1 | 1 | 1 | 694 |
| no2 | 27 | 33 | 32 | 20 | 39 | 55 | 48 | 35 | 27 | 21 | 21 | 24 | 25 | 24 | 40 | 35 | 48 | 50 | 52 | 42 |
| o3 | 141 | 125 | 100 | 98 | 62 | 54 | 60 | 81 | 135 | 154 | 161 | 161 | 143 | 128 | 113 | 89 | 53 | 49 | 70 | 100 |
| pm10 | 78 | 88 | 109 | 116 | 162 | 154 | 134 | 85 | 54 | 57 | 52 | 66 | 119 | 129 | 134 | 183 | 221 | 195 | 176 | 111 |
| so2 | 7.3 | 12 | 11 | 13 | 14 | 15 | 7.9 | 5.3 | 6.6 | 6.9 | 5.2 | 7.6 | 9.3 | 7.7 | 13 | 14 | 20 | 23 | 12 | 9.4 |