Luftverschmutzung in Tucheng: Echtzeit-Luft-Qualitätsindex und Smog-Alarm.
Für die Tucheng. Heute ist Donnerstag, 4. Juni 2026. Für Tucheng wurden folgende Luftverschmutzungswerte gemessen:- Feinstaub (PM10) Schwebestaub - 53 (Ungesund für sensible Gruppen)
- Ozon (O3) - 0 (gut)
- Feinstaub (PM2,5) - 7 (gut)
- Schwefeldioxid (SO2) - 18 (gut)
- Stickstoffdioxid (NO2) - 3 (gut)
- Kohlenmonoxid (CO) - 1 (gut)

Wie ist die Luftqualität Tucheng heute? Ist die Luft in Tucheng? verschmutzt. Gibt es Smog?
Wie hoch ist der PM10-Stand heute in Tucheng? (Feinstaub (PM10) Schwebestaub)
Der aktuelle Feinstaubgehalt PM10 in Tucheng is:
53 (Ungesund für sensible Gruppen)
Die höchsten PM10-Werte treten in der Regel im Monat auf: 173 (Januar 2019).
Der niedrigste Wert der Feinstaub-PM10-Belastung in Tucheng ist in der Regel in: August (48).
Wie ist das O3-Niveau heute in Tucheng? (Ozon (O3))
0 (gut)
Wie hoch ist der aktuelle PM2,5-Wert in Tucheng? (Feinstaub (PM2,5))
Die heutige PM2.5-Stufe ist:
7 (gut)
Zum Vergleich: Der höchste PM2,5-Wert in Tucheng in den letzten 7 Tagen war: 21 (Freitag, 27. Mai 2022) und der niedrigste: 21 (Freitag, 27. Mai 2022).
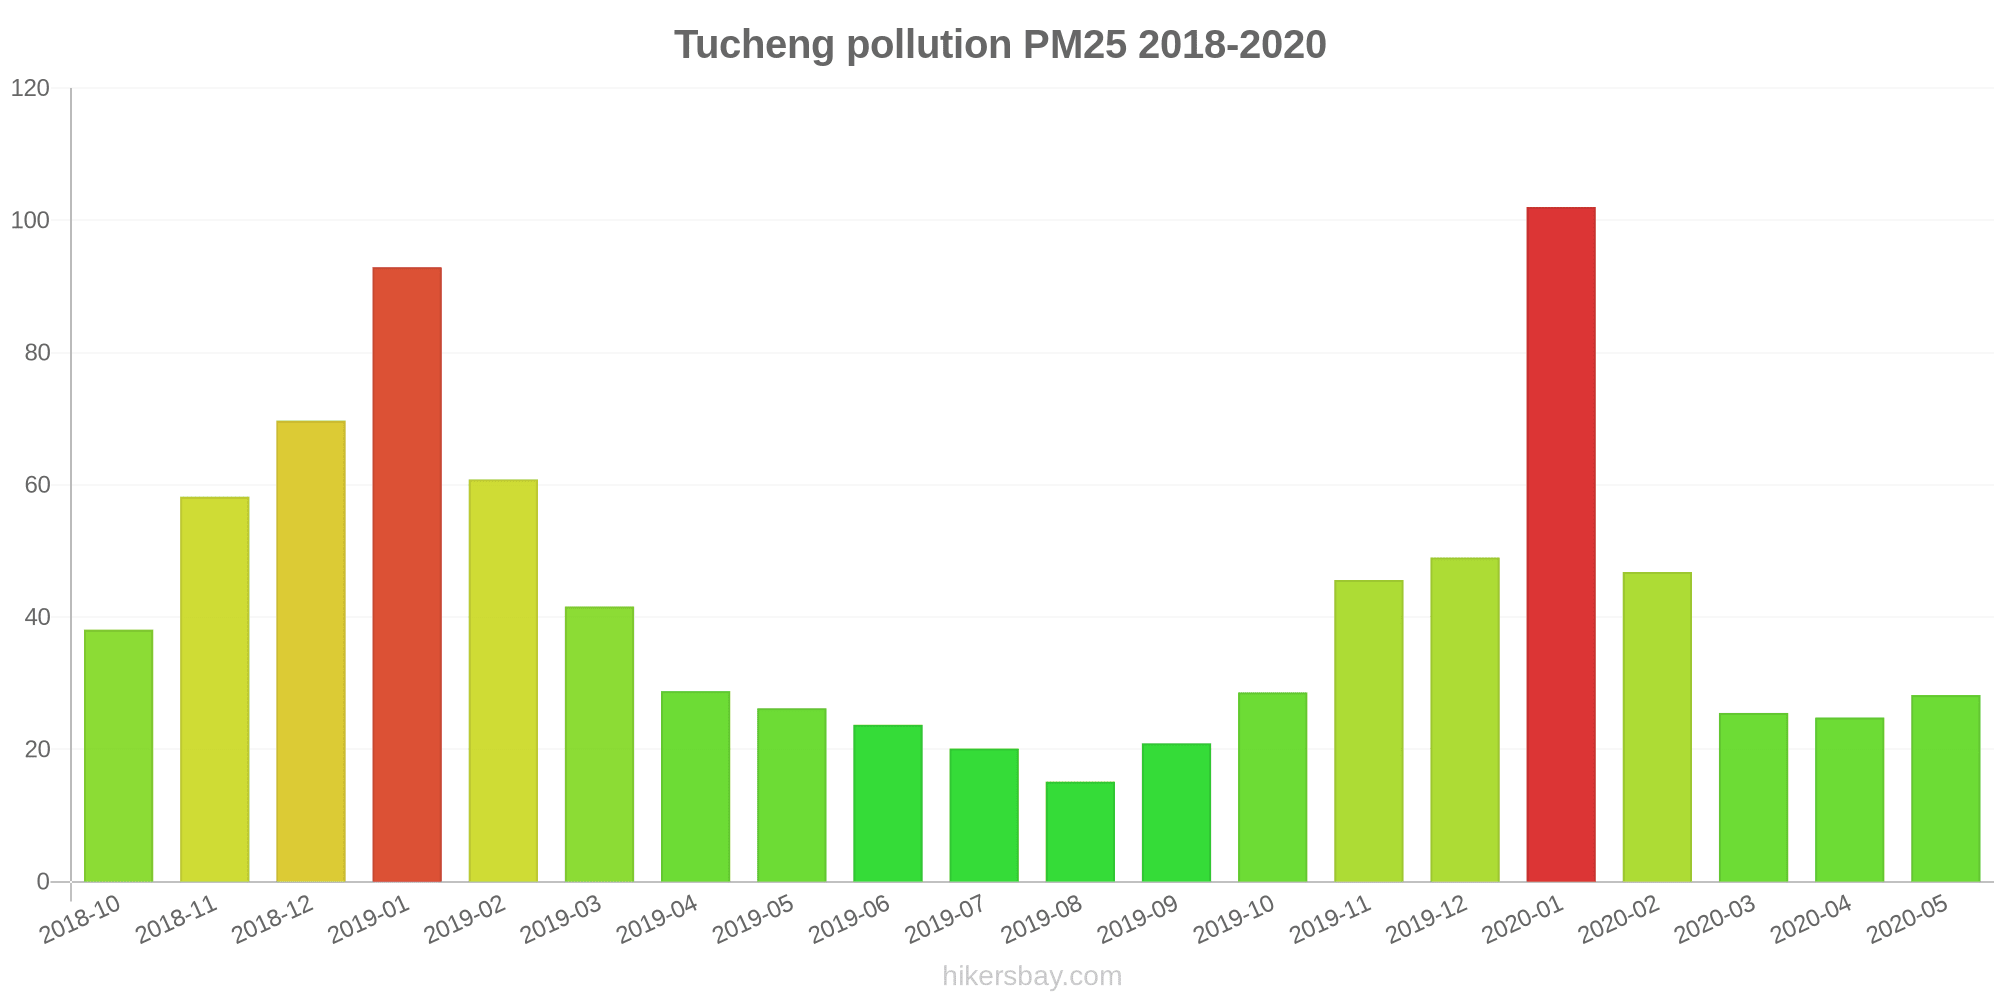
Die höchsten PM2,5-Werte wurden gemessen: 102 (Januar 2020).
Die niedrigste Feinstaubbelastung PM2,5 tritt im Monat auf: August (15).
Wie hoch ist die SO2-Belastung? (Schwefeldioxid (SO2))
18 (gut)
Wie hoch ist das NO2-Niveau? (Stickstoffdioxid (NO2))
3 (gut)
Wie hoch ist der CO-Gehalt? (Kohlenmonoxid (CO))
1 (gut)
Aktuelle Daten Freitag, 27. Mai 2022, 12:00
PM10 53 (Ungesund für sensible Gruppen)
O3 0 (gut)
PM2,5 7 (gut)
SO2 18 (gut)
NO2 3 (gut)
CO 1 (gut)
Daten zur Luftverschmutzung der letzten Tage in Tucheng
index
2022-05-27
pm10
51
Unhealthy for Sensitive Groups
o3
0
Good
pm25
21
Moderate
so2
10
Good
no2
0
Good
co
1
Good
data source »
Luftverschmutzung in Tucheng von Oktober 2018 bis Mai 2020

index
2020-05
2020-04
2020-03
2020-02
2020-01
2019-12
2019-11
2019-10
2019-09
2019-08
2019-07
2019-06
2019-05
2019-04
2019-03
2019-02
2019-01
2018-12
2018-11
2018-10
pm25
28 (Moderate)
25 (Moderate)
26 (Moderate)
47 (Unhealthy for Sensitive Groups)
102 (Very Unhealthy)
49 (Unhealthy for Sensitive Groups)
46 (Unhealthy for Sensitive Groups)
29 (Moderate)
21 (Moderate)
15 (Moderate)
20 (Moderate)
24 (Moderate)
26 (Moderate)
29 (Moderate)
42 (Unhealthy for Sensitive Groups)
61 (Unhealthy)
93 (Very Unhealthy)
70 (Unhealthy)
58 (Unhealthy)
38 (Unhealthy for Sensitive Groups)
co
627 (Good)
626 (Good)
623 (Good)
854 (Good)
1 (Good)
1 (Good)
972 (Good)
842 (Good)
841 (Good)
846 (Good)
936 (Good)
732 (Good)
556 (Good)
724 (Good)
871 (Good)
977 (Good)
1 (Good)
1 (Good)
1 (Good)
825 (Good)
no2
20 (Good)
27 (Good)
23 (Good)
26 (Good)
51 (Moderate)
39 (Good)
40 (Good)
32 (Good)
29 (Good)
25 (Good)
25 (Good)
23 (Good)
22 (Good)
28 (Good)
33 (Good)
34 (Good)
46 (Moderate)
36 (Good)
43 (Moderate)
36 (Good)
o3
141 (Unhealthy for Sensitive Groups)
124 (Unhealthy for Sensitive Groups)
100 (Moderate)
92 (Moderate)
65 (Good)
66 (Good)
73 (Moderate)
96 (Moderate)
136 (Unhealthy for Sensitive Groups)
137 (Unhealthy for Sensitive Groups)
159 (Unhealthy)
173 (Unhealthy)
146 (Unhealthy for Sensitive Groups)
125 (Unhealthy for Sensitive Groups)
109 (Moderate)
101 (Moderate)
59 (Good)
53 (Good)
83 (Moderate)
92 (Moderate)
pm10
131 (Very Unhealthy)
81 (Unhealthy)
75 (Unhealthy for Sensitive Groups)
94 (Unhealthy)
159 (Very bad Hazardous)
99 (Unhealthy)
116 (Very Unhealthy)
82 (Unhealthy)
62 (Unhealthy for Sensitive Groups)
48 (Moderate)
56 (Unhealthy for Sensitive Groups)
61 (Unhealthy for Sensitive Groups)
87 (Unhealthy)
93 (Unhealthy)
100 (Unhealthy)
121 (Very Unhealthy)
173 (Very bad Hazardous)
148 (Very Unhealthy)
133 (Very Unhealthy)
84 (Unhealthy)
so2
15 (Good)
19 (Good)
19 (Good)
36 (Good)
80 (Moderate)
43 (Good)
32 (Good)
20 (Good)
16 (Good)
13 (Good)
17 (Good)
13 (Good)
13 (Good)
19 (Good)
36 (Good)
51 (Moderate)
99 (Moderate)
68 (Moderate)
49 (Good)
26 (Good)
data source »
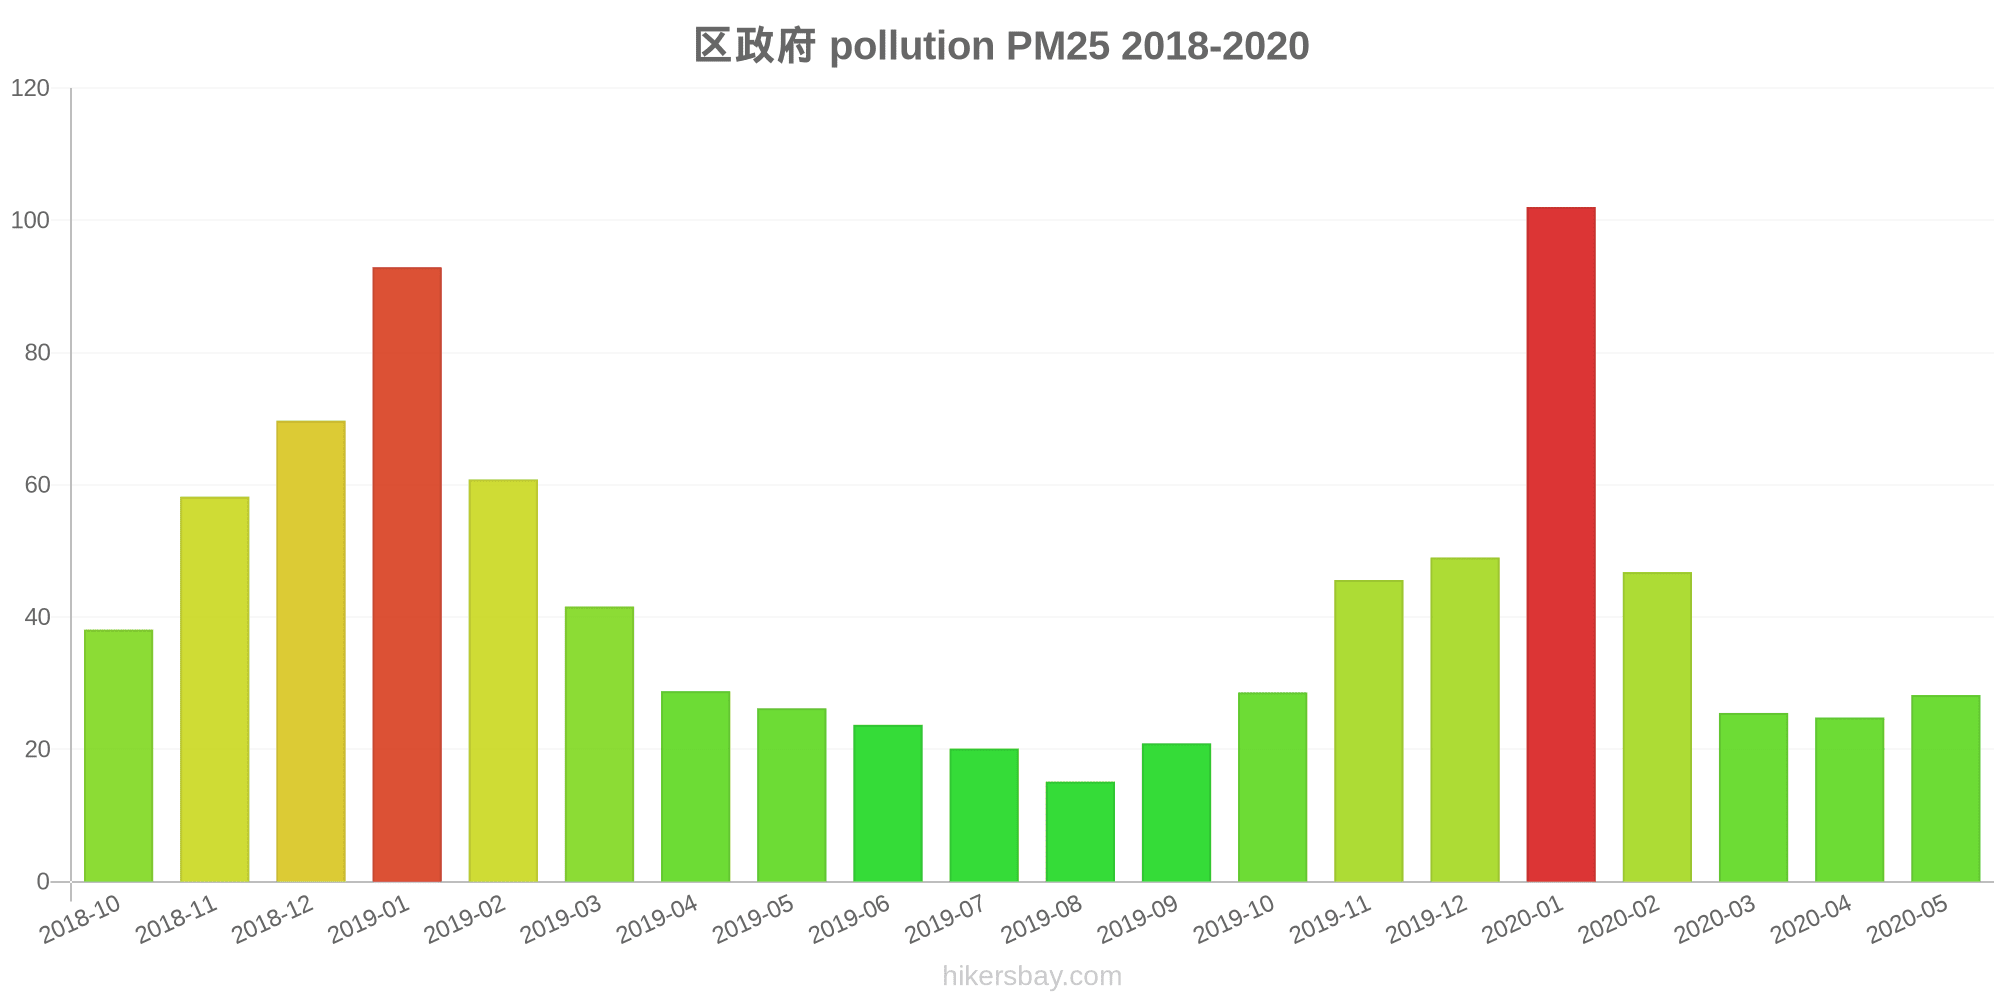
区政府
Freitag, 27. Mai 2022, 12:00
PM10 53 (Ungesund für sensible Gruppen)
Feinstaub (PM10) Schwebestaub
O3 0.02 (gut)
Ozon (O3)
PM2,5 6.6 (gut)
Feinstaub (PM2,5)
SO2 18 (gut)
Schwefeldioxid (SO2)
NO2 3 (gut)
Stickstoffdioxid (NO2)
CO 1.3 (gut)
Kohlenmonoxid (CO)
区政府
index
2022-05-27
pm10
51
o3
0.02
pm25
21
so2
9.6
no2
0.38
co
0.64
区政府
2018-10 2020-05

index
2020-05
2020-04
2020-03
2020-02
2020-01
2019-12
2019-11
2019-10
2019-09
2019-08
2019-07
2019-06
2019-05
2019-04
2019-03
2019-02
2019-01
2018-12
2018-11
2018-10
pm25
28
25
26
47
102
49
46
29
21
15
20
24
26
29
42
61
93
70
58
38
co
627
626
623
854
1
1
972
842
841
846
936
732
556
724
871
977
1
1
1
825
no2
20
27
23
26
51
39
40
32
29
25
25
23
22
28
33
34
46
36
43
36
o3
141
124
100
92
65
66
73
96
136
137
159
173
146
125
109
101
59
53
83
92
pm10
131
81
75
94
159
99
116
82
62
48
56
61
87
93
100
121
173
148
133
84
so2
15
19
19
36
80
43
32
20
16
13
17
13
13
19
36
51
99
68
49
26
* Pollution data source:
https://openaq.org
(ChinaAQIData)
The data is licensed under CC-By 4.0
PM10 53 (Ungesund für sensible Gruppen)
O3 0 (gut)
PM2,5 7 (gut)
SO2 18 (gut)
NO2 3 (gut)
CO 1 (gut)
Daten zur Luftverschmutzung der letzten Tage in Tucheng
| index | 2022-05-27 |
|---|---|
| pm10 | 51 Unhealthy for Sensitive Groups |
| o3 | 0 Good |
| pm25 | 21 Moderate |
| so2 | 10 Good |
| no2 | 0 Good |
| co | 1 Good |
| index | 2020-05 | 2020-04 | 2020-03 | 2020-02 | 2020-01 | 2019-12 | 2019-11 | 2019-10 | 2019-09 | 2019-08 | 2019-07 | 2019-06 | 2019-05 | 2019-04 | 2019-03 | 2019-02 | 2019-01 | 2018-12 | 2018-11 | 2018-10 |
|---|---|---|---|---|---|---|---|---|---|---|---|---|---|---|---|---|---|---|---|---|
| pm25 | 28 (Moderate) | 25 (Moderate) | 26 (Moderate) | 47 (Unhealthy for Sensitive Groups) | 102 (Very Unhealthy) | 49 (Unhealthy for Sensitive Groups) | 46 (Unhealthy for Sensitive Groups) | 29 (Moderate) | 21 (Moderate) | 15 (Moderate) | 20 (Moderate) | 24 (Moderate) | 26 (Moderate) | 29 (Moderate) | 42 (Unhealthy for Sensitive Groups) | 61 (Unhealthy) | 93 (Very Unhealthy) | 70 (Unhealthy) | 58 (Unhealthy) | 38 (Unhealthy for Sensitive Groups) |
| co | 627 (Good) | 626 (Good) | 623 (Good) | 854 (Good) | 1 (Good) | 1 (Good) | 972 (Good) | 842 (Good) | 841 (Good) | 846 (Good) | 936 (Good) | 732 (Good) | 556 (Good) | 724 (Good) | 871 (Good) | 977 (Good) | 1 (Good) | 1 (Good) | 1 (Good) | 825 (Good) |
| no2 | 20 (Good) | 27 (Good) | 23 (Good) | 26 (Good) | 51 (Moderate) | 39 (Good) | 40 (Good) | 32 (Good) | 29 (Good) | 25 (Good) | 25 (Good) | 23 (Good) | 22 (Good) | 28 (Good) | 33 (Good) | 34 (Good) | 46 (Moderate) | 36 (Good) | 43 (Moderate) | 36 (Good) |
| o3 | 141 (Unhealthy for Sensitive Groups) | 124 (Unhealthy for Sensitive Groups) | 100 (Moderate) | 92 (Moderate) | 65 (Good) | 66 (Good) | 73 (Moderate) | 96 (Moderate) | 136 (Unhealthy for Sensitive Groups) | 137 (Unhealthy for Sensitive Groups) | 159 (Unhealthy) | 173 (Unhealthy) | 146 (Unhealthy for Sensitive Groups) | 125 (Unhealthy for Sensitive Groups) | 109 (Moderate) | 101 (Moderate) | 59 (Good) | 53 (Good) | 83 (Moderate) | 92 (Moderate) |
| pm10 | 131 (Very Unhealthy) | 81 (Unhealthy) | 75 (Unhealthy for Sensitive Groups) | 94 (Unhealthy) | 159 (Very bad Hazardous) | 99 (Unhealthy) | 116 (Very Unhealthy) | 82 (Unhealthy) | 62 (Unhealthy for Sensitive Groups) | 48 (Moderate) | 56 (Unhealthy for Sensitive Groups) | 61 (Unhealthy for Sensitive Groups) | 87 (Unhealthy) | 93 (Unhealthy) | 100 (Unhealthy) | 121 (Very Unhealthy) | 173 (Very bad Hazardous) | 148 (Very Unhealthy) | 133 (Very Unhealthy) | 84 (Unhealthy) |
| so2 | 15 (Good) | 19 (Good) | 19 (Good) | 36 (Good) | 80 (Moderate) | 43 (Good) | 32 (Good) | 20 (Good) | 16 (Good) | 13 (Good) | 17 (Good) | 13 (Good) | 13 (Good) | 19 (Good) | 36 (Good) | 51 (Moderate) | 99 (Moderate) | 68 (Moderate) | 49 (Good) | 26 (Good) |
PM10 53 (Ungesund für sensible Gruppen)
Feinstaub (PM10) SchwebestaubO3 0.02 (gut)
Ozon (O3)PM2,5 6.6 (gut)
Feinstaub (PM2,5)SO2 18 (gut)
Schwefeldioxid (SO2)NO2 3 (gut)
Stickstoffdioxid (NO2)CO 1.3 (gut)
Kohlenmonoxid (CO)区政府
| index | 2022-05-27 |
|---|---|
| pm10 | 51 |
| o3 | 0.02 |
| pm25 | 21 |
| so2 | 9.6 |
| no2 | 0.38 |
| co | 0.64 |
区政府
| index | 2020-05 | 2020-04 | 2020-03 | 2020-02 | 2020-01 | 2019-12 | 2019-11 | 2019-10 | 2019-09 | 2019-08 | 2019-07 | 2019-06 | 2019-05 | 2019-04 | 2019-03 | 2019-02 | 2019-01 | 2018-12 | 2018-11 | 2018-10 |
|---|---|---|---|---|---|---|---|---|---|---|---|---|---|---|---|---|---|---|---|---|
| pm25 | 28 | 25 | 26 | 47 | 102 | 49 | 46 | 29 | 21 | 15 | 20 | 24 | 26 | 29 | 42 | 61 | 93 | 70 | 58 | 38 |
| co | 627 | 626 | 623 | 854 | 1 | 1 | 972 | 842 | 841 | 846 | 936 | 732 | 556 | 724 | 871 | 977 | 1 | 1 | 1 | 825 |
| no2 | 20 | 27 | 23 | 26 | 51 | 39 | 40 | 32 | 29 | 25 | 25 | 23 | 22 | 28 | 33 | 34 | 46 | 36 | 43 | 36 |
| o3 | 141 | 124 | 100 | 92 | 65 | 66 | 73 | 96 | 136 | 137 | 159 | 173 | 146 | 125 | 109 | 101 | 59 | 53 | 83 | 92 |
| pm10 | 131 | 81 | 75 | 94 | 159 | 99 | 116 | 82 | 62 | 48 | 56 | 61 | 87 | 93 | 100 | 121 | 173 | 148 | 133 | 84 |
| so2 | 15 | 19 | 19 | 36 | 80 | 43 | 32 | 20 | 16 | 13 | 17 | 13 | 13 | 19 | 36 | 51 | 99 | 68 | 49 | 26 |