Luftverschmutzung in Laowangfu: Echtzeit-Luft-Qualitätsindex und Smog-Alarm.
Für die Laowangfu. Heute ist Donnerstag, 4. Juni 2026. Für Laowangfu wurden folgende Luftverschmutzungswerte gemessen:- Feinstaub (PM10) Schwebestaub - 53 (Ungesund für sensible Gruppen)
- Ozon (O3) - 0 (gut)
- Feinstaub (PM2,5) - 7 (gut)
- Schwefeldioxid (SO2) - 18 (gut)
- Stickstoffdioxid (NO2) - 3 (gut)
- Kohlenmonoxid (CO) - 1 (gut)

Wie ist die Luftqualität Laowangfu heute? Ist die Luft in Laowangfu? verschmutzt. Gibt es Smog?
Wie hoch ist der PM10-Stand heute in Laowangfu? (Feinstaub (PM10) Schwebestaub)
Der aktuelle Feinstaubgehalt PM10 in Laowangfu is:
53 (Ungesund für sensible Gruppen)
Die höchsten PM10-Werte treten in der Regel im Monat auf: 163 (Januar 2019).
Der niedrigste Wert der Feinstaub-PM10-Belastung in Laowangfu ist in der Regel in: August (43).
Wie ist das O3-Niveau heute in Laowangfu? (Ozon (O3))
0 (gut)
Wie hoch ist der aktuelle PM2,5-Wert in Laowangfu? (Feinstaub (PM2,5))
Die heutige PM2.5-Stufe ist:
7 (gut)
Zum Vergleich: Der höchste PM2,5-Wert in Laowangfu in den letzten 7 Tagen war: 21 (Freitag, 27. Mai 2022) und der niedrigste: 21 (Freitag, 27. Mai 2022).
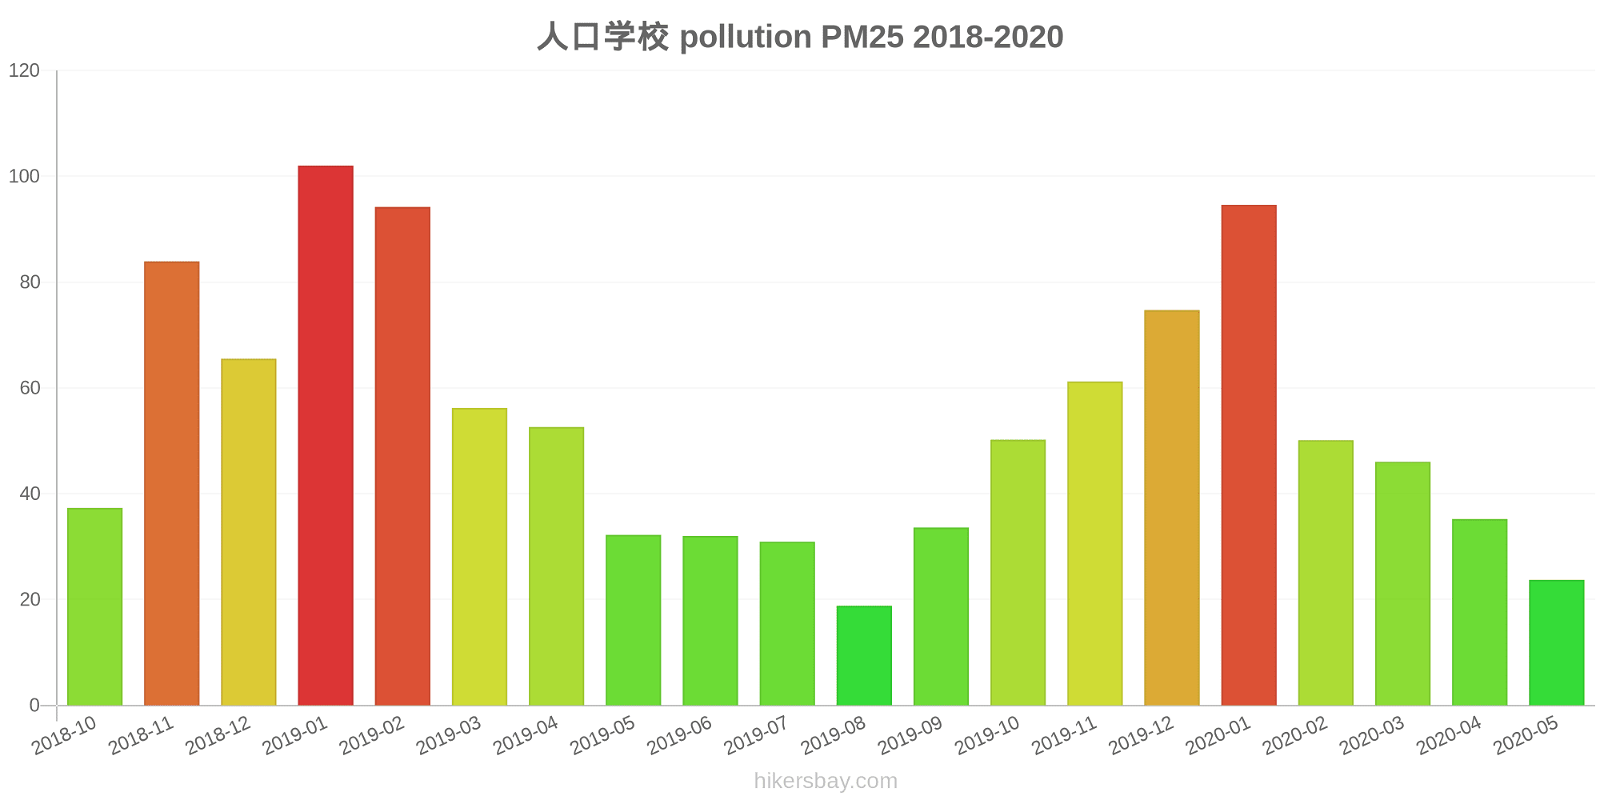
Die höchsten PM2,5-Werte wurden gemessen: 102 (Januar 2019).
Die niedrigste Feinstaubbelastung PM2,5 tritt im Monat auf: August (19).
Wie hoch ist die SO2-Belastung? (Schwefeldioxid (SO2))
18 (gut)
Wie hoch ist das NO2-Niveau? (Stickstoffdioxid (NO2))
3 (gut)
Wie hoch ist der CO-Gehalt? (Kohlenmonoxid (CO))
1 (gut)
Aktuelle Daten Freitag, 27. Mai 2022, 12:00
PM10 53 (Ungesund für sensible Gruppen)
O3 0 (gut)
PM2,5 7 (gut)
SO2 18 (gut)
NO2 3 (gut)
CO 1 (gut)
Daten zur Luftverschmutzung der letzten Tage in Laowangfu
index
2022-05-27
pm10
51
Unhealthy for Sensitive Groups
o3
0
Good
pm25
21
Moderate
so2
10
Good
no2
0
Good
co
1
Good
data source »
Luftverschmutzung in Laowangfu von Oktober 2018 bis Mai 2020

index
2020-05
2020-04
2020-03
2020-02
2020-01
2019-12
2019-11
2019-10
2019-09
2019-08
2019-07
2019-06
2019-05
2019-04
2019-03
2019-02
2019-01
2018-12
2018-11
2018-10
pm25
24 (Moderate)
35 (Unhealthy for Sensitive Groups)
46 (Unhealthy for Sensitive Groups)
50 (Unhealthy for Sensitive Groups)
95 (Very Unhealthy)
75 (Unhealthy)
61 (Unhealthy)
50 (Unhealthy for Sensitive Groups)
34 (Moderate)
19 (Moderate)
31 (Moderate)
32 (Moderate)
32 (Moderate)
53 (Unhealthy for Sensitive Groups)
56 (Unhealthy)
94 (Very Unhealthy)
102 (Very Unhealthy)
66 (Unhealthy)
84 (Very Unhealthy)
37 (Unhealthy for Sensitive Groups)
co
648 (Good)
564 (Good)
522 (Good)
854 (Good)
1 (Good)
931 (Good)
633 (Good)
619 (Good)
560 (Good)
478 (Good)
608 (Good)
348 (Good)
415 (Good)
662 (Good)
621 (Good)
1 (Good)
1 (Good)
1 (Good)
935 (Good)
852 (Good)
no2
22 (Good)
20 (Good)
21 (Good)
19 (Good)
45 (Moderate)
43 (Moderate)
38 (Good)
31 (Good)
25 (Good)
19 (Good)
24 (Good)
22 (Good)
21 (Good)
28 (Good)
32 (Good)
35 (Good)
51 (Moderate)
46 (Moderate)
44 (Moderate)
35 (Good)
o3
155 (Unhealthy)
143 (Unhealthy for Sensitive Groups)
114 (Moderate)
101 (Moderate)
77 (Moderate)
59 (Good)
85 (Moderate)
122 (Unhealthy for Sensitive Groups)
164 (Unhealthy)
136 (Unhealthy for Sensitive Groups)
189 (Very Unhealthy)
212 (Very Unhealthy)
168 (Unhealthy)
139 (Unhealthy for Sensitive Groups)
123 (Unhealthy for Sensitive Groups)
93 (Moderate)
59 (Good)
48 (Good)
76 (Moderate)
94 (Moderate)
pm10
67 (Unhealthy for Sensitive Groups)
80 (Unhealthy for Sensitive Groups)
88 (Unhealthy)
68 (Unhealthy for Sensitive Groups)
123 (Very Unhealthy)
108 (Unhealthy)
123 (Very Unhealthy)
100 (Unhealthy)
71 (Unhealthy for Sensitive Groups)
43 (Moderate)
63 (Unhealthy for Sensitive Groups)
80 (Unhealthy for Sensitive Groups)
84 (Unhealthy)
102 (Unhealthy)
106 (Unhealthy)
131 (Very Unhealthy)
163 (Very bad Hazardous)
129 (Very Unhealthy)
148 (Very Unhealthy)
91 (Unhealthy)
so2
10 (Good)
11 (Good)
11 (Good)
9.4 (Good)
15 (Good)
12 (Good)
12 (Good)
11 (Good)
9.5 (Good)
9.3 (Good)
13 (Good)
15 (Good)
14 (Good)
15 (Good)
15 (Good)
14 (Good)
19 (Good)
18 (Good)
13 (Good)
17 (Good)
data source »
人口学校
Freitag, 27. Mai 2022, 12:00
PM10 53 (Ungesund für sensible Gruppen)
Feinstaub (PM10) Schwebestaub
O3 0.02 (gut)
Ozon (O3)
PM2,5 6.6 (gut)
Feinstaub (PM2,5)
SO2 18 (gut)
Schwefeldioxid (SO2)
NO2 3 (gut)
Stickstoffdioxid (NO2)
CO 1.3 (gut)
Kohlenmonoxid (CO)
人口学校
index
2022-05-27
pm10
51
o3
0.02
pm25
21
so2
9.6
no2
0.38
co
0.64
人口学校
2018-10 2020-05
index
2020-05
2020-04
2020-03
2020-02
2020-01
2019-12
2019-11
2019-10
2019-09
2019-08
2019-07
2019-06
2019-05
2019-04
2019-03
2019-02
2019-01
2018-12
2018-11
2018-10
pm25
24
35
46
50
95
75
61
50
34
19
31
32
32
53
56
94
102
66
84
37
co
648
564
522
854
1
931
633
619
560
478
608
348
415
662
621
1
1
1
935
852
no2
22
20
21
19
45
43
38
31
25
19
24
22
21
28
32
35
51
46
44
35
o3
155
143
114
101
77
59
85
122
164
136
189
212
168
139
123
93
59
48
76
94
pm10
67
80
88
68
123
108
123
100
71
43
63
80
84
102
106
131
163
129
148
91
so2
10
11
11
9.4
15
12
12
11
9.5
9.3
13
15
14
15
15
14
19
18
13
17
* Pollution data source:
https://openaq.org
(ChinaAQIData)
The data is licensed under CC-By 4.0
PM10 53 (Ungesund für sensible Gruppen)
O3 0 (gut)
PM2,5 7 (gut)
SO2 18 (gut)
NO2 3 (gut)
CO 1 (gut)
Daten zur Luftverschmutzung der letzten Tage in Laowangfu
| index | 2022-05-27 |
|---|---|
| pm10 | 51 Unhealthy for Sensitive Groups |
| o3 | 0 Good |
| pm25 | 21 Moderate |
| so2 | 10 Good |
| no2 | 0 Good |
| co | 1 Good |

| index | 2020-05 | 2020-04 | 2020-03 | 2020-02 | 2020-01 | 2019-12 | 2019-11 | 2019-10 | 2019-09 | 2019-08 | 2019-07 | 2019-06 | 2019-05 | 2019-04 | 2019-03 | 2019-02 | 2019-01 | 2018-12 | 2018-11 | 2018-10 |
|---|---|---|---|---|---|---|---|---|---|---|---|---|---|---|---|---|---|---|---|---|
| pm25 | 24 (Moderate) | 35 (Unhealthy for Sensitive Groups) | 46 (Unhealthy for Sensitive Groups) | 50 (Unhealthy for Sensitive Groups) | 95 (Very Unhealthy) | 75 (Unhealthy) | 61 (Unhealthy) | 50 (Unhealthy for Sensitive Groups) | 34 (Moderate) | 19 (Moderate) | 31 (Moderate) | 32 (Moderate) | 32 (Moderate) | 53 (Unhealthy for Sensitive Groups) | 56 (Unhealthy) | 94 (Very Unhealthy) | 102 (Very Unhealthy) | 66 (Unhealthy) | 84 (Very Unhealthy) | 37 (Unhealthy for Sensitive Groups) |
| co | 648 (Good) | 564 (Good) | 522 (Good) | 854 (Good) | 1 (Good) | 931 (Good) | 633 (Good) | 619 (Good) | 560 (Good) | 478 (Good) | 608 (Good) | 348 (Good) | 415 (Good) | 662 (Good) | 621 (Good) | 1 (Good) | 1 (Good) | 1 (Good) | 935 (Good) | 852 (Good) |
| no2 | 22 (Good) | 20 (Good) | 21 (Good) | 19 (Good) | 45 (Moderate) | 43 (Moderate) | 38 (Good) | 31 (Good) | 25 (Good) | 19 (Good) | 24 (Good) | 22 (Good) | 21 (Good) | 28 (Good) | 32 (Good) | 35 (Good) | 51 (Moderate) | 46 (Moderate) | 44 (Moderate) | 35 (Good) |
| o3 | 155 (Unhealthy) | 143 (Unhealthy for Sensitive Groups) | 114 (Moderate) | 101 (Moderate) | 77 (Moderate) | 59 (Good) | 85 (Moderate) | 122 (Unhealthy for Sensitive Groups) | 164 (Unhealthy) | 136 (Unhealthy for Sensitive Groups) | 189 (Very Unhealthy) | 212 (Very Unhealthy) | 168 (Unhealthy) | 139 (Unhealthy for Sensitive Groups) | 123 (Unhealthy for Sensitive Groups) | 93 (Moderate) | 59 (Good) | 48 (Good) | 76 (Moderate) | 94 (Moderate) |
| pm10 | 67 (Unhealthy for Sensitive Groups) | 80 (Unhealthy for Sensitive Groups) | 88 (Unhealthy) | 68 (Unhealthy for Sensitive Groups) | 123 (Very Unhealthy) | 108 (Unhealthy) | 123 (Very Unhealthy) | 100 (Unhealthy) | 71 (Unhealthy for Sensitive Groups) | 43 (Moderate) | 63 (Unhealthy for Sensitive Groups) | 80 (Unhealthy for Sensitive Groups) | 84 (Unhealthy) | 102 (Unhealthy) | 106 (Unhealthy) | 131 (Very Unhealthy) | 163 (Very bad Hazardous) | 129 (Very Unhealthy) | 148 (Very Unhealthy) | 91 (Unhealthy) |
| so2 | 10 (Good) | 11 (Good) | 11 (Good) | 9.4 (Good) | 15 (Good) | 12 (Good) | 12 (Good) | 11 (Good) | 9.5 (Good) | 9.3 (Good) | 13 (Good) | 15 (Good) | 14 (Good) | 15 (Good) | 15 (Good) | 14 (Good) | 19 (Good) | 18 (Good) | 13 (Good) | 17 (Good) |
PM10 53 (Ungesund für sensible Gruppen)
Feinstaub (PM10) SchwebestaubO3 0.02 (gut)
Ozon (O3)PM2,5 6.6 (gut)
Feinstaub (PM2,5)SO2 18 (gut)
Schwefeldioxid (SO2)NO2 3 (gut)
Stickstoffdioxid (NO2)CO 1.3 (gut)
Kohlenmonoxid (CO)人口学校
| index | 2022-05-27 |
|---|---|
| pm10 | 51 |
| o3 | 0.02 |
| pm25 | 21 |
| so2 | 9.6 |
| no2 | 0.38 |
| co | 0.64 |
人口学校

| index | 2020-05 | 2020-04 | 2020-03 | 2020-02 | 2020-01 | 2019-12 | 2019-11 | 2019-10 | 2019-09 | 2019-08 | 2019-07 | 2019-06 | 2019-05 | 2019-04 | 2019-03 | 2019-02 | 2019-01 | 2018-12 | 2018-11 | 2018-10 |
|---|---|---|---|---|---|---|---|---|---|---|---|---|---|---|---|---|---|---|---|---|
| pm25 | 24 | 35 | 46 | 50 | 95 | 75 | 61 | 50 | 34 | 19 | 31 | 32 | 32 | 53 | 56 | 94 | 102 | 66 | 84 | 37 |
| co | 648 | 564 | 522 | 854 | 1 | 931 | 633 | 619 | 560 | 478 | 608 | 348 | 415 | 662 | 621 | 1 | 1 | 1 | 935 | 852 |
| no2 | 22 | 20 | 21 | 19 | 45 | 43 | 38 | 31 | 25 | 19 | 24 | 22 | 21 | 28 | 32 | 35 | 51 | 46 | 44 | 35 |
| o3 | 155 | 143 | 114 | 101 | 77 | 59 | 85 | 122 | 164 | 136 | 189 | 212 | 168 | 139 | 123 | 93 | 59 | 48 | 76 | 94 |
| pm10 | 67 | 80 | 88 | 68 | 123 | 108 | 123 | 100 | 71 | 43 | 63 | 80 | 84 | 102 | 106 | 131 | 163 | 129 | 148 | 91 |
| so2 | 10 | 11 | 11 | 9.4 | 15 | 12 | 12 | 11 | 9.5 | 9.3 | 13 | 15 | 14 | 15 | 15 | 14 | 19 | 18 | 13 | 17 |