Luftverschmutzung in Huazhuang: Echtzeit-Luft-Qualitätsindex und Smog-Alarm.
Für die Huazhuang. Heute ist Donnerstag, 4. Juni 2026. Für Huazhuang wurden folgende Luftverschmutzungswerte gemessen:- Feinstaub (PM10) Schwebestaub - 179 (Sehr schlecht Gefährlich)
- Feinstaub (PM2,5) - 35 (Ungesund für sensible Gruppen)
- Ozon (O3) - 0 (gut)
- Stickstoffdioxid (NO2) - 0 (gut)
- Schwefeldioxid (SO2) - 0 (gut)

Wie ist die Luftqualität Huazhuang heute? Ist die Luft in Huazhuang? verschmutzt. Gibt es Smog?
Wie hoch ist der PM10-Stand heute in Huazhuang? (Feinstaub (PM10) Schwebestaub)
Der aktuelle Feinstaubgehalt PM10 in Huazhuang is:
179 (Sehr schlecht Gefährlich)
Die höchsten PM10-Werte treten in der Regel im Monat auf: 210 (Januar 2019).
Der niedrigste Wert der Feinstaub-PM10-Belastung in Huazhuang ist in der Regel in: August (47).
Wie hoch ist der aktuelle PM2,5-Wert in Huazhuang? (Feinstaub (PM2,5))
Die heutige PM2.5-Stufe ist:
35 (Ungesund für sensible Gruppen)
Zum Vergleich: Der höchste PM2,5-Wert in Huazhuang in den letzten 7 Tagen war: 56 (Freitag, 27. Mai 2022) und der niedrigste: 56 (Freitag, 27. Mai 2022).
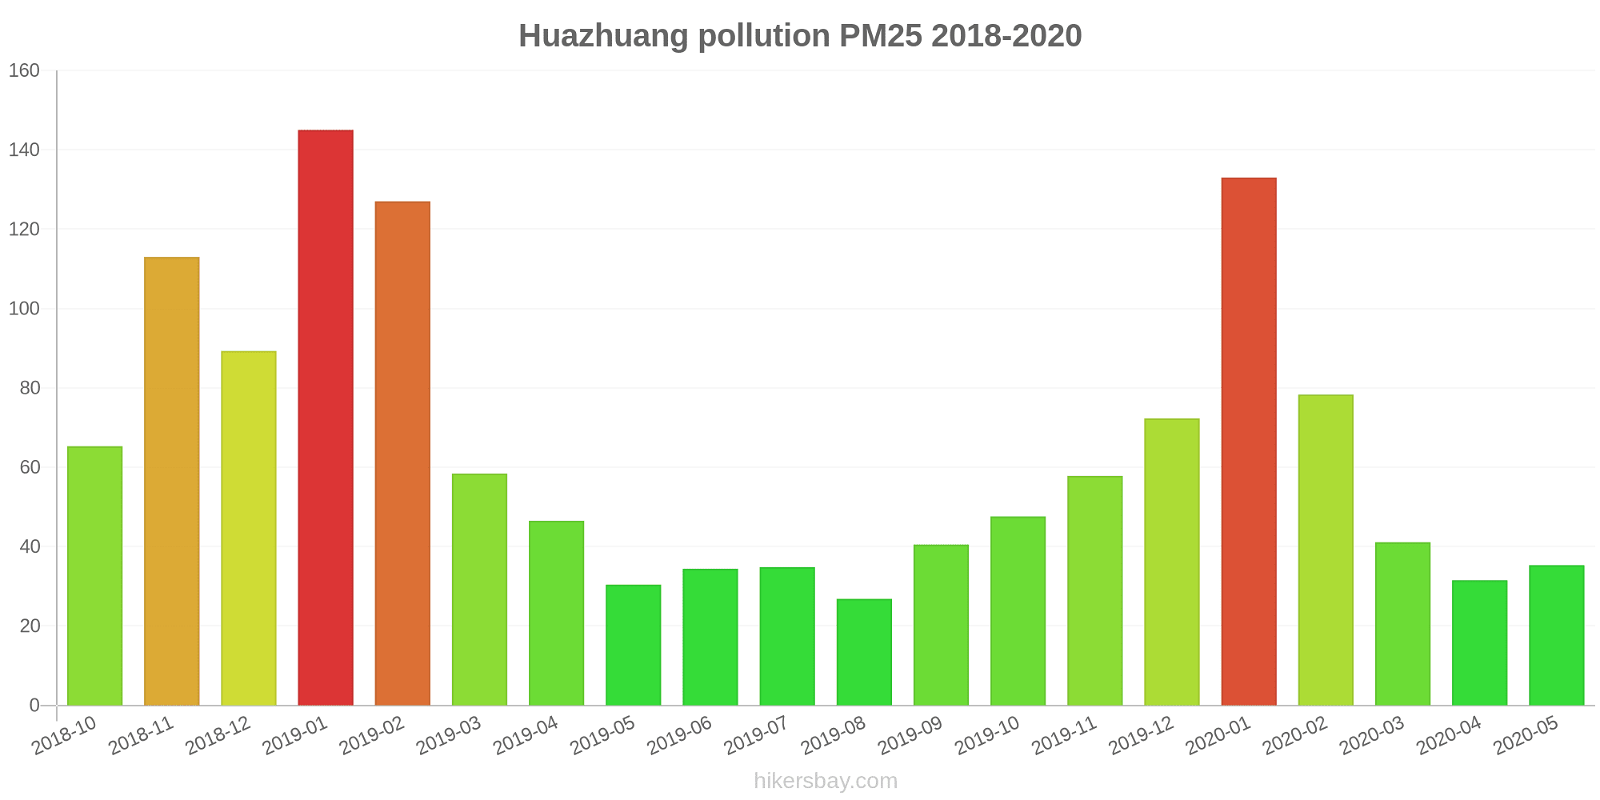
Die höchsten PM2,5-Werte wurden gemessen: 145 (Januar 2019).
Die niedrigste Feinstaubbelastung PM2,5 tritt im Monat auf: August (27).
Wie ist das O3-Niveau heute in Huazhuang? (Ozon (O3))
0 (gut)
Wie hoch ist das NO2-Niveau? (Stickstoffdioxid (NO2))
0 (gut)
Wie hoch ist die SO2-Belastung? (Schwefeldioxid (SO2))
0 (gut)
Aktuelle Daten Freitag, 27. Mai 2022, 12:00
PM10 179 (Sehr schlecht Gefährlich)
PM2,5 35 (Ungesund für sensible Gruppen)
O3 0 (gut)
NO2 0 (gut)
SO2 0 (gut)
Daten zur Luftverschmutzung der letzten Tage in Huazhuang
index
2022-05-27
pm10
56
Unhealthy for Sensitive Groups
pm25
56
Unhealthy
o3
0
Good
no2
0
Good
so2
0
Good
data source »
Luftverschmutzung in Huazhuang von Oktober 2018 bis Mai 2020
index
2020-05
2020-04
2020-03
2020-02
2020-01
2019-12
2019-11
2019-10
2019-09
2019-08
2019-07
2019-06
2019-05
2019-04
2019-03
2019-02
2019-01
2018-12
2018-11
2018-10
pm25
35 (Unhealthy for Sensitive Groups)
32 (Moderate)
41 (Unhealthy for Sensitive Groups)
78 (Very Unhealthy)
133 (Very bad Hazardous)
72 (Unhealthy)
58 (Unhealthy)
48 (Unhealthy for Sensitive Groups)
41 (Unhealthy for Sensitive Groups)
27 (Moderate)
35 (Moderate)
34 (Moderate)
30 (Moderate)
47 (Unhealthy for Sensitive Groups)
58 (Unhealthy)
127 (Very bad Hazardous)
145 (Very bad Hazardous)
89 (Very Unhealthy)
113 (Very bad Hazardous)
65 (Unhealthy)
co
530 (Good)
524 (Good)
632 (Good)
1 (Good)
1 (Good)
1 (Good)
779 (Good)
693 (Good)
615 (Good)
465 (Good)
528 (Good)
508 (Good)
432 (Good)
744 (Good)
759 (Good)
1 (Good)
2 (Good)
1 (Good)
1 (Good)
745 (Good)
no2
23 (Good)
28 (Good)
30 (Good)
26 (Good)
53 (Moderate)
57 (Moderate)
54 (Moderate)
49 (Moderate)
36 (Good)
24 (Good)
23 (Good)
26 (Good)
28 (Good)
30 (Good)
34 (Good)
47 (Moderate)
70 (Moderate)
62 (Moderate)
68 (Moderate)
56 (Moderate)
o3
133 (Unhealthy for Sensitive Groups)
138 (Unhealthy for Sensitive Groups)
99 (Moderate)
84 (Moderate)
60 (Good)
44 (Good)
54 (Good)
96 (Moderate)
188 (Very Unhealthy)
149 (Unhealthy for Sensitive Groups)
200 (Very Unhealthy)
217 (Very Unhealthy)
180 (Very Unhealthy)
131 (Unhealthy for Sensitive Groups)
114 (Moderate)
88 (Moderate)
45 (Good)
46 (Good)
59 (Good)
93 (Moderate)
pm10
75 (Unhealthy for Sensitive Groups)
75 (Unhealthy for Sensitive Groups)
74 (Unhealthy for Sensitive Groups)
101 (Unhealthy)
177 (Very bad Hazardous)
120 (Very Unhealthy)
118 (Very Unhealthy)
93 (Unhealthy)
79 (Unhealthy for Sensitive Groups)
47 (Moderate)
63 (Unhealthy for Sensitive Groups)
72 (Unhealthy for Sensitive Groups)
84 (Unhealthy)
101 (Unhealthy)
102 (Unhealthy)
172 (Very bad Hazardous)
210 (Very bad Hazardous)
153 (Very bad Hazardous)
181 (Very bad Hazardous)
118 (Very Unhealthy)
so2
8.9 (Good)
11 (Good)
10 (Good)
10 (Good)
20 (Good)
13 (Good)
11 (Good)
7.8 (Good)
8.4 (Good)
5.3 (Good)
5.7 (Good)
8.3 (Good)
10 (Good)
8.6 (Good)
11 (Good)
15 (Good)
31 (Good)
25 (Good)
21 (Good)
15 (Good)
data source »
接待中心
Freitag, 27. Mai 2022, 12:00
PM10 179 (Sehr schlecht Gefährlich)
Feinstaub (PM10) Schwebestaub
PM2,5 35 (Ungesund für sensible Gruppen)
Feinstaub (PM2,5)
O3 0.04 (gut)
Ozon (O3)
NO2 0 (gut)
Stickstoffdioxid (NO2)
SO2 0 (gut)
Schwefeldioxid (SO2)
接待中心
index
2022-05-27
pm10
56
pm25
56
o3
0.03
no2
0
so2
0
接待中心
2018-10 2020-05

index
2020-05
2020-04
2020-03
2020-02
2020-01
2019-12
2019-11
2019-10
2019-09
2019-08
2019-07
2019-06
2019-05
2019-04
2019-03
2019-02
2019-01
2018-12
2018-11
2018-10
pm25
35
32
41
78
133
72
58
48
41
27
35
34
30
47
58
127
145
89
113
65
co
530
524
632
1
1
1
779
693
615
465
528
508
432
744
759
1
2
1
1
745
no2
23
28
30
26
53
57
54
49
36
24
23
26
28
30
34
47
70
62
68
56
o3
133
138
99
84
60
44
54
96
188
149
200
217
180
131
114
88
45
46
59
93
pm10
75
75
74
101
177
120
118
93
79
47
63
72
84
101
102
172
210
153
181
118
so2
8.9
11
10
10
20
13
11
7.8
8.4
5.3
5.7
8.3
10
8.6
11
15
31
25
21
15
* Pollution data source:
https://openaq.org
(ChinaAQIData)
The data is licensed under CC-By 4.0
PM10 179 (Sehr schlecht Gefährlich)
PM2,5 35 (Ungesund für sensible Gruppen)
O3 0 (gut)
NO2 0 (gut)
SO2 0 (gut)
Daten zur Luftverschmutzung der letzten Tage in Huazhuang
| index | 2022-05-27 |
|---|---|
| pm10 | 56 Unhealthy for Sensitive Groups |
| pm25 | 56 Unhealthy |
| o3 | 0 Good |
| no2 | 0 Good |
| so2 | 0 Good |

| index | 2020-05 | 2020-04 | 2020-03 | 2020-02 | 2020-01 | 2019-12 | 2019-11 | 2019-10 | 2019-09 | 2019-08 | 2019-07 | 2019-06 | 2019-05 | 2019-04 | 2019-03 | 2019-02 | 2019-01 | 2018-12 | 2018-11 | 2018-10 |
|---|---|---|---|---|---|---|---|---|---|---|---|---|---|---|---|---|---|---|---|---|
| pm25 | 35 (Unhealthy for Sensitive Groups) | 32 (Moderate) | 41 (Unhealthy for Sensitive Groups) | 78 (Very Unhealthy) | 133 (Very bad Hazardous) | 72 (Unhealthy) | 58 (Unhealthy) | 48 (Unhealthy for Sensitive Groups) | 41 (Unhealthy for Sensitive Groups) | 27 (Moderate) | 35 (Moderate) | 34 (Moderate) | 30 (Moderate) | 47 (Unhealthy for Sensitive Groups) | 58 (Unhealthy) | 127 (Very bad Hazardous) | 145 (Very bad Hazardous) | 89 (Very Unhealthy) | 113 (Very bad Hazardous) | 65 (Unhealthy) |
| co | 530 (Good) | 524 (Good) | 632 (Good) | 1 (Good) | 1 (Good) | 1 (Good) | 779 (Good) | 693 (Good) | 615 (Good) | 465 (Good) | 528 (Good) | 508 (Good) | 432 (Good) | 744 (Good) | 759 (Good) | 1 (Good) | 2 (Good) | 1 (Good) | 1 (Good) | 745 (Good) |
| no2 | 23 (Good) | 28 (Good) | 30 (Good) | 26 (Good) | 53 (Moderate) | 57 (Moderate) | 54 (Moderate) | 49 (Moderate) | 36 (Good) | 24 (Good) | 23 (Good) | 26 (Good) | 28 (Good) | 30 (Good) | 34 (Good) | 47 (Moderate) | 70 (Moderate) | 62 (Moderate) | 68 (Moderate) | 56 (Moderate) |
| o3 | 133 (Unhealthy for Sensitive Groups) | 138 (Unhealthy for Sensitive Groups) | 99 (Moderate) | 84 (Moderate) | 60 (Good) | 44 (Good) | 54 (Good) | 96 (Moderate) | 188 (Very Unhealthy) | 149 (Unhealthy for Sensitive Groups) | 200 (Very Unhealthy) | 217 (Very Unhealthy) | 180 (Very Unhealthy) | 131 (Unhealthy for Sensitive Groups) | 114 (Moderate) | 88 (Moderate) | 45 (Good) | 46 (Good) | 59 (Good) | 93 (Moderate) |
| pm10 | 75 (Unhealthy for Sensitive Groups) | 75 (Unhealthy for Sensitive Groups) | 74 (Unhealthy for Sensitive Groups) | 101 (Unhealthy) | 177 (Very bad Hazardous) | 120 (Very Unhealthy) | 118 (Very Unhealthy) | 93 (Unhealthy) | 79 (Unhealthy for Sensitive Groups) | 47 (Moderate) | 63 (Unhealthy for Sensitive Groups) | 72 (Unhealthy for Sensitive Groups) | 84 (Unhealthy) | 101 (Unhealthy) | 102 (Unhealthy) | 172 (Very bad Hazardous) | 210 (Very bad Hazardous) | 153 (Very bad Hazardous) | 181 (Very bad Hazardous) | 118 (Very Unhealthy) |
| so2 | 8.9 (Good) | 11 (Good) | 10 (Good) | 10 (Good) | 20 (Good) | 13 (Good) | 11 (Good) | 7.8 (Good) | 8.4 (Good) | 5.3 (Good) | 5.7 (Good) | 8.3 (Good) | 10 (Good) | 8.6 (Good) | 11 (Good) | 15 (Good) | 31 (Good) | 25 (Good) | 21 (Good) | 15 (Good) |
PM10 179 (Sehr schlecht Gefährlich)
Feinstaub (PM10) SchwebestaubPM2,5 35 (Ungesund für sensible Gruppen)
Feinstaub (PM2,5)O3 0.04 (gut)
Ozon (O3)NO2 0 (gut)
Stickstoffdioxid (NO2)SO2 0 (gut)
Schwefeldioxid (SO2)接待中心
| index | 2022-05-27 |
|---|---|
| pm10 | 56 |
| pm25 | 56 |
| o3 | 0.03 |
| no2 | 0 |
| so2 | 0 |
接待中心

| index | 2020-05 | 2020-04 | 2020-03 | 2020-02 | 2020-01 | 2019-12 | 2019-11 | 2019-10 | 2019-09 | 2019-08 | 2019-07 | 2019-06 | 2019-05 | 2019-04 | 2019-03 | 2019-02 | 2019-01 | 2018-12 | 2018-11 | 2018-10 |
|---|---|---|---|---|---|---|---|---|---|---|---|---|---|---|---|---|---|---|---|---|
| pm25 | 35 | 32 | 41 | 78 | 133 | 72 | 58 | 48 | 41 | 27 | 35 | 34 | 30 | 47 | 58 | 127 | 145 | 89 | 113 | 65 |
| co | 530 | 524 | 632 | 1 | 1 | 1 | 779 | 693 | 615 | 465 | 528 | 508 | 432 | 744 | 759 | 1 | 2 | 1 | 1 | 745 |
| no2 | 23 | 28 | 30 | 26 | 53 | 57 | 54 | 49 | 36 | 24 | 23 | 26 | 28 | 30 | 34 | 47 | 70 | 62 | 68 | 56 |
| o3 | 133 | 138 | 99 | 84 | 60 | 44 | 54 | 96 | 188 | 149 | 200 | 217 | 180 | 131 | 114 | 88 | 45 | 46 | 59 | 93 |
| pm10 | 75 | 75 | 74 | 101 | 177 | 120 | 118 | 93 | 79 | 47 | 63 | 72 | 84 | 101 | 102 | 172 | 210 | 153 | 181 | 118 |
| so2 | 8.9 | 11 | 10 | 10 | 20 | 13 | 11 | 7.8 | 8.4 | 5.3 | 5.7 | 8.3 | 10 | 8.6 | 11 | 15 | 31 | 25 | 21 | 15 |