Luftverschmutzung in Nanliugezhuang: Echtzeit-Luft-Qualitätsindex und Smog-Alarm.
Für die Nanliugezhuang. Heute ist Donnerstag, 4. Juni 2026. Für Nanliugezhuang wurden folgende Luftverschmutzungswerte gemessen:- Feinstaub (PM10) Schwebestaub - 179 (Sehr schlecht Gefährlich)
- Feinstaub (PM2,5) - 35 (Ungesund für sensible Gruppen)
- Ozon (O3) - 0 (gut)
- Stickstoffdioxid (NO2) - 0 (gut)
- Schwefeldioxid (SO2) - 0 (gut)

Wie ist die Luftqualität Nanliugezhuang heute? Ist die Luft in Nanliugezhuang? verschmutzt. Gibt es Smog?
Wie hoch ist der PM10-Stand heute in Nanliugezhuang? (Feinstaub (PM10) Schwebestaub)
Der aktuelle Feinstaubgehalt PM10 in Nanliugezhuang is:
179 (Sehr schlecht Gefährlich)
Die höchsten PM10-Werte treten in der Regel im Monat auf: 242 (Januar 2019).
Der niedrigste Wert der Feinstaub-PM10-Belastung in Nanliugezhuang ist in der Regel in: August (68).
Wie hoch ist der aktuelle PM2,5-Wert in Nanliugezhuang? (Feinstaub (PM2,5))
Die heutige PM2.5-Stufe ist:
35 (Ungesund für sensible Gruppen)
Zum Vergleich: Der höchste PM2,5-Wert in Nanliugezhuang in den letzten 7 Tagen war: 56 (Freitag, 27. Mai 2022) und der niedrigste: 56 (Freitag, 27. Mai 2022).
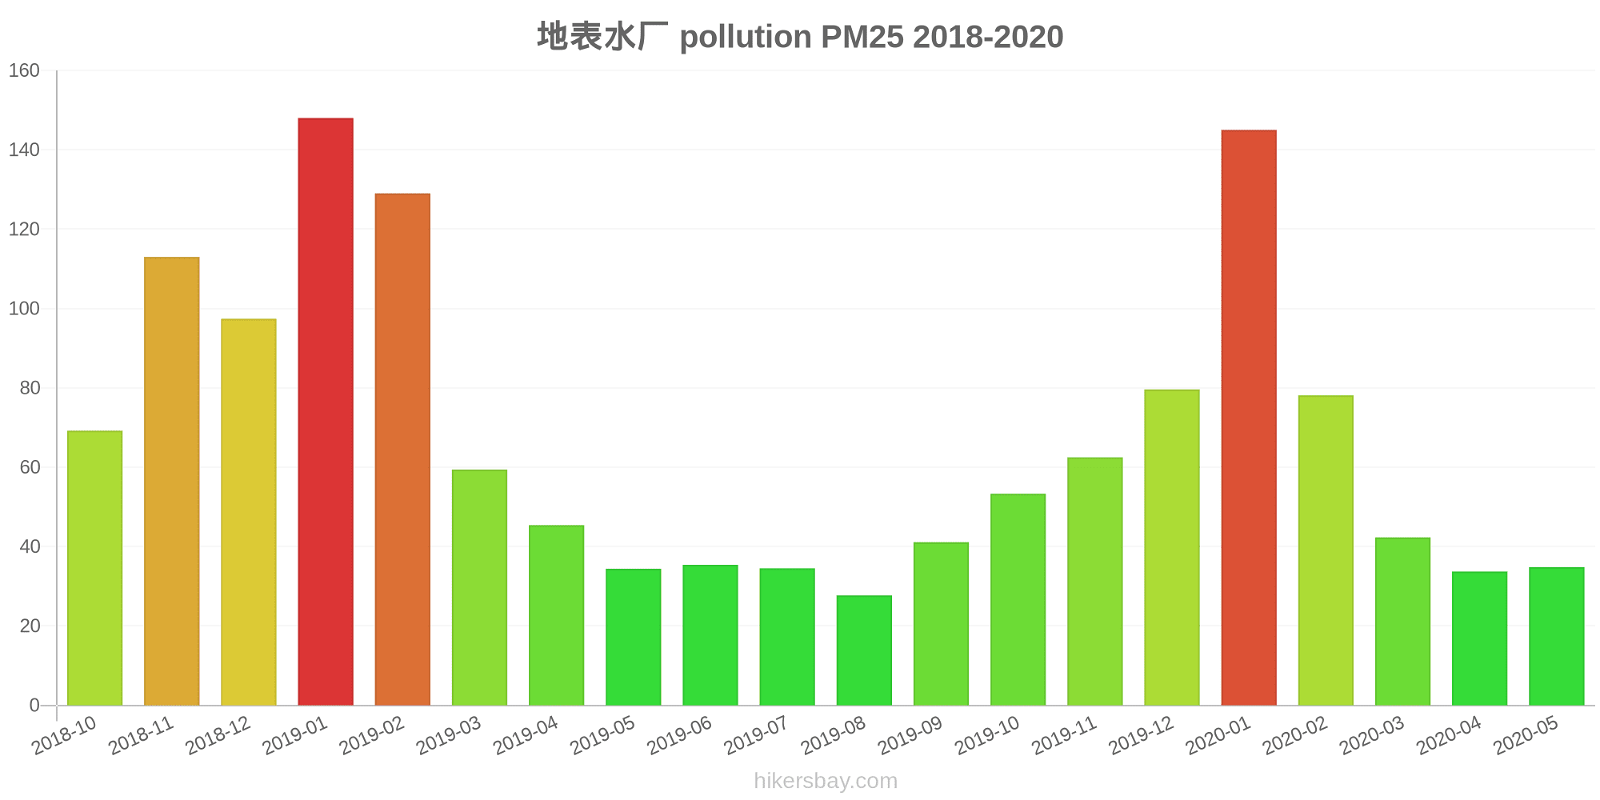
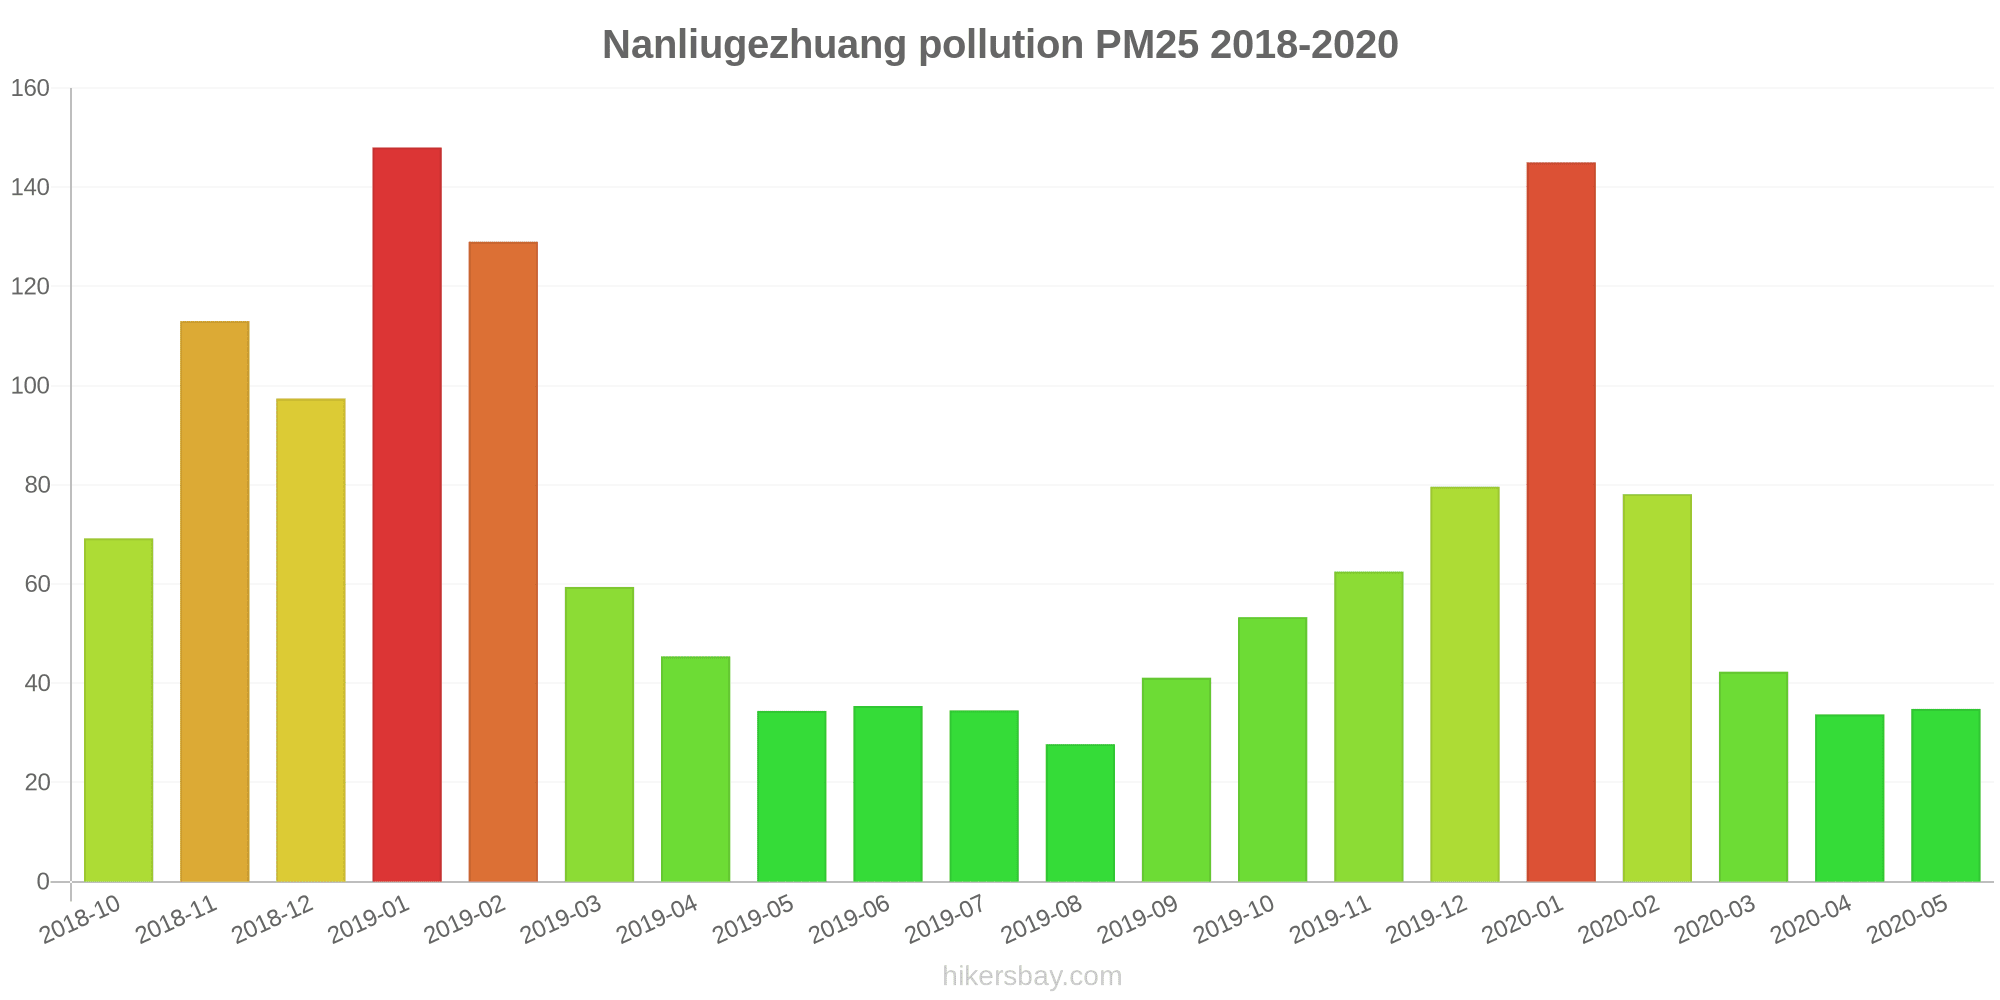
Die höchsten PM2,5-Werte wurden gemessen: 148 (Januar 2019).
Die niedrigste Feinstaubbelastung PM2,5 tritt im Monat auf: August (28).
Wie ist das O3-Niveau heute in Nanliugezhuang? (Ozon (O3))
0 (gut)
Wie hoch ist das NO2-Niveau? (Stickstoffdioxid (NO2))
0 (gut)
Wie hoch ist die SO2-Belastung? (Schwefeldioxid (SO2))
0 (gut)
Aktuelle Daten Freitag, 27. Mai 2022, 12:00
PM10 179 (Sehr schlecht Gefährlich)
PM2,5 35 (Ungesund für sensible Gruppen)
O3 0 (gut)
NO2 0 (gut)
SO2 0 (gut)
Daten zur Luftverschmutzung der letzten Tage in Nanliugezhuang
index
2022-05-27
pm10
56
Unhealthy for Sensitive Groups
pm25
56
Unhealthy
o3
0
Good
no2
0
Good
so2
0
Good
data source »
Luftverschmutzung in Nanliugezhuang von Oktober 2018 bis Mai 2020

index
2020-05
2020-04
2020-03
2020-02
2020-01
2019-12
2019-11
2019-10
2019-09
2019-08
2019-07
2019-06
2019-05
2019-04
2019-03
2019-02
2019-01
2018-12
2018-11
2018-10
pm25
35 (Moderate)
34 (Moderate)
42 (Unhealthy for Sensitive Groups)
78 (Very Unhealthy)
145 (Very bad Hazardous)
80 (Very Unhealthy)
63 (Unhealthy)
53 (Unhealthy for Sensitive Groups)
41 (Unhealthy for Sensitive Groups)
28 (Moderate)
35 (Moderate)
35 (Unhealthy for Sensitive Groups)
34 (Moderate)
45 (Unhealthy for Sensitive Groups)
59 (Unhealthy)
129 (Very bad Hazardous)
148 (Very bad Hazardous)
97 (Very Unhealthy)
113 (Very bad Hazardous)
69 (Unhealthy)
co
580 (Good)
498 (Good)
470 (Good)
903 (Good)
1 (Good)
1 (Good)
793 (Good)
695 (Good)
541 (Good)
353 (Good)
500 (Good)
503 (Good)
505 (Good)
514 (Good)
657 (Good)
1 (Good)
2 (Good)
1 (Good)
1 (Good)
867 (Good)
no2
24 (Good)
28 (Good)
38 (Good)
28 (Good)
68 (Moderate)
59 (Moderate)
53 (Moderate)
45 (Moderate)
44 (Moderate)
31 (Good)
26 (Good)
32 (Good)
35 (Good)
36 (Good)
35 (Good)
45 (Moderate)
73 (Moderate)
60 (Moderate)
66 (Moderate)
60 (Moderate)
o3
134 (Unhealthy for Sensitive Groups)
130 (Unhealthy for Sensitive Groups)
99 (Moderate)
87 (Moderate)
60 (Good)
45 (Good)
55 (Good)
99 (Moderate)
179 (Unhealthy)
137 (Unhealthy for Sensitive Groups)
193 (Very Unhealthy)
205 (Very Unhealthy)
180 (Very Unhealthy)
129 (Unhealthy for Sensitive Groups)
113 (Moderate)
80 (Moderate)
43 (Good)
42 (Good)
54 (Good)
93 (Moderate)
pm10
80 (Unhealthy)
82 (Unhealthy)
82 (Unhealthy)
102 (Unhealthy)
192 (Very bad Hazardous)
122 (Very Unhealthy)
121 (Very Unhealthy)
112 (Very Unhealthy)
100 (Unhealthy)
68 (Unhealthy for Sensitive Groups)
75 (Unhealthy for Sensitive Groups)
87 (Unhealthy)
103 (Unhealthy)
110 (Very Unhealthy)
113 (Very Unhealthy)
194 (Very bad Hazardous)
242 (Very bad Hazardous)
176 (Very bad Hazardous)
192 (Very bad Hazardous)
133 (Very Unhealthy)
so2
8.4 (Good)
11 (Good)
10 (Good)
10 (Good)
21 (Good)
15 (Good)
13 (Good)
9.3 (Good)
9.3 (Good)
7.7 (Good)
8.3 (Good)
11 (Good)
13 (Good)
10 (Good)
15 (Good)
22 (Good)
41 (Good)
31 (Good)
22 (Good)
20 (Good)
data source »
地表水厂
Freitag, 27. Mai 2022, 12:00
PM10 179 (Sehr schlecht Gefährlich)
Feinstaub (PM10) Schwebestaub
PM2,5 35 (Ungesund für sensible Gruppen)
Feinstaub (PM2,5)
O3 0.04 (gut)
Ozon (O3)
NO2 0 (gut)
Stickstoffdioxid (NO2)
SO2 0 (gut)
Schwefeldioxid (SO2)
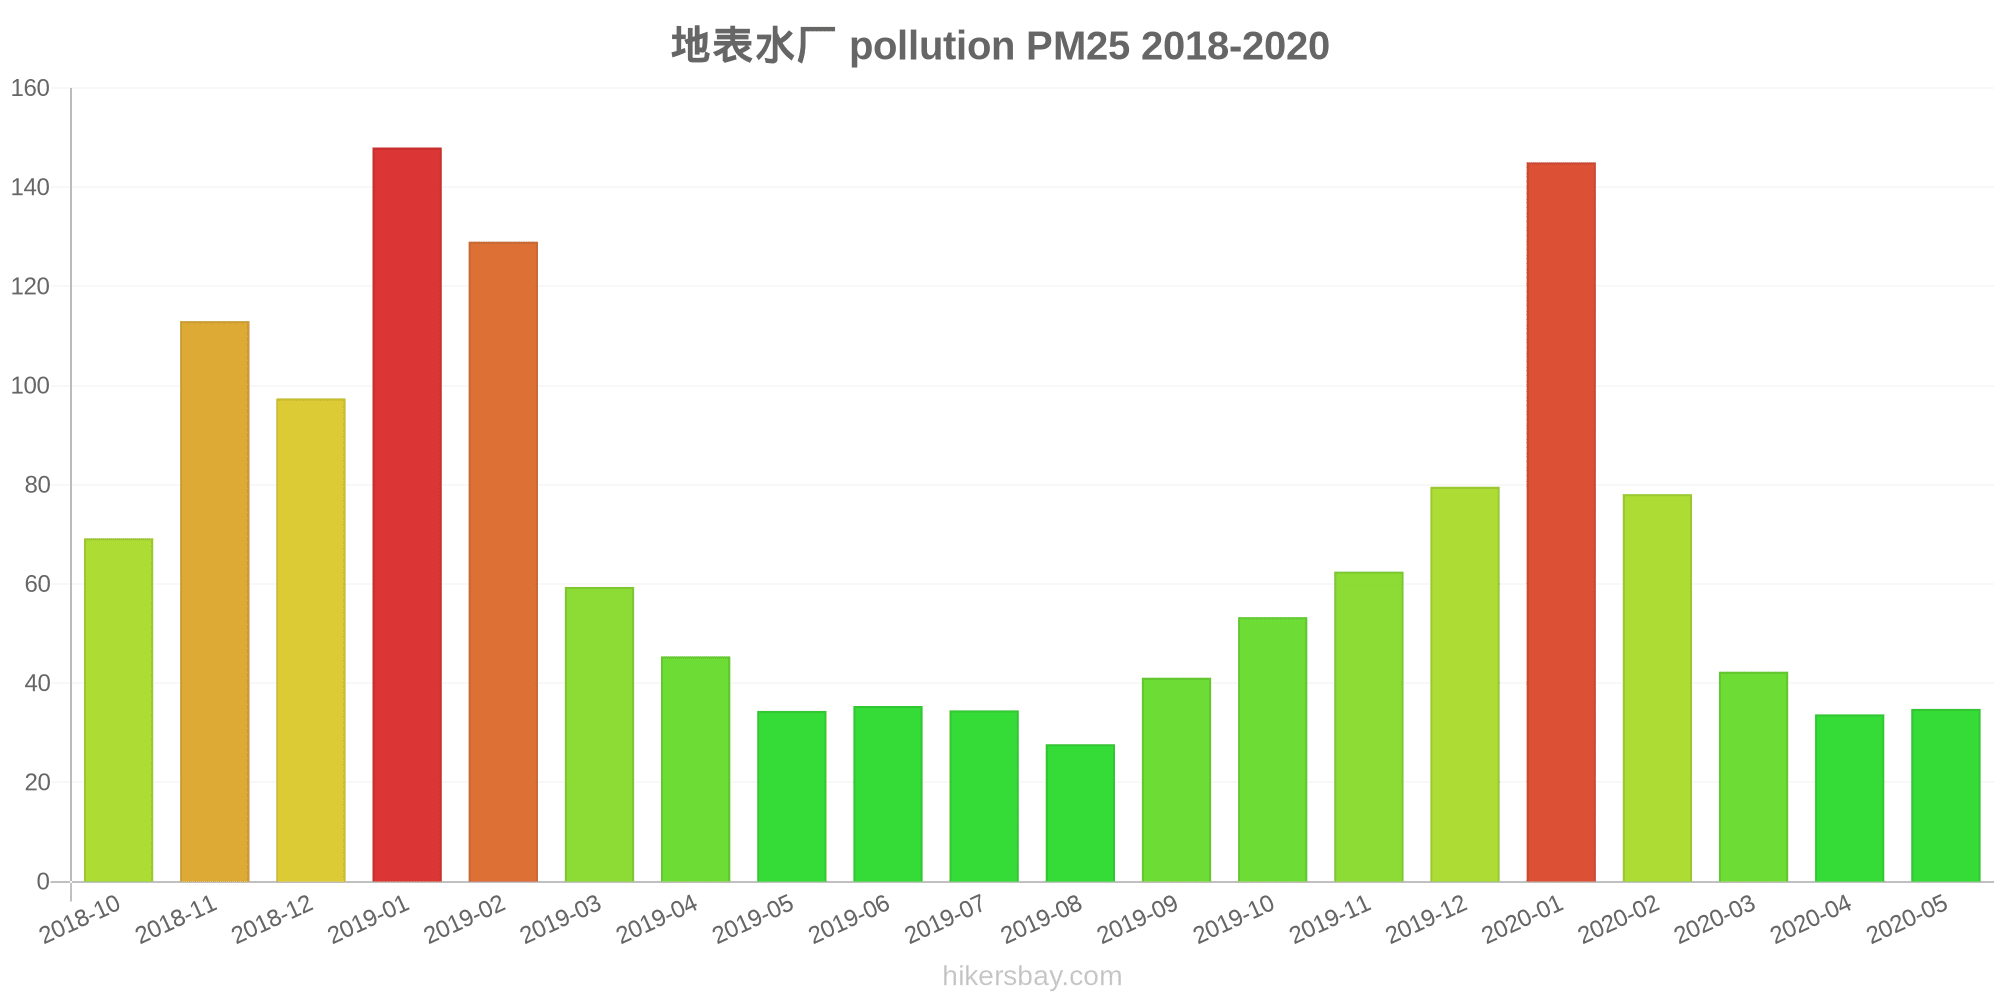
地表水厂
index
2022-05-27
pm10
56
pm25
56
o3
0.03
no2
0
so2
0
地表水厂
2018-10 2020-05
index
2020-05
2020-04
2020-03
2020-02
2020-01
2019-12
2019-11
2019-10
2019-09
2019-08
2019-07
2019-06
2019-05
2019-04
2019-03
2019-02
2019-01
2018-12
2018-11
2018-10
pm25
35
34
42
78
145
80
63
53
41
28
35
35
34
45
59
129
148
97
113
69
co
580
498
470
903
1
1
793
695
541
353
500
503
505
514
657
1
2
1
1
867
no2
24
28
38
28
68
59
53
45
44
31
26
32
35
36
35
45
73
60
66
60
o3
134
130
99
87
60
45
55
99
179
137
193
205
180
129
113
80
43
42
54
93
pm10
80
82
82
102
192
122
121
112
100
68
75
87
103
110
113
194
242
176
192
133
so2
8.4
11
10
10
21
15
13
9.3
9.3
7.7
8.3
11
13
10
15
22
41
31
22
20
* Pollution data source:
https://openaq.org
(ChinaAQIData)
The data is licensed under CC-By 4.0
PM10 179 (Sehr schlecht Gefährlich)
PM2,5 35 (Ungesund für sensible Gruppen)
O3 0 (gut)
NO2 0 (gut)
SO2 0 (gut)
Daten zur Luftverschmutzung der letzten Tage in Nanliugezhuang
| index | 2022-05-27 |
|---|---|
| pm10 | 56 Unhealthy for Sensitive Groups |
| pm25 | 56 Unhealthy |
| o3 | 0 Good |
| no2 | 0 Good |
| so2 | 0 Good |
| index | 2020-05 | 2020-04 | 2020-03 | 2020-02 | 2020-01 | 2019-12 | 2019-11 | 2019-10 | 2019-09 | 2019-08 | 2019-07 | 2019-06 | 2019-05 | 2019-04 | 2019-03 | 2019-02 | 2019-01 | 2018-12 | 2018-11 | 2018-10 |
|---|---|---|---|---|---|---|---|---|---|---|---|---|---|---|---|---|---|---|---|---|
| pm25 | 35 (Moderate) | 34 (Moderate) | 42 (Unhealthy for Sensitive Groups) | 78 (Very Unhealthy) | 145 (Very bad Hazardous) | 80 (Very Unhealthy) | 63 (Unhealthy) | 53 (Unhealthy for Sensitive Groups) | 41 (Unhealthy for Sensitive Groups) | 28 (Moderate) | 35 (Moderate) | 35 (Unhealthy for Sensitive Groups) | 34 (Moderate) | 45 (Unhealthy for Sensitive Groups) | 59 (Unhealthy) | 129 (Very bad Hazardous) | 148 (Very bad Hazardous) | 97 (Very Unhealthy) | 113 (Very bad Hazardous) | 69 (Unhealthy) |
| co | 580 (Good) | 498 (Good) | 470 (Good) | 903 (Good) | 1 (Good) | 1 (Good) | 793 (Good) | 695 (Good) | 541 (Good) | 353 (Good) | 500 (Good) | 503 (Good) | 505 (Good) | 514 (Good) | 657 (Good) | 1 (Good) | 2 (Good) | 1 (Good) | 1 (Good) | 867 (Good) |
| no2 | 24 (Good) | 28 (Good) | 38 (Good) | 28 (Good) | 68 (Moderate) | 59 (Moderate) | 53 (Moderate) | 45 (Moderate) | 44 (Moderate) | 31 (Good) | 26 (Good) | 32 (Good) | 35 (Good) | 36 (Good) | 35 (Good) | 45 (Moderate) | 73 (Moderate) | 60 (Moderate) | 66 (Moderate) | 60 (Moderate) |
| o3 | 134 (Unhealthy for Sensitive Groups) | 130 (Unhealthy for Sensitive Groups) | 99 (Moderate) | 87 (Moderate) | 60 (Good) | 45 (Good) | 55 (Good) | 99 (Moderate) | 179 (Unhealthy) | 137 (Unhealthy for Sensitive Groups) | 193 (Very Unhealthy) | 205 (Very Unhealthy) | 180 (Very Unhealthy) | 129 (Unhealthy for Sensitive Groups) | 113 (Moderate) | 80 (Moderate) | 43 (Good) | 42 (Good) | 54 (Good) | 93 (Moderate) |
| pm10 | 80 (Unhealthy) | 82 (Unhealthy) | 82 (Unhealthy) | 102 (Unhealthy) | 192 (Very bad Hazardous) | 122 (Very Unhealthy) | 121 (Very Unhealthy) | 112 (Very Unhealthy) | 100 (Unhealthy) | 68 (Unhealthy for Sensitive Groups) | 75 (Unhealthy for Sensitive Groups) | 87 (Unhealthy) | 103 (Unhealthy) | 110 (Very Unhealthy) | 113 (Very Unhealthy) | 194 (Very bad Hazardous) | 242 (Very bad Hazardous) | 176 (Very bad Hazardous) | 192 (Very bad Hazardous) | 133 (Very Unhealthy) |
| so2 | 8.4 (Good) | 11 (Good) | 10 (Good) | 10 (Good) | 21 (Good) | 15 (Good) | 13 (Good) | 9.3 (Good) | 9.3 (Good) | 7.7 (Good) | 8.3 (Good) | 11 (Good) | 13 (Good) | 10 (Good) | 15 (Good) | 22 (Good) | 41 (Good) | 31 (Good) | 22 (Good) | 20 (Good) |
PM10 179 (Sehr schlecht Gefährlich)
Feinstaub (PM10) SchwebestaubPM2,5 35 (Ungesund für sensible Gruppen)
Feinstaub (PM2,5)O3 0.04 (gut)
Ozon (O3)NO2 0 (gut)
Stickstoffdioxid (NO2)SO2 0 (gut)
Schwefeldioxid (SO2)地表水厂
| index | 2022-05-27 |
|---|---|
| pm10 | 56 |
| pm25 | 56 |
| o3 | 0.03 |
| no2 | 0 |
| so2 | 0 |
地表水厂
| index | 2020-05 | 2020-04 | 2020-03 | 2020-02 | 2020-01 | 2019-12 | 2019-11 | 2019-10 | 2019-09 | 2019-08 | 2019-07 | 2019-06 | 2019-05 | 2019-04 | 2019-03 | 2019-02 | 2019-01 | 2018-12 | 2018-11 | 2018-10 |
|---|---|---|---|---|---|---|---|---|---|---|---|---|---|---|---|---|---|---|---|---|
| pm25 | 35 | 34 | 42 | 78 | 145 | 80 | 63 | 53 | 41 | 28 | 35 | 35 | 34 | 45 | 59 | 129 | 148 | 97 | 113 | 69 |
| co | 580 | 498 | 470 | 903 | 1 | 1 | 793 | 695 | 541 | 353 | 500 | 503 | 505 | 514 | 657 | 1 | 2 | 1 | 1 | 867 |
| no2 | 24 | 28 | 38 | 28 | 68 | 59 | 53 | 45 | 44 | 31 | 26 | 32 | 35 | 36 | 35 | 45 | 73 | 60 | 66 | 60 |
| o3 | 134 | 130 | 99 | 87 | 60 | 45 | 55 | 99 | 179 | 137 | 193 | 205 | 180 | 129 | 113 | 80 | 43 | 42 | 54 | 93 |
| pm10 | 80 | 82 | 82 | 102 | 192 | 122 | 121 | 112 | 100 | 68 | 75 | 87 | 103 | 110 | 113 | 194 | 242 | 176 | 192 | 133 |
| so2 | 8.4 | 11 | 10 | 10 | 21 | 15 | 13 | 9.3 | 9.3 | 7.7 | 8.3 | 11 | 13 | 10 | 15 | 22 | 41 | 31 | 22 | 20 |