Luftverschmutzung in Changling: Echtzeit-Luft-Qualitätsindex und Smog-Alarm.
Für die Changling. Heute ist Donnerstag, 4. Juni 2026. Für Changling wurden folgende Luftverschmutzungswerte gemessen:- Feinstaub (PM10) Schwebestaub - 7 (gut)
- Feinstaub (PM2,5) - 2 (gut)
- Kohlenmonoxid (CO) - 100 (gut)
- Stickstoffdioxid (NO2) - 8 (gut)
- Ozon (O3) - 0 (gut)
- Schwefeldioxid (SO2) - 9 (gut)

Wie ist die Luftqualität Changling heute? Ist die Luft in Changling? verschmutzt. Gibt es Smog?
Wie hoch ist der PM10-Stand heute in Changling? (Feinstaub (PM10) Schwebestaub)
Der aktuelle Feinstaubgehalt PM10 in Changling is:
7 (gut)
Die höchsten PM10-Werte treten in der Regel im Monat auf: 89 (Dezember 2019).
Der niedrigste Wert der Feinstaub-PM10-Belastung in Changling ist in der Regel in: Juni (34).
Wie hoch ist der aktuelle PM2,5-Wert in Changling? (Feinstaub (PM2,5))
Die heutige PM2.5-Stufe ist:
2 (gut)
Zum Vergleich: Der höchste PM2,5-Wert in Changling in den letzten 7 Tagen war: 24 (Freitag, 27. Mai 2022) und der niedrigste: 24 (Freitag, 27. Mai 2022).
Die höchsten PM2,5-Werte wurden gemessen: 58 (Januar 2019).
Die niedrigste Feinstaubbelastung PM2,5 tritt im Monat auf: Juli (19).
Wie hoch ist der CO-Gehalt? (Kohlenmonoxid (CO))
100 (gut)
Wie hoch ist das NO2-Niveau? (Stickstoffdioxid (NO2))
8 (gut)
Wie ist das O3-Niveau heute in Changling? (Ozon (O3))
0 (gut)
Wie hoch ist die SO2-Belastung? (Schwefeldioxid (SO2))
9 (gut)
Aktuelle Daten Freitag, 27. Mai 2022, 12:00
PM10 7 (gut)
PM2,5 2 (gut)
CO 100 (gut)
NO2 8 (gut)
O3 0 (gut)
SO2 9 (gut)
Daten zur Luftverschmutzung der letzten Tage in Changling
index
2022-05-27
pm10
32
Moderate
pm25
24
Moderate
co
468
Good
no2
21
Good
o3
32
Good
so2
5
Good
data source »
Luftverschmutzung in Changling von Oktober 2018 bis Mai 2020

index
2020-05
2020-04
2020-03
2020-02
2020-01
2019-12
2019-11
2019-10
2019-09
2019-08
2019-07
2019-06
2019-05
2019-04
2019-03
2019-02
2019-01
2018-12
2018-11
2018-10
pm25
24 (Moderate)
32 (Moderate)
25 (Moderate)
43 (Unhealthy for Sensitive Groups)
50 (Unhealthy for Sensitive Groups)
55 (Unhealthy)
46 (Unhealthy for Sensitive Groups)
31 (Moderate)
35 (Moderate)
25 (Moderate)
19 (Moderate)
19 (Moderate)
28 (Moderate)
32 (Moderate)
39 (Unhealthy for Sensitive Groups)
35 (Moderate)
58 (Unhealthy)
40 (Unhealthy for Sensitive Groups)
40 (Unhealthy for Sensitive Groups)
28 (Moderate)
co
692 (Good)
802 (Good)
829 (Good)
877 (Good)
1 (Good)
1 (Good)
894 (Good)
835 (Good)
868 (Good)
800 (Good)
764 (Good)
748 (Good)
778 (Good)
802 (Good)
939 (Good)
968 (Good)
1 (Good)
1 (Good)
951 (Good)
834 (Good)
no2
12 (Good)
21 (Good)
18 (Good)
19 (Good)
26 (Good)
38 (Good)
28 (Good)
17 (Good)
21 (Good)
14 (Good)
13 (Good)
14 (Good)
18 (Good)
19 (Good)
25 (Good)
18 (Good)
29 (Good)
27 (Good)
29 (Good)
25 (Good)
o3
113 (Moderate)
101 (Moderate)
67 (Good)
76 (Moderate)
76 (Moderate)
95 (Moderate)
131 (Unhealthy for Sensitive Groups)
118 (Moderate)
170 (Unhealthy)
125 (Unhealthy for Sensitive Groups)
106 (Moderate)
112 (Moderate)
108 (Moderate)
87 (Moderate)
65 (Good)
46 (Good)
61 (Good)
46 (Good)
90 (Moderate)
80 (Moderate)
pm10
49 (Moderate)
56 (Unhealthy for Sensitive Groups)
41 (Moderate)
56 (Unhealthy for Sensitive Groups)
70 (Unhealthy for Sensitive Groups)
89 (Unhealthy)
82 (Unhealthy)
56 (Unhealthy for Sensitive Groups)
67 (Unhealthy for Sensitive Groups)
47 (Moderate)
35 (Moderate)
34 (Moderate)
55 (Unhealthy for Sensitive Groups)
56 (Unhealthy for Sensitive Groups)
58 (Unhealthy for Sensitive Groups)
51 (Unhealthy for Sensitive Groups)
82 (Unhealthy)
64 (Unhealthy for Sensitive Groups)
65 (Unhealthy for Sensitive Groups)
54 (Unhealthy for Sensitive Groups)
so2
15 (Good)
11 (Good)
9.4 (Good)
7.6 (Good)
12 (Good)
16 (Good)
15 (Good)
12 (Good)
13 (Good)
11 (Good)
15 (Good)
11 (Good)
12 (Good)
13 (Good)
11 (Good)
6.6 (Good)
10 (Good)
13 (Good)
12 (Good)
10 (Good)
data source »
来宾二中
Freitag, 27. Mai 2022, 12:00
PM10 6.7 (gut)
Feinstaub (PM10) Schwebestaub
PM2,5 1.7 (gut)
Feinstaub (PM2,5)
CO 100 (gut)
Kohlenmonoxid (CO)
NO2 7.6 (gut)
Stickstoffdioxid (NO2)
O3 0.02 (gut)
Ozon (O3)
SO2 8.6 (gut)
Schwefeldioxid (SO2)
来宾二中
index
2022-05-27
pm10
32
pm25
24
co
468
no2
21
o3
32
so2
4.6
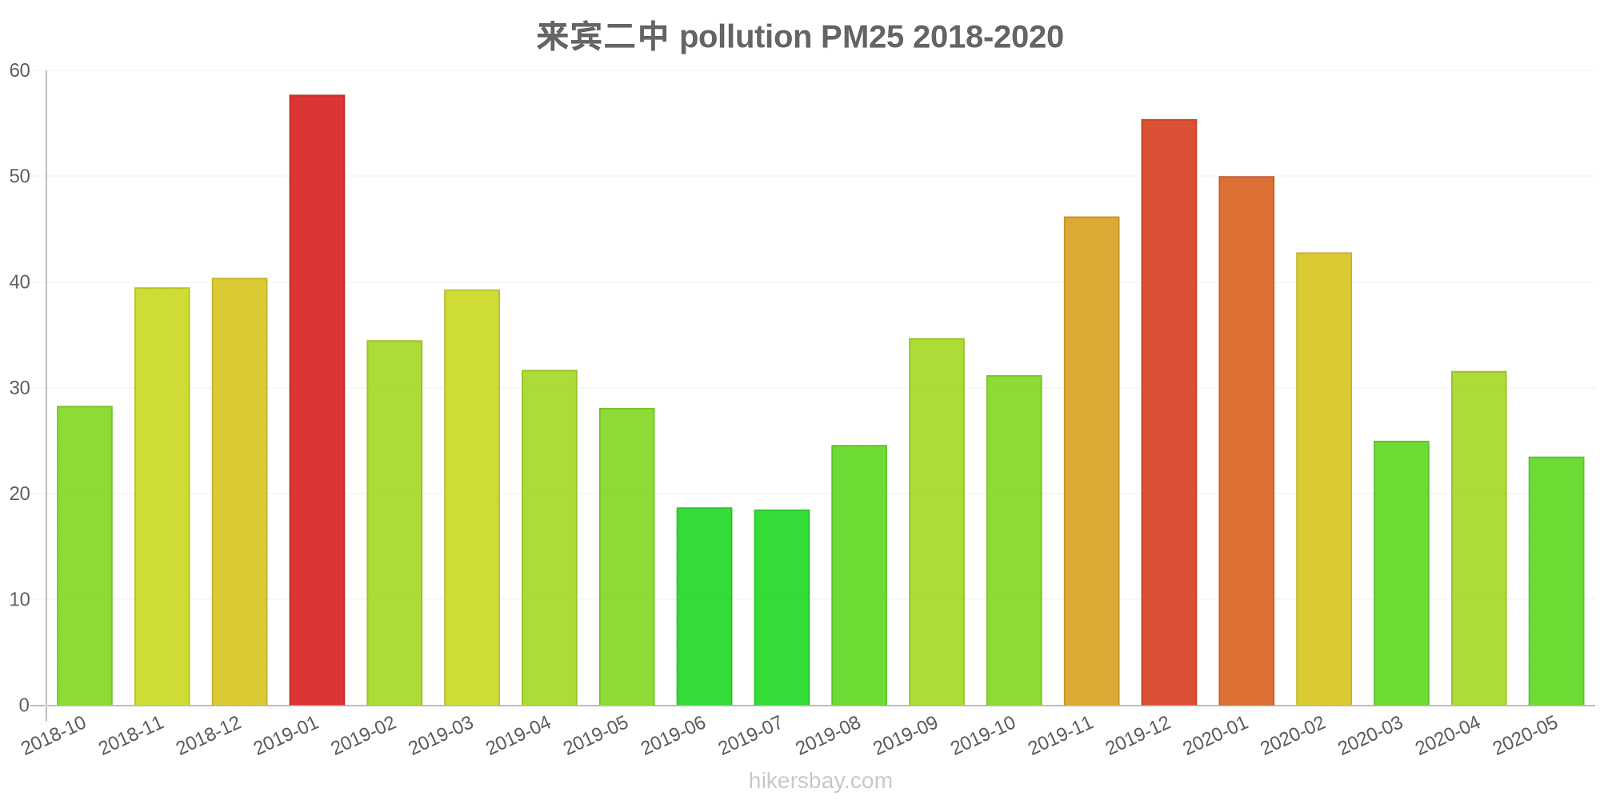
来宾二中
2018-10 2020-05
index
2020-05
2020-04
2020-03
2020-02
2020-01
2019-12
2019-11
2019-10
2019-09
2019-08
2019-07
2019-06
2019-05
2019-04
2019-03
2019-02
2019-01
2018-12
2018-11
2018-10
pm25
24
32
25
43
50
55
46
31
35
25
19
19
28
32
39
35
58
40
40
28
co
692
802
829
877
1
1
894
835
868
800
764
748
778
802
939
968
1
1
951
834
no2
12
21
18
19
26
38
28
17
21
14
13
14
18
19
25
18
29
27
29
25
o3
113
101
67
76
76
95
131
118
170
125
106
112
108
87
65
46
61
46
90
80
pm10
49
56
41
56
70
89
82
56
67
47
35
34
55
56
58
51
82
64
65
54
so2
15
11
9.4
7.6
12
16
15
12
13
11
15
11
12
13
11
6.6
10
13
12
10
* Pollution data source:
https://openaq.org
(ChinaAQIData)
The data is licensed under CC-By 4.0
PM10 7 (gut)
PM2,5 2 (gut)
CO 100 (gut)
NO2 8 (gut)
O3 0 (gut)
SO2 9 (gut)
Daten zur Luftverschmutzung der letzten Tage in Changling
| index | 2022-05-27 |
|---|---|
| pm10 | 32 Moderate |
| pm25 | 24 Moderate |
| co | 468 Good |
| no2 | 21 Good |
| o3 | 32 Good |
| so2 | 5 Good |

| index | 2020-05 | 2020-04 | 2020-03 | 2020-02 | 2020-01 | 2019-12 | 2019-11 | 2019-10 | 2019-09 | 2019-08 | 2019-07 | 2019-06 | 2019-05 | 2019-04 | 2019-03 | 2019-02 | 2019-01 | 2018-12 | 2018-11 | 2018-10 |
|---|---|---|---|---|---|---|---|---|---|---|---|---|---|---|---|---|---|---|---|---|
| pm25 | 24 (Moderate) | 32 (Moderate) | 25 (Moderate) | 43 (Unhealthy for Sensitive Groups) | 50 (Unhealthy for Sensitive Groups) | 55 (Unhealthy) | 46 (Unhealthy for Sensitive Groups) | 31 (Moderate) | 35 (Moderate) | 25 (Moderate) | 19 (Moderate) | 19 (Moderate) | 28 (Moderate) | 32 (Moderate) | 39 (Unhealthy for Sensitive Groups) | 35 (Moderate) | 58 (Unhealthy) | 40 (Unhealthy for Sensitive Groups) | 40 (Unhealthy for Sensitive Groups) | 28 (Moderate) |
| co | 692 (Good) | 802 (Good) | 829 (Good) | 877 (Good) | 1 (Good) | 1 (Good) | 894 (Good) | 835 (Good) | 868 (Good) | 800 (Good) | 764 (Good) | 748 (Good) | 778 (Good) | 802 (Good) | 939 (Good) | 968 (Good) | 1 (Good) | 1 (Good) | 951 (Good) | 834 (Good) |
| no2 | 12 (Good) | 21 (Good) | 18 (Good) | 19 (Good) | 26 (Good) | 38 (Good) | 28 (Good) | 17 (Good) | 21 (Good) | 14 (Good) | 13 (Good) | 14 (Good) | 18 (Good) | 19 (Good) | 25 (Good) | 18 (Good) | 29 (Good) | 27 (Good) | 29 (Good) | 25 (Good) |
| o3 | 113 (Moderate) | 101 (Moderate) | 67 (Good) | 76 (Moderate) | 76 (Moderate) | 95 (Moderate) | 131 (Unhealthy for Sensitive Groups) | 118 (Moderate) | 170 (Unhealthy) | 125 (Unhealthy for Sensitive Groups) | 106 (Moderate) | 112 (Moderate) | 108 (Moderate) | 87 (Moderate) | 65 (Good) | 46 (Good) | 61 (Good) | 46 (Good) | 90 (Moderate) | 80 (Moderate) |
| pm10 | 49 (Moderate) | 56 (Unhealthy for Sensitive Groups) | 41 (Moderate) | 56 (Unhealthy for Sensitive Groups) | 70 (Unhealthy for Sensitive Groups) | 89 (Unhealthy) | 82 (Unhealthy) | 56 (Unhealthy for Sensitive Groups) | 67 (Unhealthy for Sensitive Groups) | 47 (Moderate) | 35 (Moderate) | 34 (Moderate) | 55 (Unhealthy for Sensitive Groups) | 56 (Unhealthy for Sensitive Groups) | 58 (Unhealthy for Sensitive Groups) | 51 (Unhealthy for Sensitive Groups) | 82 (Unhealthy) | 64 (Unhealthy for Sensitive Groups) | 65 (Unhealthy for Sensitive Groups) | 54 (Unhealthy for Sensitive Groups) |
| so2 | 15 (Good) | 11 (Good) | 9.4 (Good) | 7.6 (Good) | 12 (Good) | 16 (Good) | 15 (Good) | 12 (Good) | 13 (Good) | 11 (Good) | 15 (Good) | 11 (Good) | 12 (Good) | 13 (Good) | 11 (Good) | 6.6 (Good) | 10 (Good) | 13 (Good) | 12 (Good) | 10 (Good) |
PM10 6.7 (gut)
Feinstaub (PM10) SchwebestaubPM2,5 1.7 (gut)
Feinstaub (PM2,5)CO 100 (gut)
Kohlenmonoxid (CO)NO2 7.6 (gut)
Stickstoffdioxid (NO2)O3 0.02 (gut)
Ozon (O3)SO2 8.6 (gut)
Schwefeldioxid (SO2)来宾二中
| index | 2022-05-27 |
|---|---|
| pm10 | 32 |
| pm25 | 24 |
| co | 468 |
| no2 | 21 |
| o3 | 32 |
| so2 | 4.6 |
来宾二中

| index | 2020-05 | 2020-04 | 2020-03 | 2020-02 | 2020-01 | 2019-12 | 2019-11 | 2019-10 | 2019-09 | 2019-08 | 2019-07 | 2019-06 | 2019-05 | 2019-04 | 2019-03 | 2019-02 | 2019-01 | 2018-12 | 2018-11 | 2018-10 |
|---|---|---|---|---|---|---|---|---|---|---|---|---|---|---|---|---|---|---|---|---|
| pm25 | 24 | 32 | 25 | 43 | 50 | 55 | 46 | 31 | 35 | 25 | 19 | 19 | 28 | 32 | 39 | 35 | 58 | 40 | 40 | 28 |
| co | 692 | 802 | 829 | 877 | 1 | 1 | 894 | 835 | 868 | 800 | 764 | 748 | 778 | 802 | 939 | 968 | 1 | 1 | 951 | 834 |
| no2 | 12 | 21 | 18 | 19 | 26 | 38 | 28 | 17 | 21 | 14 | 13 | 14 | 18 | 19 | 25 | 18 | 29 | 27 | 29 | 25 |
| o3 | 113 | 101 | 67 | 76 | 76 | 95 | 131 | 118 | 170 | 125 | 106 | 112 | 108 | 87 | 65 | 46 | 61 | 46 | 90 | 80 |
| pm10 | 49 | 56 | 41 | 56 | 70 | 89 | 82 | 56 | 67 | 47 | 35 | 34 | 55 | 56 | 58 | 51 | 82 | 64 | 65 | 54 |
| so2 | 15 | 11 | 9.4 | 7.6 | 12 | 16 | 15 | 12 | 13 | 11 | 15 | 11 | 12 | 13 | 11 | 6.6 | 10 | 13 | 12 | 10 |