Luftverschmutzung in Arrondissement of Montpellier: Echtzeit-Luft-Qualitätsindex und Smog-Alarm.
Für die Arrondissement of Montpellier. Heute ist Samstag, 13. Juni 2026. Für Arrondissement of Montpellier wurden folgende Luftverschmutzungswerte gemessen:- Stickstoffdioxid (NO2) - 16 (gut)
- Ozon (O3) - 28 (gut)
- Feinstaub (PM10) Schwebestaub - 14 (gut)
- Feinstaub (PM2,5) - 11 (gut)

Wie ist die Luftqualität Arrondissement of Montpellier heute? Ist die Luft in Arrondissement of Montpellier? verschmutzt. Gibt es Smog?
Wie hoch ist das NO2-Niveau? (Stickstoffdioxid (NO2))
16 (gut)
Wie ist das O3-Niveau heute in Arrondissement of Montpellier? (Ozon (O3))
28 (gut)
Wie hoch ist der PM10-Stand heute in Arrondissement of Montpellier? (Feinstaub (PM10) Schwebestaub)
Der aktuelle Feinstaubgehalt PM10 in Arrondissement of Montpellier is:
14 (gut)
Die höchsten PM10-Werte treten in der Regel im Monat auf: 23 (August 2018).
Der niedrigste Wert der Feinstaub-PM10-Belastung in Arrondissement of Montpellier ist in der Regel in: März (10).
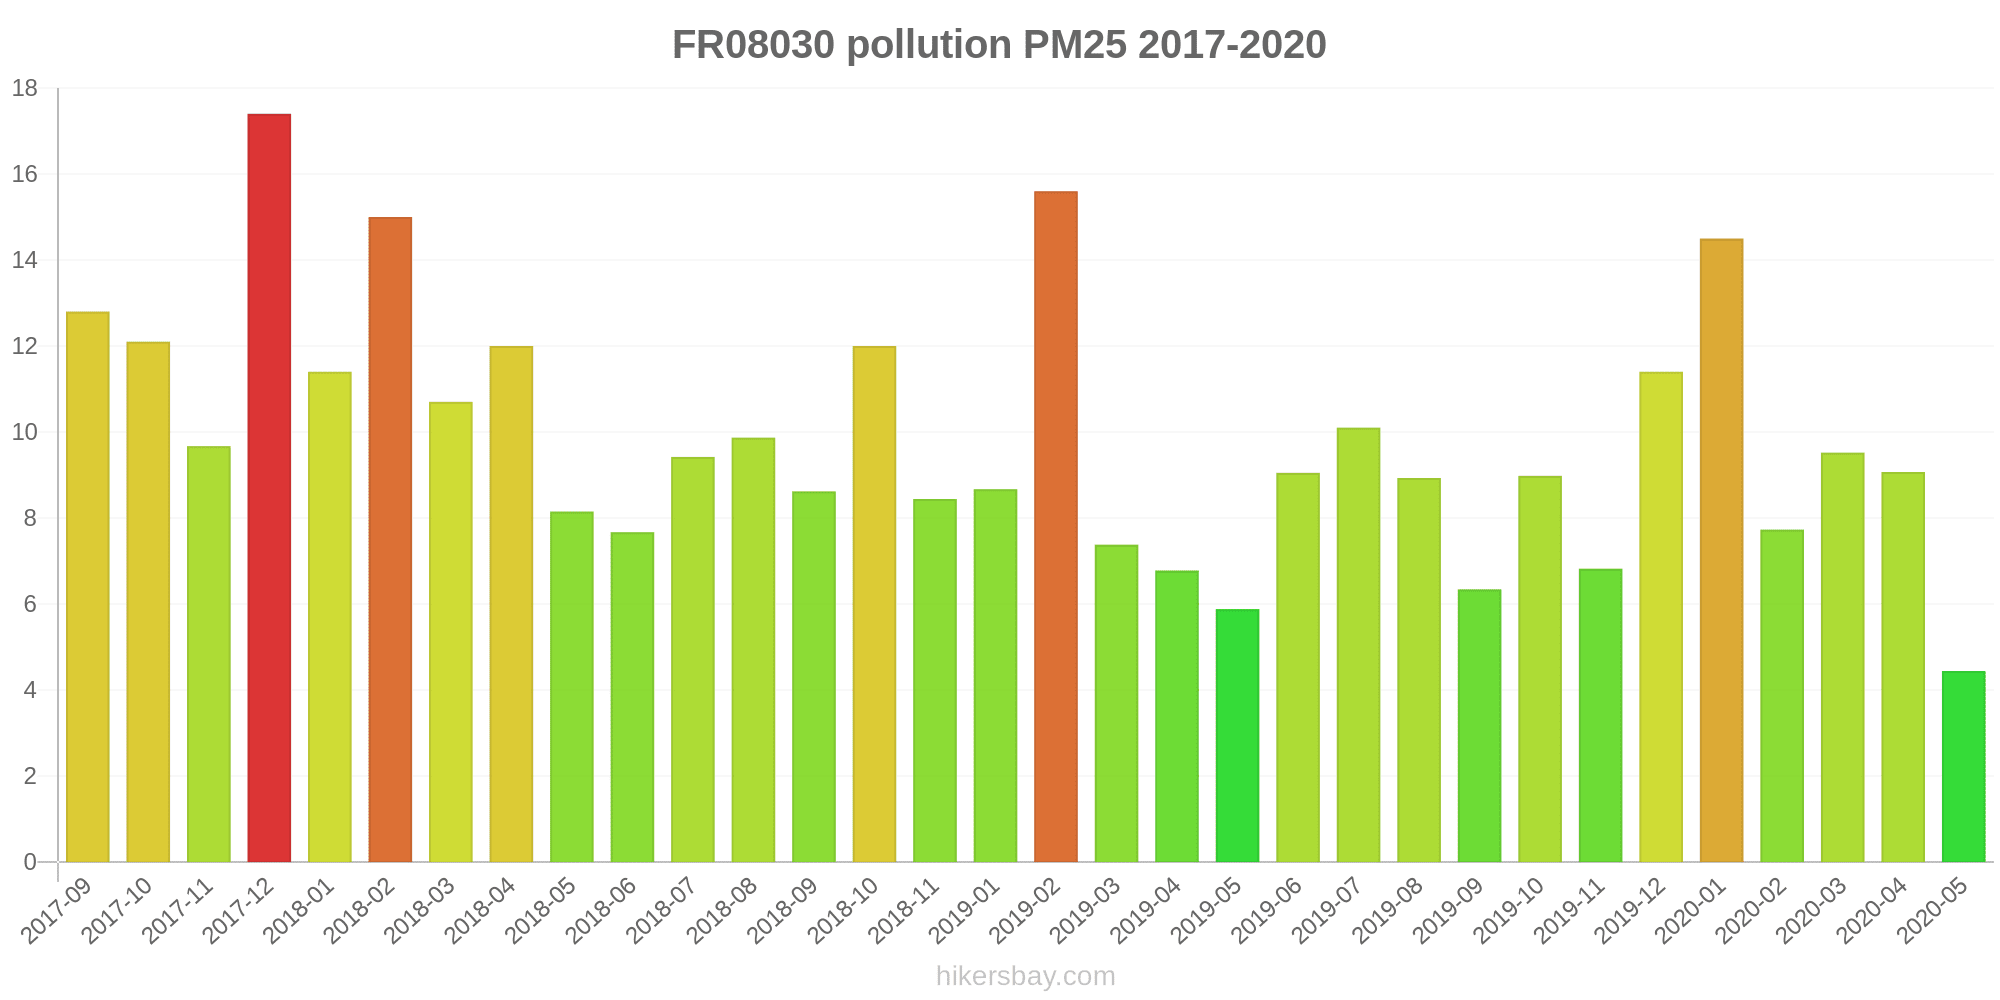
Wie hoch ist der aktuelle PM2,5-Wert in Arrondissement of Montpellier? (Feinstaub (PM2,5))
Die heutige PM2.5-Stufe ist:
11 (gut)
Zum Vergleich: Der höchste PM2,5-Wert in Arrondissement of Montpellier in den letzten 7 Tagen war: 37 (Sonntag, 14. Januar 2024) und der niedrigste: 10 (Donnerstag, 11. Januar 2024).
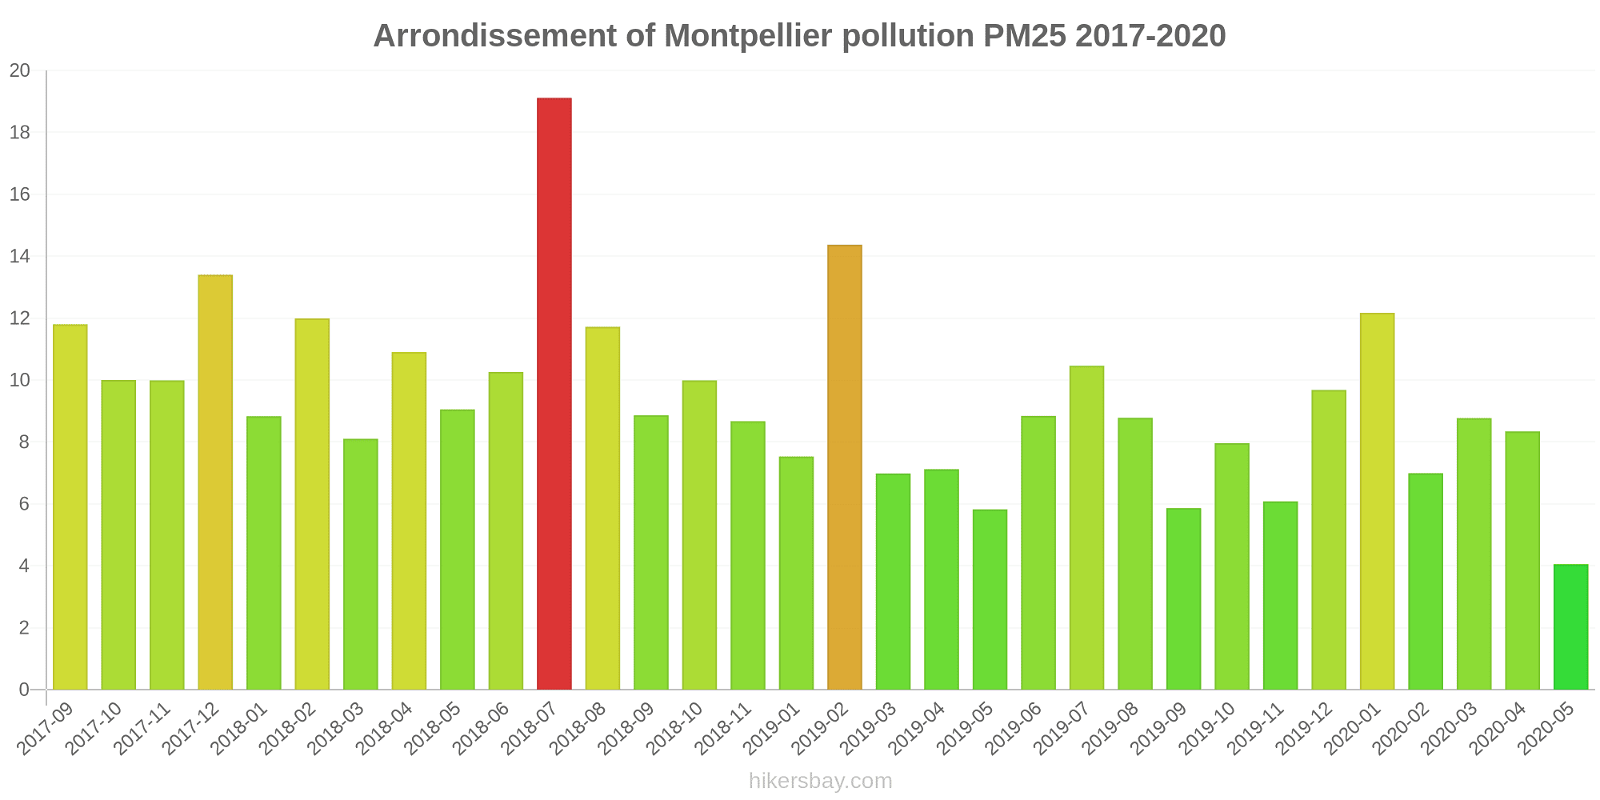
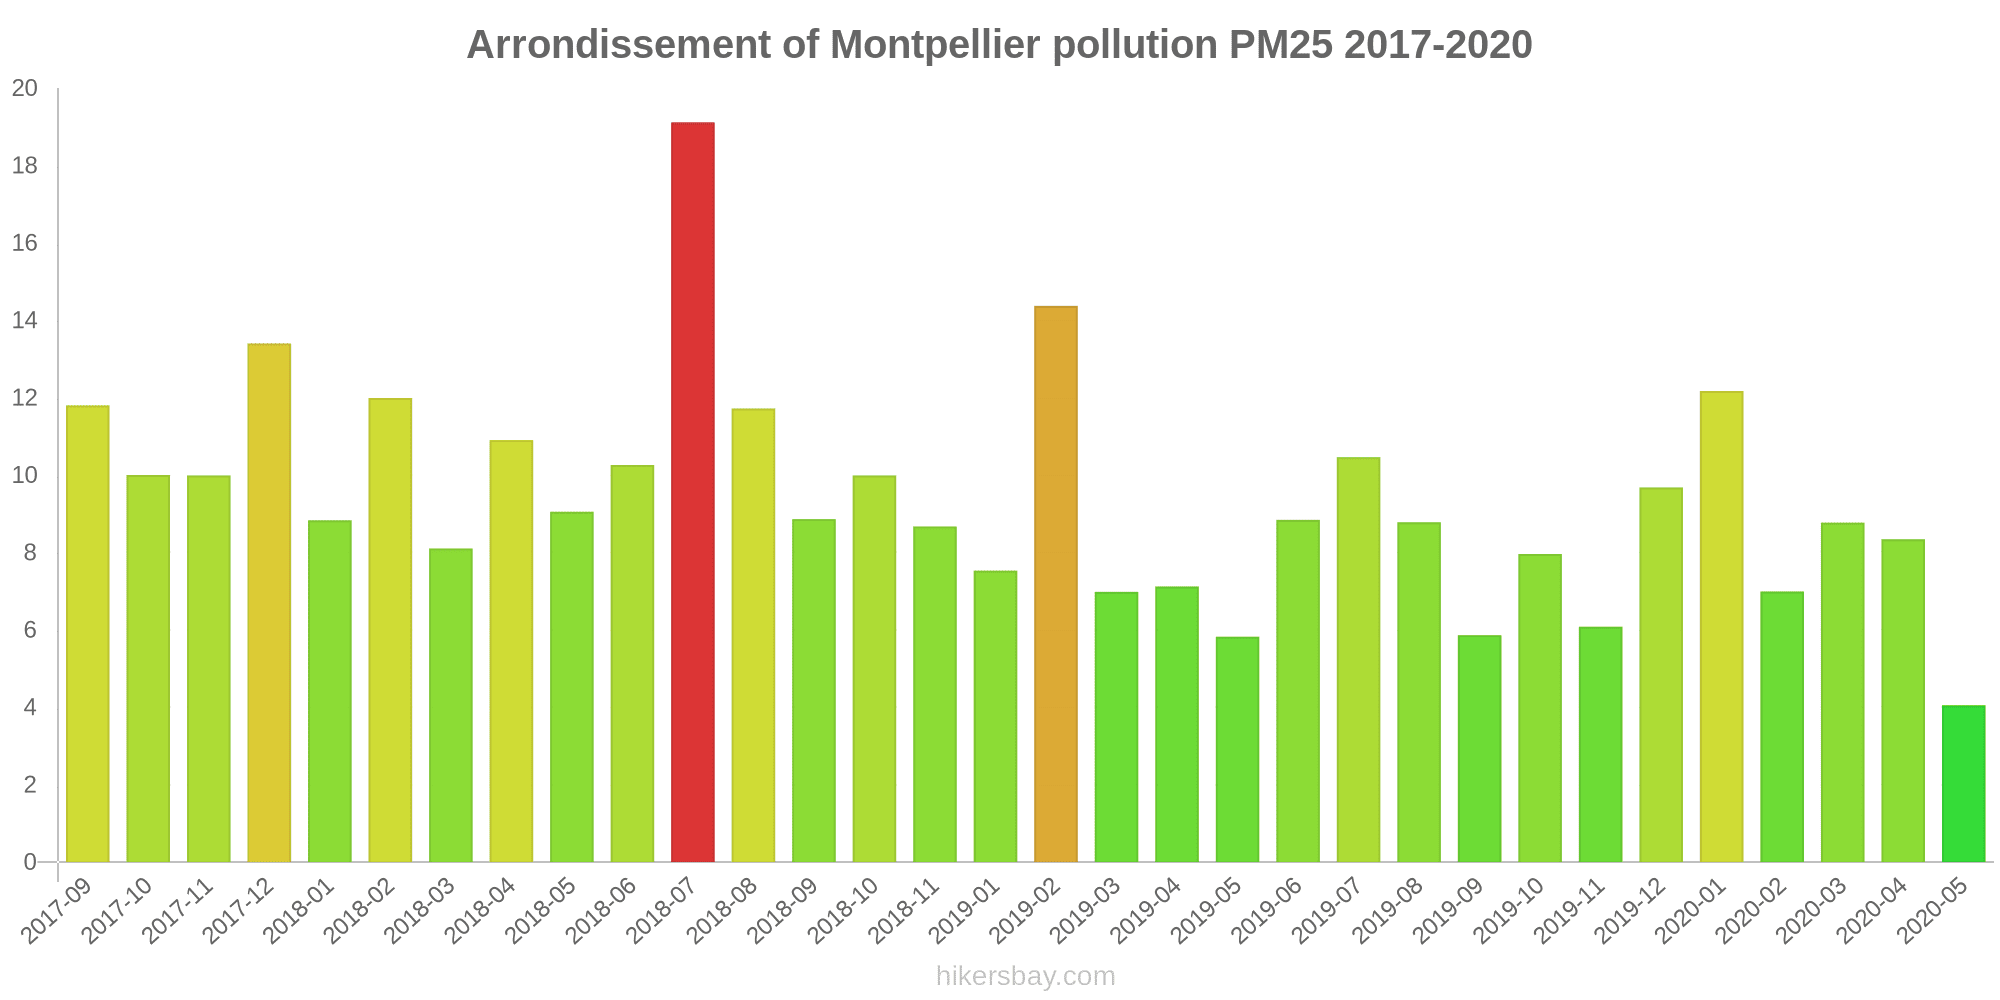
Die höchsten PM2,5-Werte wurden gemessen: 19 (Juli 2018).
Die niedrigste Feinstaubbelastung PM2,5 tritt im Monat auf: Mai (4).
Aktuelle Daten Mittwoch, 17. Januar 2024, 09:00
NO2 16 (gut)
5 (gut)
O3 28 (gut)
PM10 14 (gut)
PM2,5 11 (gut)
Daten zur Luftverschmutzung der letzten Tage in Arrondissement of Montpellier
index
2024-01-10
2024-01-11
2024-01-12
2024-01-13
2024-01-14
2024-01-15
2024-01-16
2024-01-17
no
6
Good
4
Good
14
Good
10
Good
16
Good
9
Good
8
Good
4
Good
no2
21
Good
14
Good
21
Good
24
Good
25
Good
19
Good
24
Good
15
Good
pm10
22
Moderate
11
Good
25
Moderate
34
Moderate
41
Moderate
20
Moderate
22
Moderate
26
Moderate
pm25
19
Moderate
10
Good
21
Moderate
30
Moderate
37
Unhealthy for Sensitive Groups
13
Moderate
15
Moderate
22
Moderate
o3
19
Good
30
Good
20
Good
22
Good
9
Good
46
Good
23
Good
24
Good
data source »
Luftverschmutzung in Arrondissement of Montpellier von Februar 2020 bis Mai 2020
index
2020-05
2020-04
2020-03
2020-01
2019-12
2019-11
2019-10
2019-09
2019-08
2019-07
2019-06
2019-05
2019-04
2019-03
2019-02
2019-01
2018-11
2018-10
2018-09
2018-08
2018-07
2018-06
2018-05
2018-04
2018-03
2018-02
2018-01
2017-12
2017-11
2017-10
2017-09
2020-02
no2
9.3 (Good)
10 (Good)
16 (Good)
30 (Good)
28 (Good)
27 (Good)
23 (Good)
24 (Good)
21 (Good)
22 (Good)
22 (Good)
17 (Good)
22 (Good)
23 (Good)
35 (Good)
26 (Good)
29 (Good)
26 (Good)
28 (Good)
24 (Good)
24 (Good)
21 (Good)
19 (Good)
26 (Good)
24 (Good)
25 (Good)
24 (Good)
36 (Good)
28 (Good)
29 (Good)
37 (Good)
27 (Good)
pm25
4 (Good)
8.3 (Good)
8.8 (Good)
12 (Good)
9.7 (Good)
6.1 (Good)
8 (Good)
5.9 (Good)
8.8 (Good)
10 (Good)
8.8 (Good)
5.8 (Good)
7.1 (Good)
7 (Good)
14 (Moderate)
7.5 (Good)
8.7 (Good)
10 (Good)
8.9 (Good)
12 (Good)
19 (Moderate)
10 (Good)
9.1 (Good)
11 (Good)
8.1 (Good)
12 (Good)
8.8 (Good)
13 (Moderate)
10 (Good)
10 (Good)
12 (Good)
7 (Good)
pm10
12 (Good)
16 (Good)
16 (Good)
20 (Moderate)
19 (Good)
13 (Good)
19 (Good)
15 (Good)
17 (Good)
19 (Good)
16 (Good)
11 (Good)
15 (Good)
16 (Good)
23 (Moderate)
12 (Good)
19 (Good)
19 (Good)
19 (Good)
23 (Moderate)
18 (Good)
19 (Good)
19 (Good)
20 (Moderate)
10 (Good)
23 (Moderate)
14 (Good)
18 (Good)
13 (Good)
17 (Good)
18 (Good)
16 (Good)
o3
69 (Good)
75 (Moderate)
66 (Good)
39 (Good)
42 (Good)
40 (Good)
49 (Good)
63 (Good)
75 (Moderate)
78 (Moderate)
78 (Moderate)
79 (Moderate)
81 (Moderate)
69 (Good)
45 (Good)
45 (Good)
38 (Good)
50 (Good)
71 (Moderate)
88 (Moderate)
80 (Moderate)
70 (Good)
74 (Moderate)
73 (Moderate)
66 (Good)
48 (Good)
46 (Good)
30 (Good)
40 (Good)
51 (Good)
57 (Good)
52 (Good)
data source »
Lebensqualität in Arrondissement of Montpellier
Grün und Parks in der Stadt
Arrondissement of Montpellier
56 %
Andorra: 69 %
Schweiz: 76 %
Luxemburg: 83 %
Belgien: 64 %
Liechtenstein: 88 %
Feinstaub PM2,5
Arrondissement of Montpellier
10 (Good)
Vergnügen, Zeit in der Stadt zu verbringen
Arrondissement of Montpellier
73 %
Andorra: 84 %
Schweiz: 84 %
Luxemburg: 85 %
Belgien: 64 %
Liechtenstein: 94 %
Feinstaub PM10
Arrondissement of Montpellier
18 (Good)
Luftverschmutzung
Arrondissement of Montpellier
30 %
Andorra: 29 %
Schweiz: 20 %
Luxemburg: 19 %
Belgien: 45 %
Liechtenstein: 6,3 %
Müllentsorgung
Arrondissement of Montpellier
48 %
Andorra: 89 %
Schweiz: 82 %
Luxemburg: 84 %
Belgien: 54 %
Liechtenstein: 100 %
Verfügbarkeit und Qualität von Trinkwasser
Arrondissement of Montpellier
55 %
Andorra: 100 %
Schweiz: 90 %
Luxemburg: 83 %
Belgien: 70 %
Liechtenstein: 100 %
Sauberkeit und Ordentlichkeit
Arrondissement of Montpellier
35 %
Andorra: 75 %
Schweiz: 82 %
Luxemburg: 82 %
Belgien: 46 %
Liechtenstein: 94 %
Lärm und Lichtverschmutzung
Arrondissement of Montpellier
48 %
Andorra: 29 %
Schweiz: 38 %
Luxemburg: 29 %
Belgien: 54 %
Liechtenstein: 19 %
Wasserverschmutzung
Arrondissement of Montpellier
33 %
Andorra: 19 %
Schweiz: 19 %
Luxemburg: 19 %
Belgien: 42 %
Liechtenstein: 0 %
Source: Numbeo
Chaptal
Mittwoch, 17. Januar 2024, 09:00
NO2 17 (gut)
Stickstoffdioxid (NO2)
6 (gut)
index_name_no
FR08004
Mittwoch, 17. Januar 2024, 09:00
NO2 16 (gut)
Stickstoffdioxid (NO2)
Prés Arènes
Mittwoch, 17. Januar 2024, 09:00
NO2 18 (gut)
Stickstoffdioxid (NO2)
O3 25 (gut)
Ozon (O3)
PM10 16 (gut)
Feinstaub (PM10) Schwebestaub
PM2,5 11 (gut)
Feinstaub (PM2,5)
3.7 (gut)
index_name_no
FR08017
Mittwoch, 17. Januar 2024, 09:00
O3 31 (gut)
Ozon (O3)
FR08020
Mittwoch, 17. Januar 2024, 09:00
PM2,5 9.9 (gut)
Feinstaub (PM2,5)
NO2 12 (gut)
Stickstoffdioxid (NO2)
5.7 (gut)
index_name_no
PM10 11 (gut)
Feinstaub (PM10) Schwebestaub
FR08030
Mittwoch, 17. Januar 2024, 09:00
PM10 15 (gut)
Feinstaub (PM10) Schwebestaub
PM2,5 11 (gut)
Feinstaub (PM2,5)
Chaptal
index
2024-01-17
2024-01-16
2024-01-15
2024-01-14
2024-01-13
2024-01-12
2024-01-11
2024-01-10
no
4
7.8
4.1
13
13
18
3.3
5.7
no2
15
25
19
25
26
23
16
24
FR08004
index
2024-01-17
2024-01-16
2024-01-15
2024-01-14
2024-01-13
2024-01-12
2024-01-11
2024-01-10
no2
15
27
23
30
27
24
15
24
Prés Arènes
index
2024-01-17
2024-01-16
2024-01-15
2024-01-14
2024-01-13
2024-01-12
2024-01-11
2024-01-10
no2
17
28
16
30
27
25
16
25
no
2.6
6.1
2.2
26
7.7
14
3.7
5.8
pm10
28
21
11
45
35
26
11
23
pm25
24
15
7.2
41
32
22
10
20
o3
23
19
43
7.4
20
18
27
17
FR08017
index
2024-01-17
2024-01-16
2024-01-15
2024-01-14
2024-01-13
2024-01-12
2024-01-11
2024-01-10
o3
26
26
48
11
24
22
32
20
FR08020
index
2024-01-17
2024-01-16
2024-01-15
2024-01-14
2024-01-13
2024-01-12
2024-01-11
2024-01-10
no2
12
15
19
14
15
13
9.2
12
pm25
23
16
19
34
29
21
11
19
no
4.9
8.7
20
9.3
8.5
9
4.6
5.3
pm10
25
20
26
37
32
23
12
21
FR08030
index
2024-01-17
2024-01-16
2024-01-15
2024-01-14
2024-01-13
2024-01-12
2024-01-11
2024-01-10
pm25
20
15
12
35
28
19
9.5
18
pm10
25
26
22
42
35
27
10
21
FR08003
index
2020-05
2020-04
2020-03
2020-01
2019-12
2019-11
2019-10
2019-09
2019-08
2019-07
2019-06
2019-05
2019-04
2019-03
2019-02
2019-01
2018-11
2018-10
2018-09
2018-08
2018-07
2018-06
2018-05
2018-04
2018-03
2018-02
2018-01
2017-12
2017-11
2017-10
2017-09
no2
7.1
10
13
30
27
28
25
28
25
27
26
17
22
22
34
27
31
28
30
24
23
20
18
25
24
25
27
38
35
32
38
FR08004
index
2020-05
2020-04
2020-03
2020-02
2020-01
2019-12
2019-11
2019-10
2019-09
2019-08
2019-07
2019-06
2019-05
2019-04
2019-03
2019-02
2019-01
2018-11
2018-10
2018-09
2018-08
2018-07
2018-06
2018-05
2018-04
2018-03
2018-02
2018-01
2017-12
2017-11
2017-10
2017-09
no2
20
17
25
39
41
43
40
35
39
37
39
39
27
32
37
48
39
42
39
48
47
48
39
35
43
43
39
34
54
45
42
57
FR08016
2017-09 2020-05
index
2020-05
2020-04
2020-03
2020-02
2020-01
2019-12
2019-11
2019-10
2019-09
2019-08
2019-07
2019-06
2019-05
2019-04
2019-03
2019-02
2019-01
2018-11
2018-10
2018-09
2018-08
2018-07
2018-06
2018-05
2018-04
2018-03
2018-02
2018-01
2017-12
2017-11
2017-10
2017-09
pm25
4
7.7
8.5
6.6
11
8.4
5.3
7.8
5.5
7.6
8.8
6.8
5.7
6.3
6
11
5.9
8.9
8.6
8.7
16
7.3
16
11
11
7.4
9.9
7
12
11
8.7
12
pm10
11
16
16
15
18
17
12
17
14
17
19
15
9.7
13
15
20
11
15
16
17
16
16
12
12
14
6.4
13
12
14
15
15
20
no2
5.9
9.1
14
22
28
24
23
19
19
14
15
14
14
16
19
30
23
23
20
18
15
15
15
13
20
16
22
20
28
25
19
29
o3
72
81
71
57
41
43
40
47
62
73
75
77
78
78
70
46
45
34
49
72
99
75
65
73
70
65
49
45
31
40
50
59
FR08017
index
2020-05
2020-04
2020-03
2020-02
2020-01
2019-12
2019-11
2019-10
2019-09
2019-08
2019-07
2019-06
2019-05
2019-04
2019-03
2019-02
2019-01
2018-11
2018-10
2018-09
2018-08
2018-07
2018-06
2018-05
2018-04
2018-03
2018-02
2018-01
2017-12
2017-11
2017-10
2017-09
o3
66
68
61
48
36
41
39
52
64
77
80
79
80
84
67
45
45
42
51
70
77
85
74
76
76
67
48
46
29
40
52
55
FR08020
2017-09 2020-05
index
2020-05
2020-04
2020-03
2020-02
2020-01
2019-12
2019-11
2019-10
2019-09
2019-08
2019-07
2019-06
2019-05
2019-04
2019-03
2019-02
2019-01
2018-11
2018-10
2018-09
2018-08
2018-07
2018-06
2018-05
2018-04
2018-03
2018-02
2018-01
2017-12
2017-11
2017-10
2017-09
pm25
3.7
8.2
8.3
6.6
11
9.3
6.2
7.1
5.8
9.8
13
11
5.9
8.2
7.6
16
8
8.6
9.4
9.2
9.8
41
7.4
8.2
9.5
6.2
11
8.1
11
9.7
9.2
11
pm10
12
17
16
16
18
17
12
18
14
17
18
18
11
15
15
22
11
18
18
21
37
20
20
20
20
12
15
15
17
12
16
17
no2
4.4
5.8
8.8
15
17
15
14
11
13
8.8
8.8
9.7
7.7
11
12
24
12
15
13
13
10
9.8
8.1
7.9
10
9.4
13
14
21
12
14
18
FR08030
2017-09 2020-05

index
2020-05
2020-04
2020-03
2020-02
2020-01
2019-12
2019-11
2019-10
2019-09
2019-08
2019-07
2019-06
2019-05
2019-04
2019-03
2019-02
2019-01
2018-11
2018-10
2018-09
2018-08
2018-07
2018-06
2018-05
2018-04
2018-03
2018-02
2018-01
2017-12
2017-11
2017-10
2017-09
pm25
4.4
9.1
9.5
7.7
15
11
6.8
9
6.3
8.9
10
9.1
5.9
6.8
7.4
16
8.7
8.4
12
8.6
9.9
9.4
7.7
8.2
12
11
15
11
17
9.7
12
13
pm10
12
16
17
18
25
24
14
21
15
17
19
16
12
16
18
26
13
25
23
20
17
19
26
25
27
12
40
16
22
12
20
18
no2
9.1
11
18
32
34
33
29
28
23
20
20
25
18
27
27
40
30
35
30
29
24
24
23
20
30
26
25
28
40
23
37
41
* Pollution data source:
https://openaq.org
(EEA France)
The data is licensed under CC-By 4.0
NO2 16 (gut)
5 (gut)
O3 28 (gut)
PM10 14 (gut)
PM2,5 11 (gut)
Daten zur Luftverschmutzung der letzten Tage in Arrondissement of Montpellier
| index | 2024-01-10 | 2024-01-11 | 2024-01-12 | 2024-01-13 | 2024-01-14 | 2024-01-15 | 2024-01-16 | 2024-01-17 |
|---|---|---|---|---|---|---|---|---|
| no | 6 Good |
4 Good |
14 Good |
10 Good |
16 Good |
9 Good |
8 Good |
4 Good |
| no2 | 21 Good |
14 Good |
21 Good |
24 Good |
25 Good |
19 Good |
24 Good |
15 Good |
| pm10 | 22 Moderate |
11 Good |
25 Moderate |
34 Moderate |
41 Moderate |
20 Moderate |
22 Moderate |
26 Moderate |
| pm25 | 19 Moderate |
10 Good |
21 Moderate |
30 Moderate |
37 Unhealthy for Sensitive Groups |
13 Moderate |
15 Moderate |
22 Moderate |
| o3 | 19 Good |
30 Good |
20 Good |
22 Good |
9 Good |
46 Good |
23 Good |
24 Good |
| index | 2020-05 | 2020-04 | 2020-03 | 2020-01 | 2019-12 | 2019-11 | 2019-10 | 2019-09 | 2019-08 | 2019-07 | 2019-06 | 2019-05 | 2019-04 | 2019-03 | 2019-02 | 2019-01 | 2018-11 | 2018-10 | 2018-09 | 2018-08 | 2018-07 | 2018-06 | 2018-05 | 2018-04 | 2018-03 | 2018-02 | 2018-01 | 2017-12 | 2017-11 | 2017-10 | 2017-09 | 2020-02 |
|---|---|---|---|---|---|---|---|---|---|---|---|---|---|---|---|---|---|---|---|---|---|---|---|---|---|---|---|---|---|---|---|---|
| no2 | 9.3 (Good) | 10 (Good) | 16 (Good) | 30 (Good) | 28 (Good) | 27 (Good) | 23 (Good) | 24 (Good) | 21 (Good) | 22 (Good) | 22 (Good) | 17 (Good) | 22 (Good) | 23 (Good) | 35 (Good) | 26 (Good) | 29 (Good) | 26 (Good) | 28 (Good) | 24 (Good) | 24 (Good) | 21 (Good) | 19 (Good) | 26 (Good) | 24 (Good) | 25 (Good) | 24 (Good) | 36 (Good) | 28 (Good) | 29 (Good) | 37 (Good) | 27 (Good) |
| pm25 | 4 (Good) | 8.3 (Good) | 8.8 (Good) | 12 (Good) | 9.7 (Good) | 6.1 (Good) | 8 (Good) | 5.9 (Good) | 8.8 (Good) | 10 (Good) | 8.8 (Good) | 5.8 (Good) | 7.1 (Good) | 7 (Good) | 14 (Moderate) | 7.5 (Good) | 8.7 (Good) | 10 (Good) | 8.9 (Good) | 12 (Good) | 19 (Moderate) | 10 (Good) | 9.1 (Good) | 11 (Good) | 8.1 (Good) | 12 (Good) | 8.8 (Good) | 13 (Moderate) | 10 (Good) | 10 (Good) | 12 (Good) | 7 (Good) |
| pm10 | 12 (Good) | 16 (Good) | 16 (Good) | 20 (Moderate) | 19 (Good) | 13 (Good) | 19 (Good) | 15 (Good) | 17 (Good) | 19 (Good) | 16 (Good) | 11 (Good) | 15 (Good) | 16 (Good) | 23 (Moderate) | 12 (Good) | 19 (Good) | 19 (Good) | 19 (Good) | 23 (Moderate) | 18 (Good) | 19 (Good) | 19 (Good) | 20 (Moderate) | 10 (Good) | 23 (Moderate) | 14 (Good) | 18 (Good) | 13 (Good) | 17 (Good) | 18 (Good) | 16 (Good) |
| o3 | 69 (Good) | 75 (Moderate) | 66 (Good) | 39 (Good) | 42 (Good) | 40 (Good) | 49 (Good) | 63 (Good) | 75 (Moderate) | 78 (Moderate) | 78 (Moderate) | 79 (Moderate) | 81 (Moderate) | 69 (Good) | 45 (Good) | 45 (Good) | 38 (Good) | 50 (Good) | 71 (Moderate) | 88 (Moderate) | 80 (Moderate) | 70 (Good) | 74 (Moderate) | 73 (Moderate) | 66 (Good) | 48 (Good) | 46 (Good) | 30 (Good) | 40 (Good) | 51 (Good) | 57 (Good) | 52 (Good) |
Grün und Parks in der Stadt
Arrondissement of Montpellier 56 %
Andorra: 69 % Schweiz: 76 % Luxemburg: 83 % Belgien: 64 % Liechtenstein: 88 %Feinstaub PM2,5
Arrondissement of Montpellier 10 (Good)
Vergnügen, Zeit in der Stadt zu verbringen
Arrondissement of Montpellier 73 %
Andorra: 84 % Schweiz: 84 % Luxemburg: 85 % Belgien: 64 % Liechtenstein: 94 %Feinstaub PM10
Arrondissement of Montpellier 18 (Good)
Luftverschmutzung
Arrondissement of Montpellier 30 %
Andorra: 29 % Schweiz: 20 % Luxemburg: 19 % Belgien: 45 % Liechtenstein: 6,3 %Müllentsorgung
Arrondissement of Montpellier 48 %
Andorra: 89 % Schweiz: 82 % Luxemburg: 84 % Belgien: 54 % Liechtenstein: 100 %Verfügbarkeit und Qualität von Trinkwasser
Arrondissement of Montpellier 55 %
Andorra: 100 % Schweiz: 90 % Luxemburg: 83 % Belgien: 70 % Liechtenstein: 100 %Sauberkeit und Ordentlichkeit
Arrondissement of Montpellier 35 %
Andorra: 75 % Schweiz: 82 % Luxemburg: 82 % Belgien: 46 % Liechtenstein: 94 %Lärm und Lichtverschmutzung
Arrondissement of Montpellier 48 %
Andorra: 29 % Schweiz: 38 % Luxemburg: 29 % Belgien: 54 % Liechtenstein: 19 %Wasserverschmutzung
Arrondissement of Montpellier 33 %
Andorra: 19 % Schweiz: 19 % Luxemburg: 19 % Belgien: 42 % Liechtenstein: 0 %NO2 17 (gut)
Stickstoffdioxid (NO2)6 (gut)
index_name_noNO2 16 (gut)
Stickstoffdioxid (NO2)NO2 18 (gut)
Stickstoffdioxid (NO2)O3 25 (gut)
Ozon (O3)PM10 16 (gut)
Feinstaub (PM10) SchwebestaubPM2,5 11 (gut)
Feinstaub (PM2,5)3.7 (gut)
index_name_noO3 31 (gut)
Ozon (O3)PM2,5 9.9 (gut)
Feinstaub (PM2,5)NO2 12 (gut)
Stickstoffdioxid (NO2)5.7 (gut)
index_name_noPM10 11 (gut)
Feinstaub (PM10) SchwebestaubPM10 15 (gut)
Feinstaub (PM10) SchwebestaubPM2,5 11 (gut)
Feinstaub (PM2,5)Chaptal
| index | 2024-01-17 | 2024-01-16 | 2024-01-15 | 2024-01-14 | 2024-01-13 | 2024-01-12 | 2024-01-11 | 2024-01-10 |
|---|---|---|---|---|---|---|---|---|
| no | 4 | 7.8 | 4.1 | 13 | 13 | 18 | 3.3 | 5.7 |
| no2 | 15 | 25 | 19 | 25 | 26 | 23 | 16 | 24 |
FR08004
| index | 2024-01-17 | 2024-01-16 | 2024-01-15 | 2024-01-14 | 2024-01-13 | 2024-01-12 | 2024-01-11 | 2024-01-10 |
|---|---|---|---|---|---|---|---|---|
| no2 | 15 | 27 | 23 | 30 | 27 | 24 | 15 | 24 |
Prés Arènes
| index | 2024-01-17 | 2024-01-16 | 2024-01-15 | 2024-01-14 | 2024-01-13 | 2024-01-12 | 2024-01-11 | 2024-01-10 |
|---|---|---|---|---|---|---|---|---|
| no2 | 17 | 28 | 16 | 30 | 27 | 25 | 16 | 25 |
| no | 2.6 | 6.1 | 2.2 | 26 | 7.7 | 14 | 3.7 | 5.8 |
| pm10 | 28 | 21 | 11 | 45 | 35 | 26 | 11 | 23 |
| pm25 | 24 | 15 | 7.2 | 41 | 32 | 22 | 10 | 20 |
| o3 | 23 | 19 | 43 | 7.4 | 20 | 18 | 27 | 17 |
FR08017
| index | 2024-01-17 | 2024-01-16 | 2024-01-15 | 2024-01-14 | 2024-01-13 | 2024-01-12 | 2024-01-11 | 2024-01-10 |
|---|---|---|---|---|---|---|---|---|
| o3 | 26 | 26 | 48 | 11 | 24 | 22 | 32 | 20 |
FR08020
| index | 2024-01-17 | 2024-01-16 | 2024-01-15 | 2024-01-14 | 2024-01-13 | 2024-01-12 | 2024-01-11 | 2024-01-10 |
|---|---|---|---|---|---|---|---|---|
| no2 | 12 | 15 | 19 | 14 | 15 | 13 | 9.2 | 12 |
| pm25 | 23 | 16 | 19 | 34 | 29 | 21 | 11 | 19 |
| no | 4.9 | 8.7 | 20 | 9.3 | 8.5 | 9 | 4.6 | 5.3 |
| pm10 | 25 | 20 | 26 | 37 | 32 | 23 | 12 | 21 |
FR08030
| index | 2024-01-17 | 2024-01-16 | 2024-01-15 | 2024-01-14 | 2024-01-13 | 2024-01-12 | 2024-01-11 | 2024-01-10 |
|---|---|---|---|---|---|---|---|---|
| pm25 | 20 | 15 | 12 | 35 | 28 | 19 | 9.5 | 18 |
| pm10 | 25 | 26 | 22 | 42 | 35 | 27 | 10 | 21 |
FR08003
| index | 2020-05 | 2020-04 | 2020-03 | 2020-01 | 2019-12 | 2019-11 | 2019-10 | 2019-09 | 2019-08 | 2019-07 | 2019-06 | 2019-05 | 2019-04 | 2019-03 | 2019-02 | 2019-01 | 2018-11 | 2018-10 | 2018-09 | 2018-08 | 2018-07 | 2018-06 | 2018-05 | 2018-04 | 2018-03 | 2018-02 | 2018-01 | 2017-12 | 2017-11 | 2017-10 | 2017-09 |
|---|---|---|---|---|---|---|---|---|---|---|---|---|---|---|---|---|---|---|---|---|---|---|---|---|---|---|---|---|---|---|---|
| no2 | 7.1 | 10 | 13 | 30 | 27 | 28 | 25 | 28 | 25 | 27 | 26 | 17 | 22 | 22 | 34 | 27 | 31 | 28 | 30 | 24 | 23 | 20 | 18 | 25 | 24 | 25 | 27 | 38 | 35 | 32 | 38 |
FR08004
| index | 2020-05 | 2020-04 | 2020-03 | 2020-02 | 2020-01 | 2019-12 | 2019-11 | 2019-10 | 2019-09 | 2019-08 | 2019-07 | 2019-06 | 2019-05 | 2019-04 | 2019-03 | 2019-02 | 2019-01 | 2018-11 | 2018-10 | 2018-09 | 2018-08 | 2018-07 | 2018-06 | 2018-05 | 2018-04 | 2018-03 | 2018-02 | 2018-01 | 2017-12 | 2017-11 | 2017-10 | 2017-09 |
|---|---|---|---|---|---|---|---|---|---|---|---|---|---|---|---|---|---|---|---|---|---|---|---|---|---|---|---|---|---|---|---|---|
| no2 | 20 | 17 | 25 | 39 | 41 | 43 | 40 | 35 | 39 | 37 | 39 | 39 | 27 | 32 | 37 | 48 | 39 | 42 | 39 | 48 | 47 | 48 | 39 | 35 | 43 | 43 | 39 | 34 | 54 | 45 | 42 | 57 |
FR08016

| index | 2020-05 | 2020-04 | 2020-03 | 2020-02 | 2020-01 | 2019-12 | 2019-11 | 2019-10 | 2019-09 | 2019-08 | 2019-07 | 2019-06 | 2019-05 | 2019-04 | 2019-03 | 2019-02 | 2019-01 | 2018-11 | 2018-10 | 2018-09 | 2018-08 | 2018-07 | 2018-06 | 2018-05 | 2018-04 | 2018-03 | 2018-02 | 2018-01 | 2017-12 | 2017-11 | 2017-10 | 2017-09 |
|---|---|---|---|---|---|---|---|---|---|---|---|---|---|---|---|---|---|---|---|---|---|---|---|---|---|---|---|---|---|---|---|---|
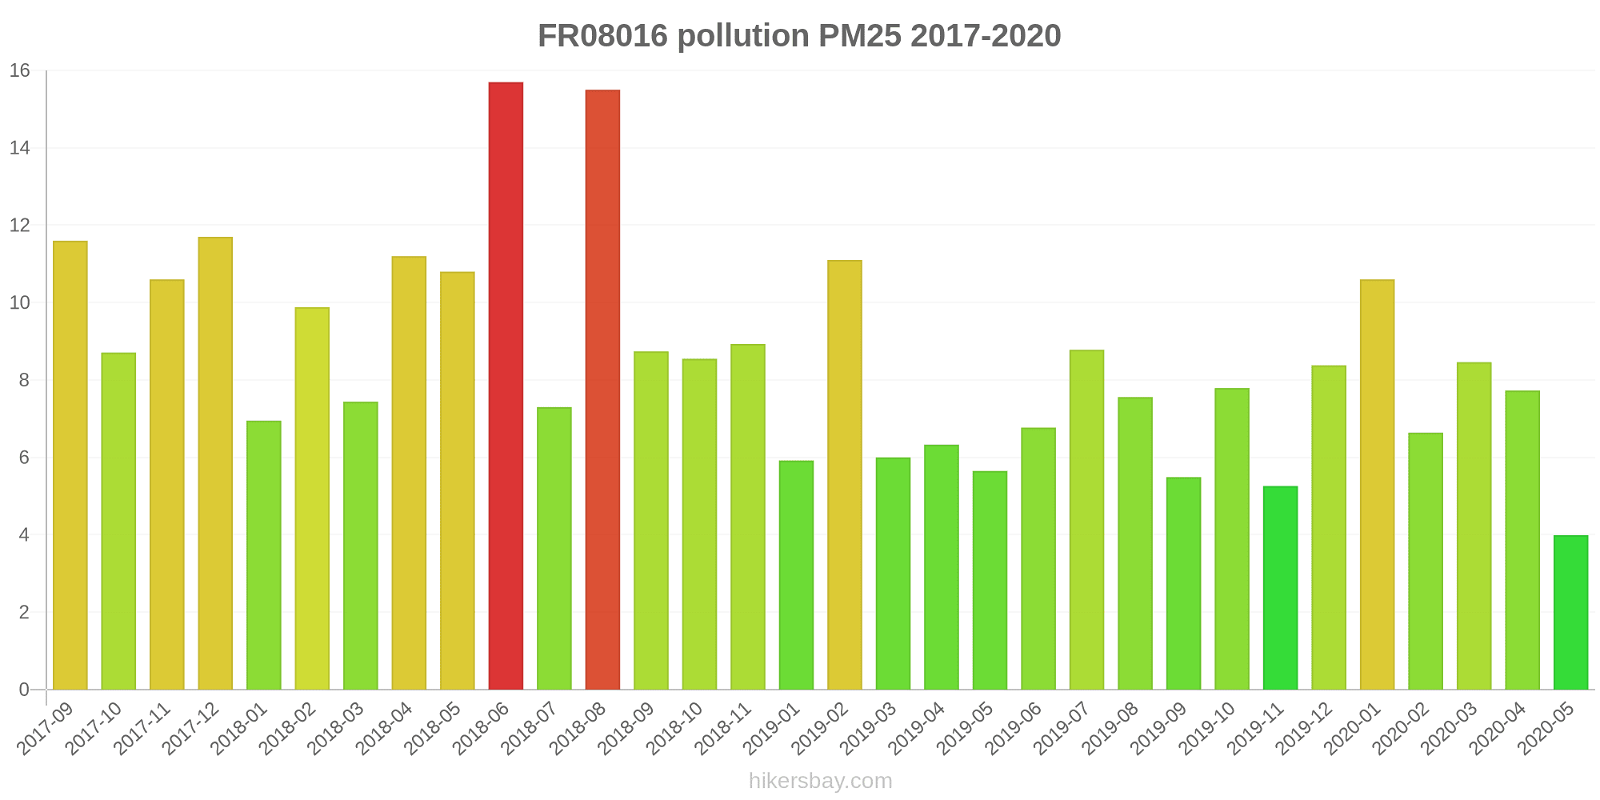
| pm25 | 4 | 7.7 | 8.5 | 6.6 | 11 | 8.4 | 5.3 | 7.8 | 5.5 | 7.6 | 8.8 | 6.8 | 5.7 | 6.3 | 6 | 11 | 5.9 | 8.9 | 8.6 | 8.7 | 16 | 7.3 | 16 | 11 | 11 | 7.4 | 9.9 | 7 | 12 | 11 | 8.7 | 12 |
| pm10 | 11 | 16 | 16 | 15 | 18 | 17 | 12 | 17 | 14 | 17 | 19 | 15 | 9.7 | 13 | 15 | 20 | 11 | 15 | 16 | 17 | 16 | 16 | 12 | 12 | 14 | 6.4 | 13 | 12 | 14 | 15 | 15 | 20 |
| no2 | 5.9 | 9.1 | 14 | 22 | 28 | 24 | 23 | 19 | 19 | 14 | 15 | 14 | 14 | 16 | 19 | 30 | 23 | 23 | 20 | 18 | 15 | 15 | 15 | 13 | 20 | 16 | 22 | 20 | 28 | 25 | 19 | 29 |
| o3 | 72 | 81 | 71 | 57 | 41 | 43 | 40 | 47 | 62 | 73 | 75 | 77 | 78 | 78 | 70 | 46 | 45 | 34 | 49 | 72 | 99 | 75 | 65 | 73 | 70 | 65 | 49 | 45 | 31 | 40 | 50 | 59 |
FR08017
| index | 2020-05 | 2020-04 | 2020-03 | 2020-02 | 2020-01 | 2019-12 | 2019-11 | 2019-10 | 2019-09 | 2019-08 | 2019-07 | 2019-06 | 2019-05 | 2019-04 | 2019-03 | 2019-02 | 2019-01 | 2018-11 | 2018-10 | 2018-09 | 2018-08 | 2018-07 | 2018-06 | 2018-05 | 2018-04 | 2018-03 | 2018-02 | 2018-01 | 2017-12 | 2017-11 | 2017-10 | 2017-09 |
|---|---|---|---|---|---|---|---|---|---|---|---|---|---|---|---|---|---|---|---|---|---|---|---|---|---|---|---|---|---|---|---|---|
| o3 | 66 | 68 | 61 | 48 | 36 | 41 | 39 | 52 | 64 | 77 | 80 | 79 | 80 | 84 | 67 | 45 | 45 | 42 | 51 | 70 | 77 | 85 | 74 | 76 | 76 | 67 | 48 | 46 | 29 | 40 | 52 | 55 |
FR08020

| index | 2020-05 | 2020-04 | 2020-03 | 2020-02 | 2020-01 | 2019-12 | 2019-11 | 2019-10 | 2019-09 | 2019-08 | 2019-07 | 2019-06 | 2019-05 | 2019-04 | 2019-03 | 2019-02 | 2019-01 | 2018-11 | 2018-10 | 2018-09 | 2018-08 | 2018-07 | 2018-06 | 2018-05 | 2018-04 | 2018-03 | 2018-02 | 2018-01 | 2017-12 | 2017-11 | 2017-10 | 2017-09 |
|---|---|---|---|---|---|---|---|---|---|---|---|---|---|---|---|---|---|---|---|---|---|---|---|---|---|---|---|---|---|---|---|---|
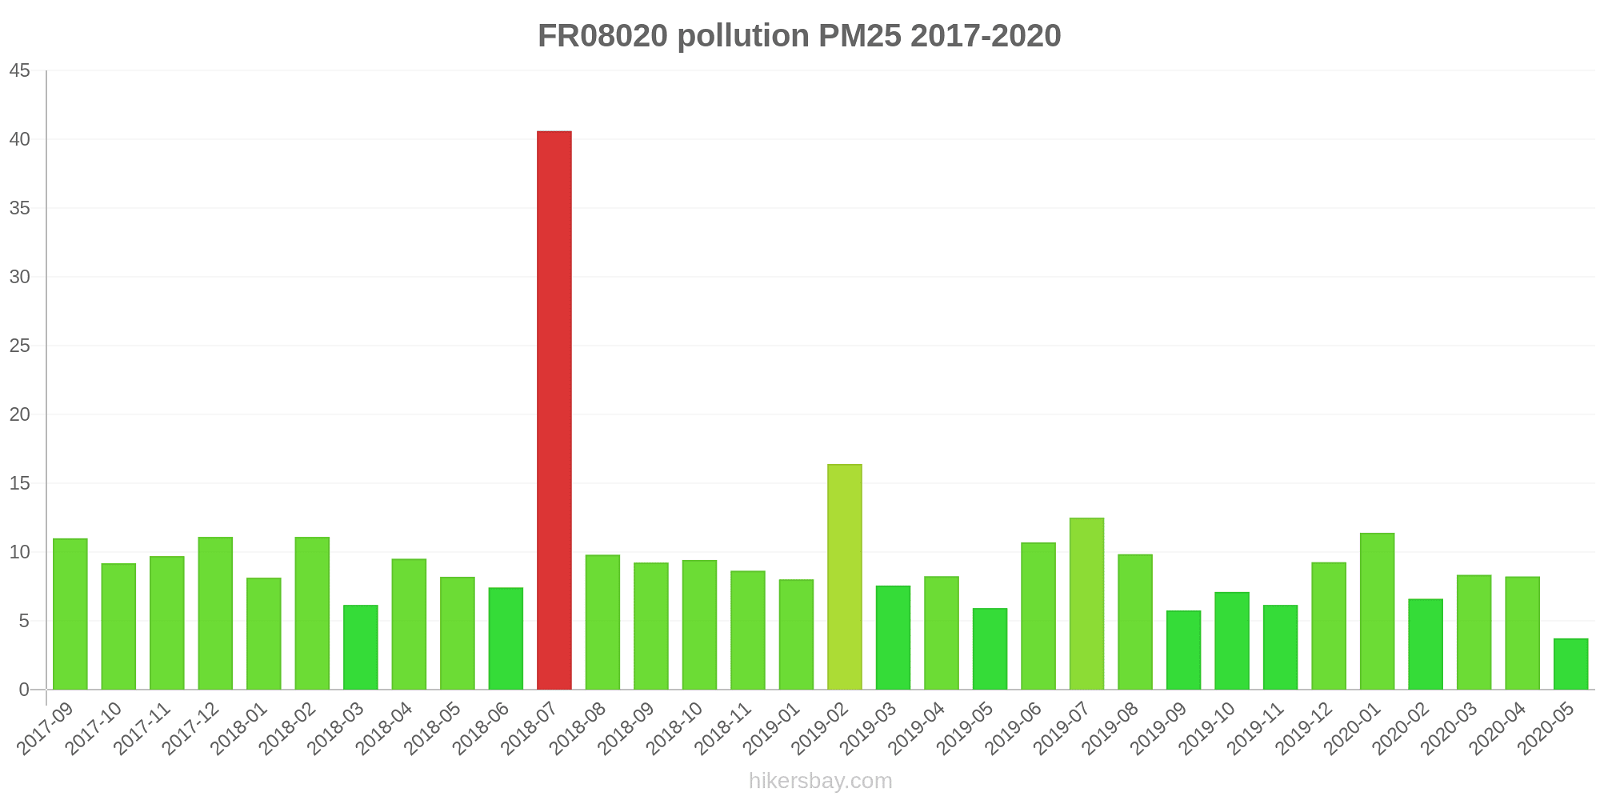
| pm25 | 3.7 | 8.2 | 8.3 | 6.6 | 11 | 9.3 | 6.2 | 7.1 | 5.8 | 9.8 | 13 | 11 | 5.9 | 8.2 | 7.6 | 16 | 8 | 8.6 | 9.4 | 9.2 | 9.8 | 41 | 7.4 | 8.2 | 9.5 | 6.2 | 11 | 8.1 | 11 | 9.7 | 9.2 | 11 |
| pm10 | 12 | 17 | 16 | 16 | 18 | 17 | 12 | 18 | 14 | 17 | 18 | 18 | 11 | 15 | 15 | 22 | 11 | 18 | 18 | 21 | 37 | 20 | 20 | 20 | 20 | 12 | 15 | 15 | 17 | 12 | 16 | 17 |
| no2 | 4.4 | 5.8 | 8.8 | 15 | 17 | 15 | 14 | 11 | 13 | 8.8 | 8.8 | 9.7 | 7.7 | 11 | 12 | 24 | 12 | 15 | 13 | 13 | 10 | 9.8 | 8.1 | 7.9 | 10 | 9.4 | 13 | 14 | 21 | 12 | 14 | 18 |
FR08030
| index | 2020-05 | 2020-04 | 2020-03 | 2020-02 | 2020-01 | 2019-12 | 2019-11 | 2019-10 | 2019-09 | 2019-08 | 2019-07 | 2019-06 | 2019-05 | 2019-04 | 2019-03 | 2019-02 | 2019-01 | 2018-11 | 2018-10 | 2018-09 | 2018-08 | 2018-07 | 2018-06 | 2018-05 | 2018-04 | 2018-03 | 2018-02 | 2018-01 | 2017-12 | 2017-11 | 2017-10 | 2017-09 |
|---|---|---|---|---|---|---|---|---|---|---|---|---|---|---|---|---|---|---|---|---|---|---|---|---|---|---|---|---|---|---|---|---|
| pm25 | 4.4 | 9.1 | 9.5 | 7.7 | 15 | 11 | 6.8 | 9 | 6.3 | 8.9 | 10 | 9.1 | 5.9 | 6.8 | 7.4 | 16 | 8.7 | 8.4 | 12 | 8.6 | 9.9 | 9.4 | 7.7 | 8.2 | 12 | 11 | 15 | 11 | 17 | 9.7 | 12 | 13 |
| pm10 | 12 | 16 | 17 | 18 | 25 | 24 | 14 | 21 | 15 | 17 | 19 | 16 | 12 | 16 | 18 | 26 | 13 | 25 | 23 | 20 | 17 | 19 | 26 | 25 | 27 | 12 | 40 | 16 | 22 | 12 | 20 | 18 |
| no2 | 9.1 | 11 | 18 | 32 | 34 | 33 | 29 | 28 | 23 | 20 | 20 | 25 | 18 | 27 | 27 | 40 | 30 | 35 | 30 | 29 | 24 | 24 | 23 | 20 | 30 | 26 | 25 | 28 | 40 | 23 | 37 | 41 |