Luftverschmutzung in Indraprasiha: Echtzeit-Luft-Qualitätsindex und Smog-Alarm.
Für die Indraprasiha. Heute ist Samstag, 13. Dezember 2025. Für Indraprasiha wurden folgende Luftverschmutzungswerte gemessen:- Feinstaub (PM2,5) - 228 (Sehr schlecht Gefährlich)
- Feinstaub (PM10) Schwebestaub - 327 (Sehr schlecht Gefährlich)
- Stickstoffdioxid (NO2) - 46 (Moderate)
- Ozon (O3) - 1 (gut)
- Schwefeldioxid (SO2) - 0 (gut)
- Kohlenmonoxid (CO) - 300 (gut)

Wie ist die Luftqualität Indraprasiha heute? Ist die Luft in Indraprasiha? verschmutzt. Gibt es Smog?
Wie hoch ist der aktuelle PM2,5-Wert in Indraprasiha? (Feinstaub (PM2,5))
Die heutige PM2.5-Stufe ist:
228 (Sehr schlecht Gefährlich)
Zum Vergleich: Der höchste PM2,5-Wert in Indraprasiha in den letzten 7 Tagen war: 228 (Montag, 31. Oktober 2022) und der niedrigste: 228 (Montag, 31. Oktober 2022).
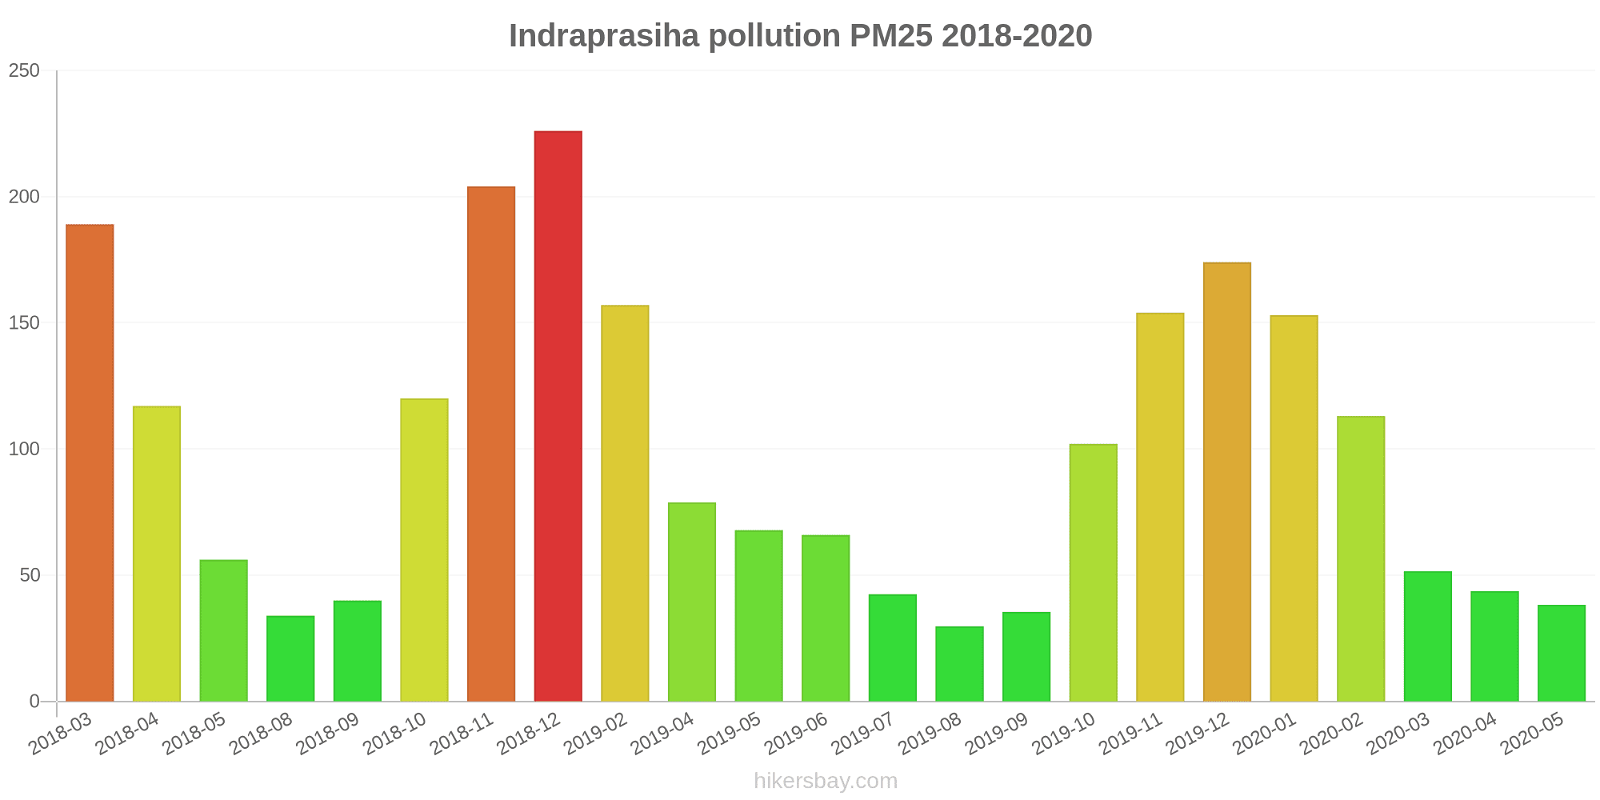
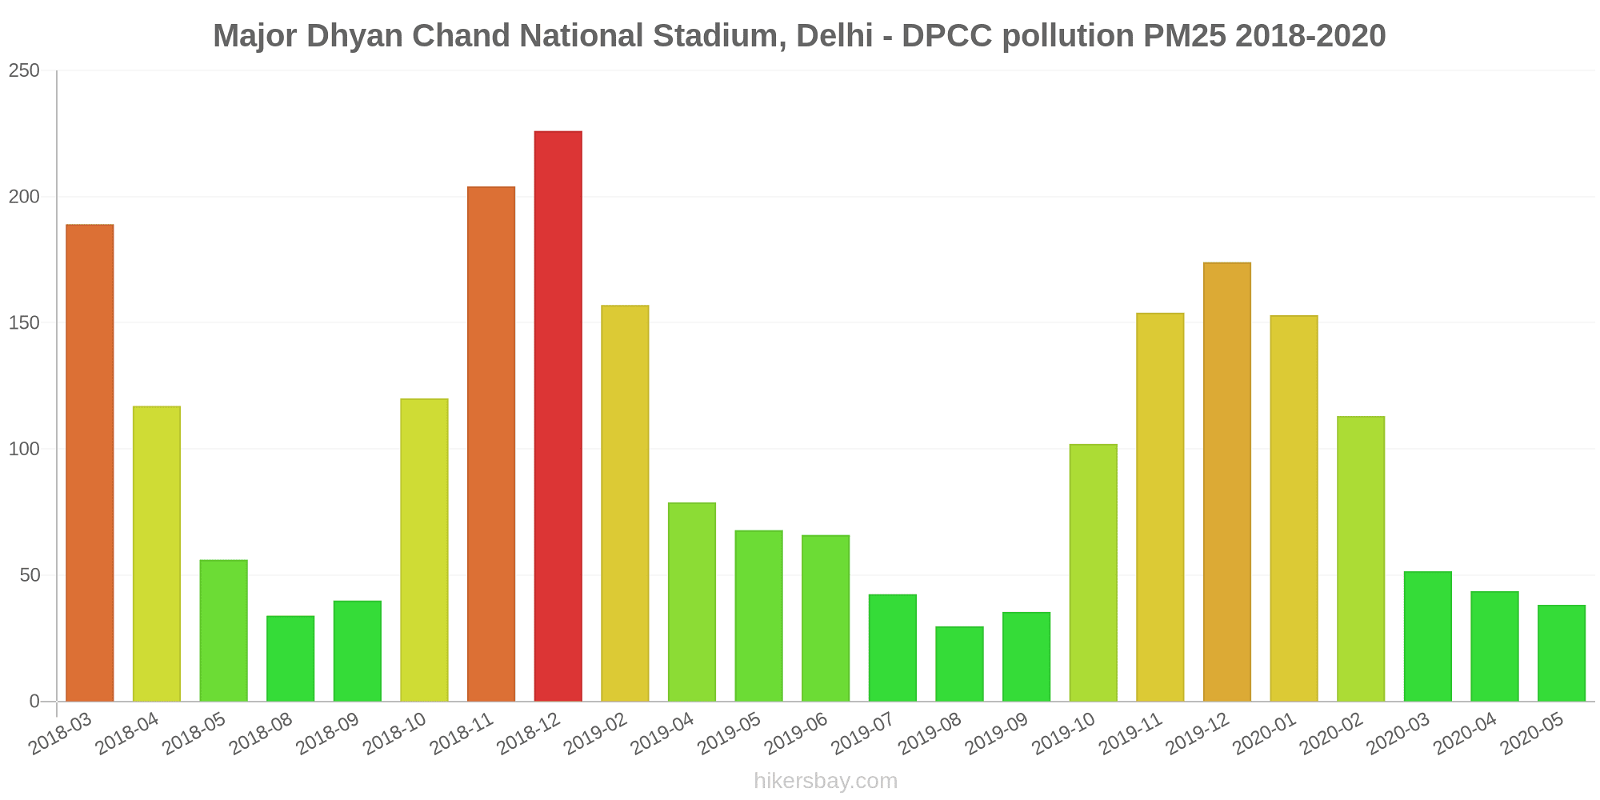
Die höchsten PM2,5-Werte wurden gemessen: 226 (Dezember 2018).
Die niedrigste Feinstaubbelastung PM2,5 tritt im Monat auf: August (30).
Wie hoch ist der PM10-Stand heute in Indraprasiha? (Feinstaub (PM10) Schwebestaub)
Der aktuelle Feinstaubgehalt PM10 in Indraprasiha is:
327 (Sehr schlecht Gefährlich)
Die höchsten PM10-Werte treten in der Regel im Monat auf: 413 (Dezember 2018).
Der niedrigste Wert der Feinstaub-PM10-Belastung in Indraprasiha ist in der Regel in: August (76).
Wie hoch ist das NO2-Niveau? (Stickstoffdioxid (NO2))
46 (Moderate)
Wie ist das O3-Niveau heute in Indraprasiha? (Ozon (O3))
1 (gut)
Wie hoch ist die SO2-Belastung? (Schwefeldioxid (SO2))
0 (gut)
Wie hoch ist der CO-Gehalt? (Kohlenmonoxid (CO))
300 (gut)
Aktuelle Daten Montag, 31. Oktober 2022, 00:45
PM2,5 228 (Sehr schlecht Gefährlich)
PM10 327 (Sehr schlecht Gefährlich)
NO2 46 (Moderate)
O3 1 (gut)
SO2 0 (gut)
CO 300 (gut)
Daten zur Luftverschmutzung der letzten Tage in Indraprasiha
index
2022-10-31
pm25
228
Very bad Hazardous
pm10
327
Very bad Hazardous
no2
46
Moderate
o3
1
Good
so2
0
Good
co
300
Good
data source »
Luftverschmutzung in Indraprasiha von März 2018 bis Mai 2020

index
2020-05
2020-04
2020-03
2020-02
2020-01
2019-12
2019-11
2019-10
2019-09
2019-08
2019-07
2019-06
2019-05
2019-04
2019-02
2018-12
2018-11
2018-10
2018-09
2018-08
2018-05
2018-04
2018-03
pm25
38 (Unhealthy for Sensitive Groups)
44 (Unhealthy for Sensitive Groups)
52 (Unhealthy for Sensitive Groups)
113 (Very bad Hazardous)
153 (Very bad Hazardous)
174 (Very bad Hazardous)
154 (Very bad Hazardous)
102 (Very Unhealthy)
35 (Unhealthy for Sensitive Groups)
30 (Moderate)
42 (Unhealthy for Sensitive Groups)
66 (Unhealthy)
68 (Unhealthy)
79 (Very Unhealthy)
157 (Very bad Hazardous)
226 (Very bad Hazardous)
204 (Very bad Hazardous)
120 (Very bad Hazardous)
40 (Unhealthy for Sensitive Groups)
34 (Moderate)
56 (Unhealthy)
117 (Very bad Hazardous)
189 (Very bad Hazardous)
pm10
86 (Unhealthy)
92 (Unhealthy)
108 (Unhealthy)
200 (Very bad Hazardous)
232 (Very bad Hazardous)
316 (Very bad Hazardous)
278 (Very bad Hazardous)
215 (Very bad Hazardous)
88 (Unhealthy)
76 (Unhealthy for Sensitive Groups)
136 (Very Unhealthy)
188 (Very bad Hazardous)
235 (Very bad Hazardous)
265 (Very bad Hazardous)
307 (Very bad Hazardous)
413 (Very bad Hazardous)
326 (Very bad Hazardous)
269 (Very bad Hazardous)
91 (Unhealthy)
81 (Unhealthy)
187 (Very bad Hazardous)
204 (Very bad Hazardous)
210 (Very bad Hazardous)
no2
15 (Good)
17 (Good)
36 (Good)
61 (Moderate)
61 (Moderate)
85 (Moderate)
98 (Moderate)
72 (Moderate)
36 (Good)
37 (Good)
38 (Good)
51 (Moderate)
69 (Moderate)
77 (Moderate)
91 (Moderate)
79 (Moderate)
83 (Moderate)
84 (Moderate)
39 (Good)
38 (Good)
51 (Moderate)
71 (Moderate)
82 (Moderate)
co
464 (Good)
452 (Good)
750 (Good)
1 (Good)
1 (Good)
1 (Good)
2 (Good)
1 (Good)
1 (Good)
1 (Good)
1 (Good)
1 (Good)
1 (Good)
1 (Good)
2 (Good)
3 (Good)
2 (Good)
2 (Good)
969 (Good)
824 (Good)
1 (Good)
39 (Good)
65 (Good)
o3
30 (Good)
25 (Good)
19 (Good)
19 (Good)
14 (Good)
15 (Good)
12 (Good)
17 (Good)
15 (Good)
14 (Good)
22 (Good)
52 (Good)
50 (Good)
34 (Good)
21 (Good)
11 (Good)
38 (Good)
49 (Good)
24 (Good)
26 (Good)
79 (Moderate)
59 (Good)
28 (Good)
so2
19 (Good)
19 (Good)
19 (Good)
18 (Good)
13 (Good)
12 (Good)
15 (Good)
13 (Good)
7.8 (Good)
9.1 (Good)
10 (Good)
12 (Good)
26 (Good)
23 (Good)
14 (Good)
12 (Good)
15 (Good)
17 (Good)
11 (Good)
10 (Good)
6.9 (Good)
21 (Good)
32 (Good)
data source »
Major Dhyan Chand National Stadium, Delhi - DPCC
Montag, 31. Oktober 2022, 00:45
PM2,5 228 (Sehr schlecht Gefährlich)
Feinstaub (PM2,5)
PM10 327 (Sehr schlecht Gefährlich)
Feinstaub (PM10) Schwebestaub
NO2 46 (Moderate)
Stickstoffdioxid (NO2)
O3 1 (gut)
Ozon (O3)
SO2 0.1 (gut)
Schwefeldioxid (SO2)
CO 300 (gut)
Kohlenmonoxid (CO)
Major Dhyan Chand National Stadium, Delhi - DPCC
index
2022-10-31
pm25
228
pm10
327
no2
46
o3
1
so2
0.1
co
300
Major Dhyan Chand National Stadium, Delhi - DPCC
2018-03 2020-05

index
2020-05
2020-04
2020-03
2020-02
2020-01
2019-12
2019-11
2019-10
2019-09
2019-08
2019-07
2019-06
2019-05
2019-04
2019-02
2018-12
2018-11
2018-10
2018-09
2018-08
2018-05
2018-04
2018-03
so2
19
19
19
18
13
12
15
13
7.8
9.1
10
12
26
23
14
12
15
17
11
10
6.9
21
32
pm25
38
44
52
113
153
174
154
102
35
30
42
66
68
79
157
226
204
120
40
34
56
117
189
pm10
86
92
108
200
232
316
278
215
88
76
136
188
235
265
307
413
326
269
91
81
187
204
210
no2
15
17
36
61
61
85
98
72
36
37
38
51
69
77
91
79
83
84
39
38
51
71
82
co
464
452
750
1
1
1
2
1
1
1
1
1
1
1
2
3
2
2
969
824
1
39
65
o3
30
25
19
19
14
15
12
17
15
14
22
52
50
34
21
11
38
49
24
26
79
59
28
* Pollution data source:
https://openaq.org
(caaqm)
The data is licensed under CC-By 4.0
PM2,5 228 (Sehr schlecht Gefährlich)
PM10 327 (Sehr schlecht Gefährlich)
NO2 46 (Moderate)
O3 1 (gut)
SO2 0 (gut)
CO 300 (gut)
Daten zur Luftverschmutzung der letzten Tage in Indraprasiha
| index | 2022-10-31 |
|---|---|
| pm25 | 228 Very bad Hazardous |
| pm10 | 327 Very bad Hazardous |
| no2 | 46 Moderate |
| o3 | 1 Good |
| so2 | 0 Good |
| co | 300 Good |

| index | 2020-05 | 2020-04 | 2020-03 | 2020-02 | 2020-01 | 2019-12 | 2019-11 | 2019-10 | 2019-09 | 2019-08 | 2019-07 | 2019-06 | 2019-05 | 2019-04 | 2019-02 | 2018-12 | 2018-11 | 2018-10 | 2018-09 | 2018-08 | 2018-05 | 2018-04 | 2018-03 |
|---|---|---|---|---|---|---|---|---|---|---|---|---|---|---|---|---|---|---|---|---|---|---|---|
| pm25 | 38 (Unhealthy for Sensitive Groups) | 44 (Unhealthy for Sensitive Groups) | 52 (Unhealthy for Sensitive Groups) | 113 (Very bad Hazardous) | 153 (Very bad Hazardous) | 174 (Very bad Hazardous) | 154 (Very bad Hazardous) | 102 (Very Unhealthy) | 35 (Unhealthy for Sensitive Groups) | 30 (Moderate) | 42 (Unhealthy for Sensitive Groups) | 66 (Unhealthy) | 68 (Unhealthy) | 79 (Very Unhealthy) | 157 (Very bad Hazardous) | 226 (Very bad Hazardous) | 204 (Very bad Hazardous) | 120 (Very bad Hazardous) | 40 (Unhealthy for Sensitive Groups) | 34 (Moderate) | 56 (Unhealthy) | 117 (Very bad Hazardous) | 189 (Very bad Hazardous) |
| pm10 | 86 (Unhealthy) | 92 (Unhealthy) | 108 (Unhealthy) | 200 (Very bad Hazardous) | 232 (Very bad Hazardous) | 316 (Very bad Hazardous) | 278 (Very bad Hazardous) | 215 (Very bad Hazardous) | 88 (Unhealthy) | 76 (Unhealthy for Sensitive Groups) | 136 (Very Unhealthy) | 188 (Very bad Hazardous) | 235 (Very bad Hazardous) | 265 (Very bad Hazardous) | 307 (Very bad Hazardous) | 413 (Very bad Hazardous) | 326 (Very bad Hazardous) | 269 (Very bad Hazardous) | 91 (Unhealthy) | 81 (Unhealthy) | 187 (Very bad Hazardous) | 204 (Very bad Hazardous) | 210 (Very bad Hazardous) |
| no2 | 15 (Good) | 17 (Good) | 36 (Good) | 61 (Moderate) | 61 (Moderate) | 85 (Moderate) | 98 (Moderate) | 72 (Moderate) | 36 (Good) | 37 (Good) | 38 (Good) | 51 (Moderate) | 69 (Moderate) | 77 (Moderate) | 91 (Moderate) | 79 (Moderate) | 83 (Moderate) | 84 (Moderate) | 39 (Good) | 38 (Good) | 51 (Moderate) | 71 (Moderate) | 82 (Moderate) |
| co | 464 (Good) | 452 (Good) | 750 (Good) | 1 (Good) | 1 (Good) | 1 (Good) | 2 (Good) | 1 (Good) | 1 (Good) | 1 (Good) | 1 (Good) | 1 (Good) | 1 (Good) | 1 (Good) | 2 (Good) | 3 (Good) | 2 (Good) | 2 (Good) | 969 (Good) | 824 (Good) | 1 (Good) | 39 (Good) | 65 (Good) |
| o3 | 30 (Good) | 25 (Good) | 19 (Good) | 19 (Good) | 14 (Good) | 15 (Good) | 12 (Good) | 17 (Good) | 15 (Good) | 14 (Good) | 22 (Good) | 52 (Good) | 50 (Good) | 34 (Good) | 21 (Good) | 11 (Good) | 38 (Good) | 49 (Good) | 24 (Good) | 26 (Good) | 79 (Moderate) | 59 (Good) | 28 (Good) |
| so2 | 19 (Good) | 19 (Good) | 19 (Good) | 18 (Good) | 13 (Good) | 12 (Good) | 15 (Good) | 13 (Good) | 7.8 (Good) | 9.1 (Good) | 10 (Good) | 12 (Good) | 26 (Good) | 23 (Good) | 14 (Good) | 12 (Good) | 15 (Good) | 17 (Good) | 11 (Good) | 10 (Good) | 6.9 (Good) | 21 (Good) | 32 (Good) |
PM2,5 228 (Sehr schlecht Gefährlich)
Feinstaub (PM2,5)PM10 327 (Sehr schlecht Gefährlich)
Feinstaub (PM10) SchwebestaubNO2 46 (Moderate)
Stickstoffdioxid (NO2)O3 1 (gut)
Ozon (O3)SO2 0.1 (gut)
Schwefeldioxid (SO2)CO 300 (gut)
Kohlenmonoxid (CO)Major Dhyan Chand National Stadium, Delhi - DPCC
| index | 2022-10-31 |
|---|---|
| pm25 | 228 |
| pm10 | 327 |
| no2 | 46 |
| o3 | 1 |
| so2 | 0.1 |
| co | 300 |
Major Dhyan Chand National Stadium, Delhi - DPCC

| index | 2020-05 | 2020-04 | 2020-03 | 2020-02 | 2020-01 | 2019-12 | 2019-11 | 2019-10 | 2019-09 | 2019-08 | 2019-07 | 2019-06 | 2019-05 | 2019-04 | 2019-02 | 2018-12 | 2018-11 | 2018-10 | 2018-09 | 2018-08 | 2018-05 | 2018-04 | 2018-03 |
|---|---|---|---|---|---|---|---|---|---|---|---|---|---|---|---|---|---|---|---|---|---|---|---|
| so2 | 19 | 19 | 19 | 18 | 13 | 12 | 15 | 13 | 7.8 | 9.1 | 10 | 12 | 26 | 23 | 14 | 12 | 15 | 17 | 11 | 10 | 6.9 | 21 | 32 |
| pm25 | 38 | 44 | 52 | 113 | 153 | 174 | 154 | 102 | 35 | 30 | 42 | 66 | 68 | 79 | 157 | 226 | 204 | 120 | 40 | 34 | 56 | 117 | 189 |
| pm10 | 86 | 92 | 108 | 200 | 232 | 316 | 278 | 215 | 88 | 76 | 136 | 188 | 235 | 265 | 307 | 413 | 326 | 269 | 91 | 81 | 187 | 204 | 210 |
| no2 | 15 | 17 | 36 | 61 | 61 | 85 | 98 | 72 | 36 | 37 | 38 | 51 | 69 | 77 | 91 | 79 | 83 | 84 | 39 | 38 | 51 | 71 | 82 |
| co | 464 | 452 | 750 | 1 | 1 | 1 | 2 | 1 | 1 | 1 | 1 | 1 | 1 | 1 | 2 | 3 | 2 | 2 | 969 | 824 | 1 | 39 | 65 |
| o3 | 30 | 25 | 19 | 19 | 14 | 15 | 12 | 17 | 15 | 14 | 22 | 52 | 50 | 34 | 21 | 11 | 38 | 49 | 24 | 26 | 79 | 59 | 28 |