Luftverschmutzung in Khora: Echtzeit-Luft-Qualitätsindex und Smog-Alarm.
Für die Khora. Heute ist Sonntag, 14. Dezember 2025. Für Khora wurden folgende Luftverschmutzungswerte gemessen:- Stickstoffdioxid (NO2) - 7 (gut)
- Ozon (O3) - 11 (gut)
- Kohlenmonoxid (CO) - 1900 (gut)
- Feinstaub (PM10) Schwebestaub - 124 (Sehr ungesund)
- Feinstaub (PM2,5) - 99 (Sehr ungesund)

Wie ist die Luftqualität Khora heute? Ist die Luft in Khora? verschmutzt. Gibt es Smog?
Wie hoch ist das NO2-Niveau? (Stickstoffdioxid (NO2))
7 (gut)
Wie ist das O3-Niveau heute in Khora? (Ozon (O3))
11 (gut)
Wie hoch ist der CO-Gehalt? (Kohlenmonoxid (CO))
1900 (gut)
Wie hoch ist der PM10-Stand heute in Khora? (Feinstaub (PM10) Schwebestaub)
Der aktuelle Feinstaubgehalt PM10 in Khora is:
124 (Sehr ungesund)
Die höchsten PM10-Werte treten in der Regel im Monat auf: 350 (Dezember 2019).
Der niedrigste Wert der Feinstaub-PM10-Belastung in Khora ist in der Regel in: August (82).
Wie hoch ist der aktuelle PM2,5-Wert in Khora? (Feinstaub (PM2,5))
Die heutige PM2.5-Stufe ist:
99 (Sehr ungesund)
Zum Vergleich: Der höchste PM2,5-Wert in Khora in den letzten 7 Tagen war: 52 (Mittwoch, 12. Oktober 2022) und der niedrigste: -18 (Montag, 10. Oktober 2022).
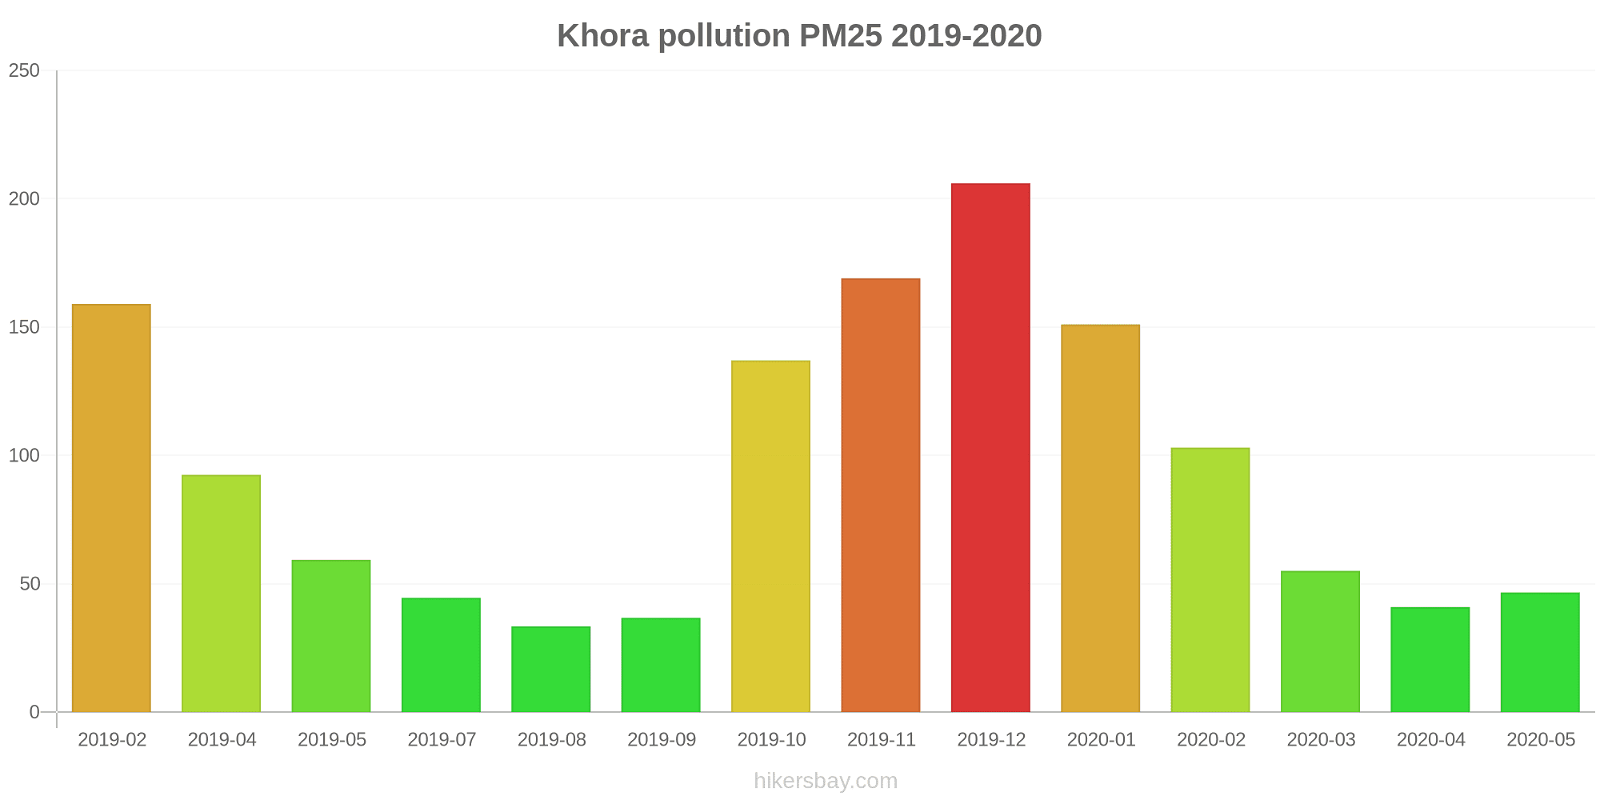
Die höchsten PM2,5-Werte wurden gemessen: 206 (Dezember 2019).
Die niedrigste Feinstaubbelastung PM2,5 tritt im Monat auf: August (33).
Aktuelle Daten Donnerstag, 13. Oktober 2022, 22:15
NO2 7 (gut)
O3 11 (gut)
CO 1900 (gut)
PM10 124 (Sehr ungesund)
PM2,5 99 (Sehr ungesund)
Daten zur Luftverschmutzung der letzten Tage in Khora
index
2022-10-07
2022-10-08
2022-10-09
2022-10-10
2022-10-11
2022-10-12
2022-10-13
pm10
19
Good
12
Good
0
Good
-86
Good
51
Unhealthy for Sensitive Groups
127
Very Unhealthy
117
Very Unhealthy
pm25
26
Moderate
12
Good
11
Good
-18
Good
22
Moderate
52
Unhealthy for Sensitive Groups
50
Unhealthy for Sensitive Groups
no2
7
Good
5
Good
8
Good
7
Good
7
Good
7
Good
7
Good
o3
23
Good
10
Good
24
Good
23
Good
30
Good
74
Moderate
12
Good
co
1785
Good
1790
Good
1702
Good
1670
Good
2024
Moderate
2173
Moderate
2030
Moderate
data source »
Luftverschmutzung in Khora von Februar 2019 bis Mai 2020

index
2020-05
2020-04
2020-03
2020-02
2020-01
2019-12
2019-11
2019-10
2019-09
2019-08
2019-07
2019-05
2019-04
2019-02
pm25
47 (Unhealthy for Sensitive Groups)
41 (Unhealthy for Sensitive Groups)
55 (Unhealthy)
103 (Very Unhealthy)
151 (Very bad Hazardous)
206 (Very bad Hazardous)
169 (Very bad Hazardous)
137 (Very bad Hazardous)
37 (Unhealthy for Sensitive Groups)
33 (Moderate)
45 (Unhealthy for Sensitive Groups)
59 (Unhealthy)
92 (Very Unhealthy)
159 (Very bad Hazardous)
pm10
91 (Unhealthy)
89 (Unhealthy)
120 (Very Unhealthy)
216 (Very bad Hazardous)
243 (Very bad Hazardous)
350 (Very bad Hazardous)
300 (Very bad Hazardous)
271 (Very bad Hazardous)
114 (Very Unhealthy)
82 (Unhealthy)
139 (Very Unhealthy)
212 (Very bad Hazardous)
299 (Very bad Hazardous)
305 (Very bad Hazardous)
no2
18 (Good)
14 (Good)
14 (Good)
15 (Good)
14 (Good)
14 (Good)
10 (Good)
16 (Good)
20 (Good)
29 (Good)
34 (Good)
- (Good)
13 (Good)
18 (Good)
o3
72 (Moderate)
61 (Good)
37 (Good)
37 (Good)
31 (Good)
85 (Moderate)
40 (Good)
75 (Moderate)
31 (Good)
28 (Good)
39 (Good)
23 (Good)
28 (Good)
44 (Good)
co
- (Good)
1 (Good)
1 (Good)
1 (Good)
1 (Good)
1 (Good)
1 (Good)
4 (Good)
620 (Good)
590 (Good)
907 (Good)
920 (Good)
857 (Good)
1 (Good)
data source »
Sector - 62, Noida, UP - IMD
Donnerstag, 13. Oktober 2022, 22:15
NO2 6.7 (gut)
Stickstoffdioxid (NO2)
O3 11 (gut)
Ozon (O3)
CO 1900 (gut)
Kohlenmonoxid (CO)
PM10 124 (Sehr ungesund)
Feinstaub (PM10) Schwebestaub
PM2,5 99 (Sehr ungesund)
Feinstaub (PM2,5)
Sector - 62, Noida, UP - IMD
index
2022-10-13
2022-10-12
2022-10-11
2022-10-10
2022-10-09
2022-10-08
2022-10-07
pm10
117
127
51
-86.47
0
12
19
pm25
50
52
22
-17.72
11
12
26
no2
6.9
6.8
6.6
6.6
7.7
5.4
7.4
o3
12
74
30
23
24
10
23
co
2030
2173
2024
1670
1702
1790
1785
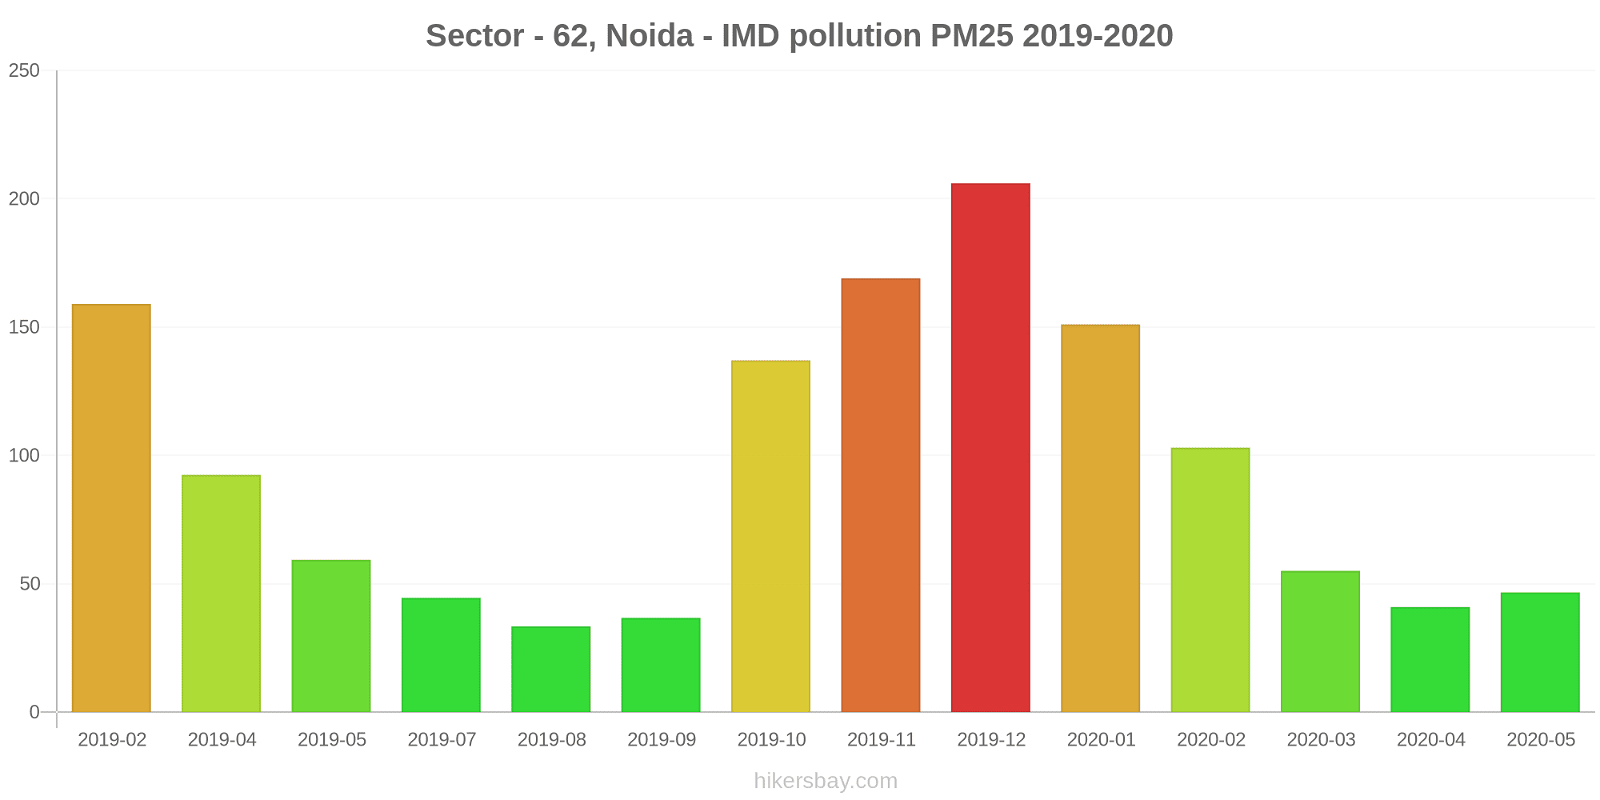
Sector - 62, Noida - IMD
2019-02 2020-05

index
2020-05
2020-04
2020-03
2020-02
2020-01
2019-12
2019-11
2019-10
2019-09
2019-08
2019-07
2019-05
2019-04
2019-02
pm25
47
41
55
103
151
206
169
137
37
33
45
59
92
159
pm10
91
89
120
216
243
350
300
271
114
82
139
212
299
305
no2
18
14
14
15
14
14
10
16
20
29
34
-
13
18
co
-
1
1
1
1
1
1
4
620
590
907
920
857
1
o3
72
61
37
37
31
85
40
75
31
28
39
23
28
44
* Pollution data source:
https://openaq.org
(caaqm)
The data is licensed under CC-By 4.0
NO2 7 (gut)
O3 11 (gut)
CO 1900 (gut)
PM10 124 (Sehr ungesund)
PM2,5 99 (Sehr ungesund)
Daten zur Luftverschmutzung der letzten Tage in Khora
| index | 2022-10-07 | 2022-10-08 | 2022-10-09 | 2022-10-10 | 2022-10-11 | 2022-10-12 | 2022-10-13 |
|---|---|---|---|---|---|---|---|
| pm10 | 19 Good |
12 Good |
0 Good |
-86 Good |
51 Unhealthy for Sensitive Groups |
127 Very Unhealthy |
117 Very Unhealthy |
| pm25 | 26 Moderate |
12 Good |
11 Good |
-18 Good |
22 Moderate |
52 Unhealthy for Sensitive Groups |
50 Unhealthy for Sensitive Groups |
| no2 | 7 Good |
5 Good |
8 Good |
7 Good |
7 Good |
7 Good |
7 Good |
| o3 | 23 Good |
10 Good |
24 Good |
23 Good |
30 Good |
74 Moderate |
12 Good |
| co | 1785 Good |
1790 Good |
1702 Good |
1670 Good |
2024 Moderate |
2173 Moderate |
2030 Moderate |

| index | 2020-05 | 2020-04 | 2020-03 | 2020-02 | 2020-01 | 2019-12 | 2019-11 | 2019-10 | 2019-09 | 2019-08 | 2019-07 | 2019-05 | 2019-04 | 2019-02 |
|---|---|---|---|---|---|---|---|---|---|---|---|---|---|---|
| pm25 | 47 (Unhealthy for Sensitive Groups) | 41 (Unhealthy for Sensitive Groups) | 55 (Unhealthy) | 103 (Very Unhealthy) | 151 (Very bad Hazardous) | 206 (Very bad Hazardous) | 169 (Very bad Hazardous) | 137 (Very bad Hazardous) | 37 (Unhealthy for Sensitive Groups) | 33 (Moderate) | 45 (Unhealthy for Sensitive Groups) | 59 (Unhealthy) | 92 (Very Unhealthy) | 159 (Very bad Hazardous) |
| pm10 | 91 (Unhealthy) | 89 (Unhealthy) | 120 (Very Unhealthy) | 216 (Very bad Hazardous) | 243 (Very bad Hazardous) | 350 (Very bad Hazardous) | 300 (Very bad Hazardous) | 271 (Very bad Hazardous) | 114 (Very Unhealthy) | 82 (Unhealthy) | 139 (Very Unhealthy) | 212 (Very bad Hazardous) | 299 (Very bad Hazardous) | 305 (Very bad Hazardous) |
| no2 | 18 (Good) | 14 (Good) | 14 (Good) | 15 (Good) | 14 (Good) | 14 (Good) | 10 (Good) | 16 (Good) | 20 (Good) | 29 (Good) | 34 (Good) | - (Good) | 13 (Good) | 18 (Good) |
| o3 | 72 (Moderate) | 61 (Good) | 37 (Good) | 37 (Good) | 31 (Good) | 85 (Moderate) | 40 (Good) | 75 (Moderate) | 31 (Good) | 28 (Good) | 39 (Good) | 23 (Good) | 28 (Good) | 44 (Good) |
| co | - (Good) | 1 (Good) | 1 (Good) | 1 (Good) | 1 (Good) | 1 (Good) | 1 (Good) | 4 (Good) | 620 (Good) | 590 (Good) | 907 (Good) | 920 (Good) | 857 (Good) | 1 (Good) |
NO2 6.7 (gut)
Stickstoffdioxid (NO2)O3 11 (gut)
Ozon (O3)CO 1900 (gut)
Kohlenmonoxid (CO)PM10 124 (Sehr ungesund)
Feinstaub (PM10) SchwebestaubPM2,5 99 (Sehr ungesund)
Feinstaub (PM2,5)Sector - 62, Noida, UP - IMD
| index | 2022-10-13 | 2022-10-12 | 2022-10-11 | 2022-10-10 | 2022-10-09 | 2022-10-08 | 2022-10-07 |
|---|---|---|---|---|---|---|---|
| pm10 | 117 | 127 | 51 | -86.47 | 0 | 12 | 19 |
| pm25 | 50 | 52 | 22 | -17.72 | 11 | 12 | 26 |
| no2 | 6.9 | 6.8 | 6.6 | 6.6 | 7.7 | 5.4 | 7.4 |
| o3 | 12 | 74 | 30 | 23 | 24 | 10 | 23 |
| co | 2030 | 2173 | 2024 | 1670 | 1702 | 1790 | 1785 |
Sector - 62, Noida - IMD

| index | 2020-05 | 2020-04 | 2020-03 | 2020-02 | 2020-01 | 2019-12 | 2019-11 | 2019-10 | 2019-09 | 2019-08 | 2019-07 | 2019-05 | 2019-04 | 2019-02 |
|---|---|---|---|---|---|---|---|---|---|---|---|---|---|---|
| pm25 | 47 | 41 | 55 | 103 | 151 | 206 | 169 | 137 | 37 | 33 | 45 | 59 | 92 | 159 |
| pm10 | 91 | 89 | 120 | 216 | 243 | 350 | 300 | 271 | 114 | 82 | 139 | 212 | 299 | 305 |
| no2 | 18 | 14 | 14 | 15 | 14 | 14 | 10 | 16 | 20 | 29 | 34 | - | 13 | 18 |
| co | - | 1 | 1 | 1 | 1 | 1 | 1 | 4 | 620 | 590 | 907 | 920 | 857 | 1 |
| o3 | 72 | 61 | 37 | 37 | 31 | 85 | 40 | 75 | 31 | 28 | 39 | 23 | 28 | 44 |