Luftverschmutzung in Bāspalli: Echtzeit-Luft-Qualitätsindex und Smog-Alarm.
Für die Bāspalli. Heute ist Sonntag, 14. Dezember 2025. Für Bāspalli wurden folgende Luftverschmutzungswerte gemessen:- Kohlenmonoxid (CO) - 2670 (Moderate)
- Feinstaub (PM2,5) - 83 (Sehr ungesund)
- Schwefeldioxid (SO2) - 21 (gut)
- Feinstaub (PM10) Schwebestaub - 135 (Sehr ungesund)
- Ozon (O3) - 1 (gut)
- Stickstoffdioxid (NO2) - 29 (gut)

Wie ist die Luftqualität Bāspalli heute? Ist die Luft in Bāspalli? verschmutzt. Gibt es Smog?
Wie hoch ist der CO-Gehalt? (Kohlenmonoxid (CO))
2670 (Moderate)
Wie hoch ist der aktuelle PM2,5-Wert in Bāspalli? (Feinstaub (PM2,5))
Die heutige PM2.5-Stufe ist:
83 (Sehr ungesund)
Zum Vergleich: Der höchste PM2,5-Wert in Bāspalli in den letzten 7 Tagen war: 82 (Montag, 31. Oktober 2022) und der niedrigste: 82 (Montag, 31. Oktober 2022).
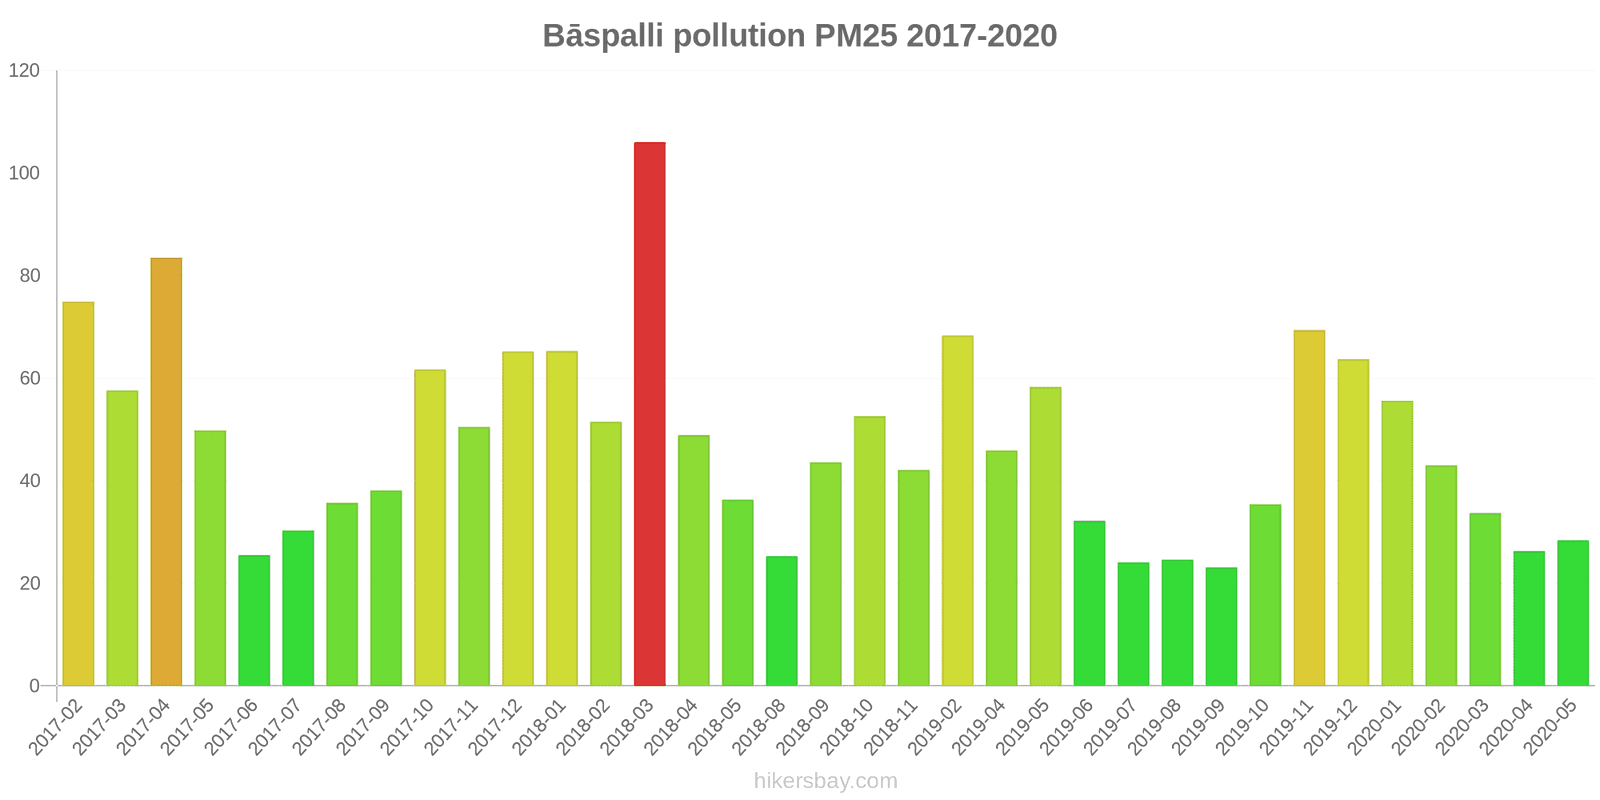
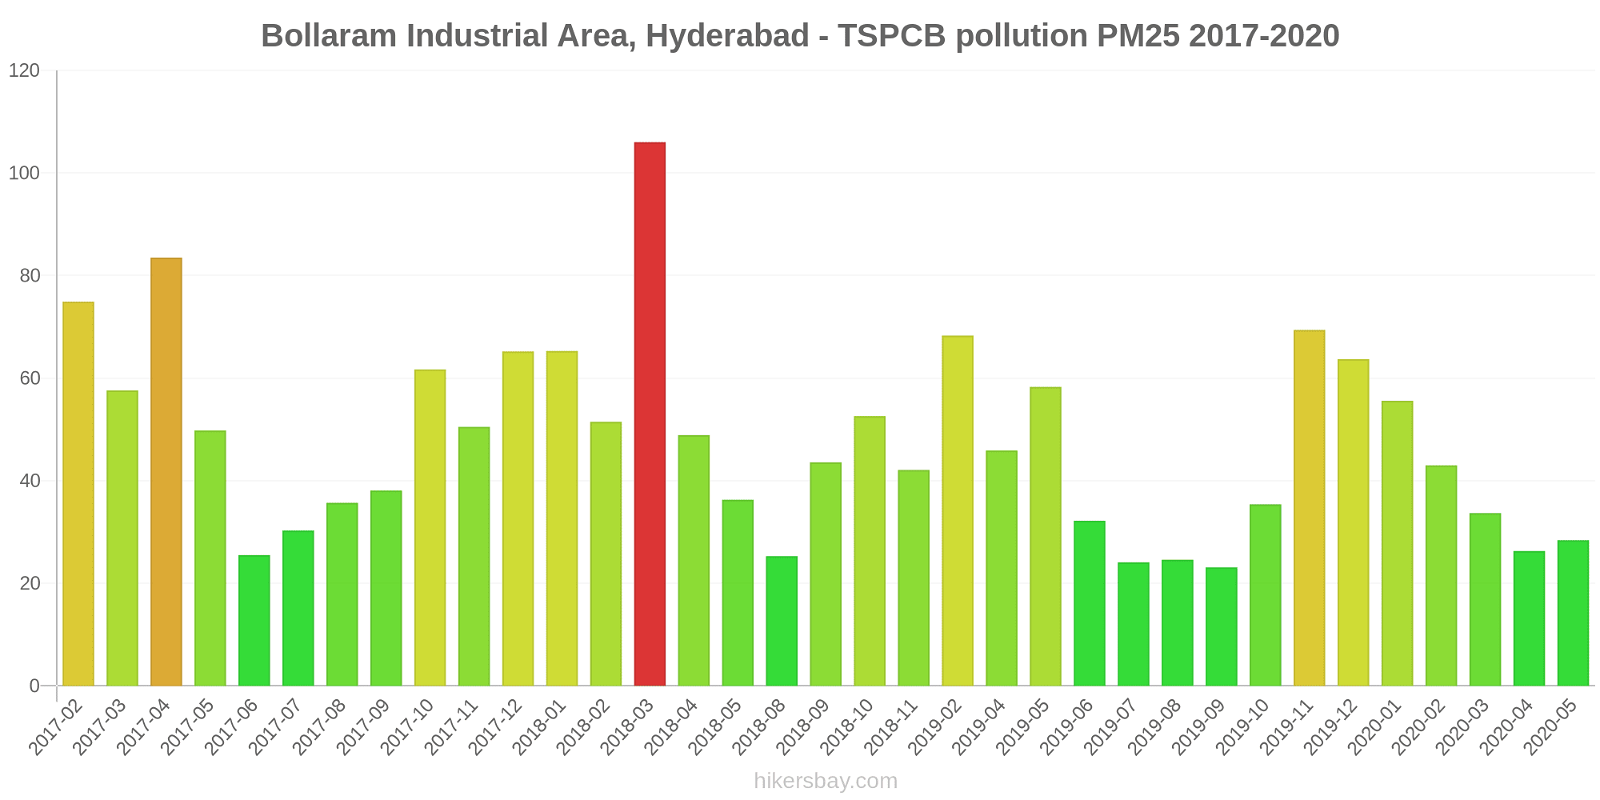
Die höchsten PM2,5-Werte wurden gemessen: 106 (März 2018).
Die niedrigste Feinstaubbelastung PM2,5 tritt im Monat auf: September (23).
Wie hoch ist die SO2-Belastung? (Schwefeldioxid (SO2))
21 (gut)
Wie hoch ist der PM10-Stand heute in Bāspalli? (Feinstaub (PM10) Schwebestaub)
Der aktuelle Feinstaubgehalt PM10 in Bāspalli is:
135 (Sehr ungesund)
Die höchsten PM10-Werte treten in der Regel im Monat auf: 200 (April 2017).
Der niedrigste Wert der Feinstaub-PM10-Belastung in Bāspalli ist in der Regel in: September (55).
Wie ist das O3-Niveau heute in Bāspalli? (Ozon (O3))
1 (gut)
Wie hoch ist das NO2-Niveau? (Stickstoffdioxid (NO2))
29 (gut)
Aktuelle Daten Montag, 31. Oktober 2022, 02:00
CO 2670 (Moderate)
PM2,5 83 (Sehr ungesund)
SO2 21 (gut)
PM10 135 (Sehr ungesund)
O3 1 (gut)
NO2 29 (gut)
Daten zur Luftverschmutzung der letzten Tage in Bāspalli
index
2022-10-31
co
2095
Moderate
pm25
82
Very Unhealthy
so2
11
Good
pm10
129
Very Unhealthy
o3
5
Good
no2
29
Good
data source »
Luftverschmutzung in Bāspalli von Februar 2017 bis Mai 2020

index
2020-05
2020-04
2020-03
2020-02
2020-01
2019-12
2019-11
2019-10
2019-09
2019-08
2019-07
2019-06
2019-05
2019-04
2019-02
2018-11
2018-10
2018-09
2018-08
2018-05
2018-04
2018-03
2018-02
2018-01
2017-12
2017-11
2017-10
2017-09
2017-08
2017-07
2017-06
2017-05
2017-04
2017-03
2017-02
pm25
28 (Moderate)
26 (Moderate)
34 (Moderate)
43 (Unhealthy for Sensitive Groups)
56 (Unhealthy)
64 (Unhealthy)
69 (Unhealthy)
35 (Unhealthy for Sensitive Groups)
23 (Moderate)
25 (Moderate)
24 (Moderate)
32 (Moderate)
58 (Unhealthy)
46 (Unhealthy for Sensitive Groups)
68 (Unhealthy)
42 (Unhealthy for Sensitive Groups)
53 (Unhealthy for Sensitive Groups)
44 (Unhealthy for Sensitive Groups)
25 (Moderate)
36 (Unhealthy for Sensitive Groups)
49 (Unhealthy for Sensitive Groups)
106 (Very Unhealthy)
52 (Unhealthy for Sensitive Groups)
65 (Unhealthy)
65 (Unhealthy)
51 (Unhealthy for Sensitive Groups)
62 (Unhealthy)
38 (Unhealthy for Sensitive Groups)
36 (Unhealthy for Sensitive Groups)
30 (Moderate)
26 (Moderate)
50 (Unhealthy for Sensitive Groups)
84 (Very Unhealthy)
58 (Unhealthy)
75 (Unhealthy)
pm10
69 (Unhealthy for Sensitive Groups)
55 (Unhealthy for Sensitive Groups)
80 (Unhealthy for Sensitive Groups)
102 (Unhealthy)
107 (Unhealthy)
122 (Very Unhealthy)
141 (Very Unhealthy)
74 (Unhealthy for Sensitive Groups)
55 (Unhealthy for Sensitive Groups)
71 (Unhealthy for Sensitive Groups)
65 (Unhealthy for Sensitive Groups)
61 (Unhealthy for Sensitive Groups)
159 (Very bad Hazardous)
124 (Very Unhealthy)
133 (Very Unhealthy)
86 (Unhealthy)
99 (Unhealthy)
93 (Unhealthy)
68 (Unhealthy for Sensitive Groups)
103 (Unhealthy)
106 (Unhealthy)
115 (Very Unhealthy)
122 (Very Unhealthy)
137 (Very Unhealthy)
123 (Very Unhealthy)
100 (Unhealthy)
121 (Very Unhealthy)
85 (Unhealthy)
83 (Unhealthy)
74 (Unhealthy for Sensitive Groups)
63 (Unhealthy for Sensitive Groups)
124 (Very Unhealthy)
200 (Very bad Hazardous)
134 (Very Unhealthy)
167 (Very bad Hazardous)
no2
18 (Good)
16 (Good)
22 (Good)
27 (Good)
29 (Good)
34 (Good)
34 (Good)
24 (Good)
23 (Good)
31 (Good)
27 (Good)
26 (Good)
33 (Good)
27 (Good)
24 (Good)
18 (Good)
19 (Good)
17 (Good)
13 (Good)
24 (Good)
30 (Good)
38 (Good)
35 (Good)
35 (Good)
36 (Good)
27 (Good)
28 (Good)
19 (Good)
15 (Good)
17 (Good)
19 (Good)
22 (Good)
35 (Good)
27 (Good)
38 (Good)
so2
14 (Good)
9 (Good)
17 (Good)
18 (Good)
13 (Good)
6.7 (Good)
10 (Good)
14 (Good)
23 (Good)
31 (Good)
22 (Good)
9 (Good)
18 (Good)
5.3 (Good)
12 (Good)
9.4 (Good)
13 (Good)
15 (Good)
18 (Good)
30 (Good)
28 (Good)
13 (Good)
14 (Good)
17 (Good)
14 (Good)
22 (Good)
39 (Good)
30 (Good)
37 (Good)
42 (Good)
39 (Good)
38 (Good)
57 (Moderate)
33 (Good)
64 (Moderate)
co
363 (Good)
329 (Good)
372 (Good)
419 (Good)
496 (Good)
576 (Good)
604 (Good)
517 (Good)
449 (Good)
347 (Good)
302 (Good)
389 (Good)
651 (Good)
550 (Good)
666 (Good)
452 (Good)
442 (Good)
426 (Good)
285 (Good)
413 (Good)
6 (Good)
37 (Good)
637 (Good)
743 (Good)
736 (Good)
514 (Good)
802 (Good)
413 (Good)
545 (Good)
246 (Good)
276 (Good)
505 (Good)
898 (Good)
832 (Good)
1 (Good)
o3
27 (Good)
29 (Good)
26 (Good)
29 (Good)
31 (Good)
34 (Good)
44 (Good)
31 (Good)
24 (Good)
23 (Good)
20 (Good)
19 (Good)
24 (Good)
36 (Good)
17 (Good)
20 (Good)
21 (Good)
12 (Good)
7.2 (Good)
43 (Good)
40 (Good)
37 (Good)
- (Good)
- (Good)
- (Good)
- (Good)
- (Good)
- (Good)
- (Good)
- (Good)
- (Good)
- (Good)
- (Good)
- (Good)
- (Good)
data source »
Bollaram Industrial Area, Hyderabad - TSPCB
Montag, 31. Oktober 2022, 02:00
CO 2670 (Moderate)
Kohlenmonoxid (CO)
PM2,5 83 (Sehr ungesund)
Feinstaub (PM2,5)
SO2 21 (gut)
Schwefeldioxid (SO2)
PM10 135 (Sehr ungesund)
Feinstaub (PM10) Schwebestaub
O3 0.7 (gut)
Ozon (O3)
NO2 29 (gut)
Stickstoffdioxid (NO2)
Bollaram Industrial Area, Hyderabad - TSPCB
index
2022-10-31
co
2095
pm25
82
so2
11
pm10
129
o3
4.8
no2
29
Bollaram Industrial Area, Hyderabad - TSPCB
2017-02 2020-05

index
2020-05
2020-04
2020-03
2020-02
2020-01
2019-12
2019-11
2019-10
2019-09
2019-08
2019-07
2019-06
2019-05
2019-04
2019-02
2018-11
2018-10
2018-09
2018-08
2018-05
2018-04
2018-03
2018-02
2018-01
2017-12
2017-11
2017-10
2017-09
2017-08
2017-07
2017-06
2017-05
2017-04
2017-03
2017-02
pm25
28
26
34
43
56
64
69
35
23
25
24
32
58
46
68
42
53
44
25
36
49
106
52
65
65
51
62
38
36
30
26
50
84
58
75
co
363
329
372
419
496
576
604
517
449
347
302
389
651
550
666
452
442
426
285
413
6
37
637
743
736
514
802
413
545
246
276
505
898
832
1
so2
14
9
17
18
13
6.7
10
14
23
31
22
9
18
5.3
12
9.4
13
15
18
30
28
13
14
17
14
22
39
30
37
42
39
38
57
33
64
pm10
69
55
80
102
107
122
141
74
55
71
65
61
159
124
133
86
99
93
68
103
106
115
122
137
123
100
121
85
83
74
63
124
200
134
167
no2
18
16
22
27
29
34
34
24
23
31
27
26
33
27
24
18
19
17
13
24
30
38
35
35
36
27
28
19
15
17
19
22
35
27
38
o3
27
29
26
29
31
34
44
31
24
23
20
19
24
36
17
20
21
12
7.2
43
40
37
-
-
-
-
-
-
-
-
-
-
-
-
-
* Pollution data source:
https://openaq.org
(caaqm)
The data is licensed under CC-By 4.0
CO 2670 (Moderate)
PM2,5 83 (Sehr ungesund)
SO2 21 (gut)
PM10 135 (Sehr ungesund)
O3 1 (gut)
NO2 29 (gut)
Daten zur Luftverschmutzung der letzten Tage in Bāspalli
| index | 2022-10-31 |
|---|---|
| co | 2095 Moderate |
| pm25 | 82 Very Unhealthy |
| so2 | 11 Good |
| pm10 | 129 Very Unhealthy |
| o3 | 5 Good |
| no2 | 29 Good |

| index | 2020-05 | 2020-04 | 2020-03 | 2020-02 | 2020-01 | 2019-12 | 2019-11 | 2019-10 | 2019-09 | 2019-08 | 2019-07 | 2019-06 | 2019-05 | 2019-04 | 2019-02 | 2018-11 | 2018-10 | 2018-09 | 2018-08 | 2018-05 | 2018-04 | 2018-03 | 2018-02 | 2018-01 | 2017-12 | 2017-11 | 2017-10 | 2017-09 | 2017-08 | 2017-07 | 2017-06 | 2017-05 | 2017-04 | 2017-03 | 2017-02 |
|---|---|---|---|---|---|---|---|---|---|---|---|---|---|---|---|---|---|---|---|---|---|---|---|---|---|---|---|---|---|---|---|---|---|---|---|
| pm25 | 28 (Moderate) | 26 (Moderate) | 34 (Moderate) | 43 (Unhealthy for Sensitive Groups) | 56 (Unhealthy) | 64 (Unhealthy) | 69 (Unhealthy) | 35 (Unhealthy for Sensitive Groups) | 23 (Moderate) | 25 (Moderate) | 24 (Moderate) | 32 (Moderate) | 58 (Unhealthy) | 46 (Unhealthy for Sensitive Groups) | 68 (Unhealthy) | 42 (Unhealthy for Sensitive Groups) | 53 (Unhealthy for Sensitive Groups) | 44 (Unhealthy for Sensitive Groups) | 25 (Moderate) | 36 (Unhealthy for Sensitive Groups) | 49 (Unhealthy for Sensitive Groups) | 106 (Very Unhealthy) | 52 (Unhealthy for Sensitive Groups) | 65 (Unhealthy) | 65 (Unhealthy) | 51 (Unhealthy for Sensitive Groups) | 62 (Unhealthy) | 38 (Unhealthy for Sensitive Groups) | 36 (Unhealthy for Sensitive Groups) | 30 (Moderate) | 26 (Moderate) | 50 (Unhealthy for Sensitive Groups) | 84 (Very Unhealthy) | 58 (Unhealthy) | 75 (Unhealthy) |
| pm10 | 69 (Unhealthy for Sensitive Groups) | 55 (Unhealthy for Sensitive Groups) | 80 (Unhealthy for Sensitive Groups) | 102 (Unhealthy) | 107 (Unhealthy) | 122 (Very Unhealthy) | 141 (Very Unhealthy) | 74 (Unhealthy for Sensitive Groups) | 55 (Unhealthy for Sensitive Groups) | 71 (Unhealthy for Sensitive Groups) | 65 (Unhealthy for Sensitive Groups) | 61 (Unhealthy for Sensitive Groups) | 159 (Very bad Hazardous) | 124 (Very Unhealthy) | 133 (Very Unhealthy) | 86 (Unhealthy) | 99 (Unhealthy) | 93 (Unhealthy) | 68 (Unhealthy for Sensitive Groups) | 103 (Unhealthy) | 106 (Unhealthy) | 115 (Very Unhealthy) | 122 (Very Unhealthy) | 137 (Very Unhealthy) | 123 (Very Unhealthy) | 100 (Unhealthy) | 121 (Very Unhealthy) | 85 (Unhealthy) | 83 (Unhealthy) | 74 (Unhealthy for Sensitive Groups) | 63 (Unhealthy for Sensitive Groups) | 124 (Very Unhealthy) | 200 (Very bad Hazardous) | 134 (Very Unhealthy) | 167 (Very bad Hazardous) |
| no2 | 18 (Good) | 16 (Good) | 22 (Good) | 27 (Good) | 29 (Good) | 34 (Good) | 34 (Good) | 24 (Good) | 23 (Good) | 31 (Good) | 27 (Good) | 26 (Good) | 33 (Good) | 27 (Good) | 24 (Good) | 18 (Good) | 19 (Good) | 17 (Good) | 13 (Good) | 24 (Good) | 30 (Good) | 38 (Good) | 35 (Good) | 35 (Good) | 36 (Good) | 27 (Good) | 28 (Good) | 19 (Good) | 15 (Good) | 17 (Good) | 19 (Good) | 22 (Good) | 35 (Good) | 27 (Good) | 38 (Good) |
| so2 | 14 (Good) | 9 (Good) | 17 (Good) | 18 (Good) | 13 (Good) | 6.7 (Good) | 10 (Good) | 14 (Good) | 23 (Good) | 31 (Good) | 22 (Good) | 9 (Good) | 18 (Good) | 5.3 (Good) | 12 (Good) | 9.4 (Good) | 13 (Good) | 15 (Good) | 18 (Good) | 30 (Good) | 28 (Good) | 13 (Good) | 14 (Good) | 17 (Good) | 14 (Good) | 22 (Good) | 39 (Good) | 30 (Good) | 37 (Good) | 42 (Good) | 39 (Good) | 38 (Good) | 57 (Moderate) | 33 (Good) | 64 (Moderate) |
| co | 363 (Good) | 329 (Good) | 372 (Good) | 419 (Good) | 496 (Good) | 576 (Good) | 604 (Good) | 517 (Good) | 449 (Good) | 347 (Good) | 302 (Good) | 389 (Good) | 651 (Good) | 550 (Good) | 666 (Good) | 452 (Good) | 442 (Good) | 426 (Good) | 285 (Good) | 413 (Good) | 6 (Good) | 37 (Good) | 637 (Good) | 743 (Good) | 736 (Good) | 514 (Good) | 802 (Good) | 413 (Good) | 545 (Good) | 246 (Good) | 276 (Good) | 505 (Good) | 898 (Good) | 832 (Good) | 1 (Good) |
| o3 | 27 (Good) | 29 (Good) | 26 (Good) | 29 (Good) | 31 (Good) | 34 (Good) | 44 (Good) | 31 (Good) | 24 (Good) | 23 (Good) | 20 (Good) | 19 (Good) | 24 (Good) | 36 (Good) | 17 (Good) | 20 (Good) | 21 (Good) | 12 (Good) | 7.2 (Good) | 43 (Good) | 40 (Good) | 37 (Good) | - (Good) | - (Good) | - (Good) | - (Good) | - (Good) | - (Good) | - (Good) | - (Good) | - (Good) | - (Good) | - (Good) | - (Good) | - (Good) |
CO 2670 (Moderate)
Kohlenmonoxid (CO)PM2,5 83 (Sehr ungesund)
Feinstaub (PM2,5)SO2 21 (gut)
Schwefeldioxid (SO2)PM10 135 (Sehr ungesund)
Feinstaub (PM10) SchwebestaubO3 0.7 (gut)
Ozon (O3)NO2 29 (gut)
Stickstoffdioxid (NO2)Bollaram Industrial Area, Hyderabad - TSPCB
| index | 2022-10-31 |
|---|---|
| co | 2095 |
| pm25 | 82 |
| so2 | 11 |
| pm10 | 129 |
| o3 | 4.8 |
| no2 | 29 |
Bollaram Industrial Area, Hyderabad - TSPCB

| index | 2020-05 | 2020-04 | 2020-03 | 2020-02 | 2020-01 | 2019-12 | 2019-11 | 2019-10 | 2019-09 | 2019-08 | 2019-07 | 2019-06 | 2019-05 | 2019-04 | 2019-02 | 2018-11 | 2018-10 | 2018-09 | 2018-08 | 2018-05 | 2018-04 | 2018-03 | 2018-02 | 2018-01 | 2017-12 | 2017-11 | 2017-10 | 2017-09 | 2017-08 | 2017-07 | 2017-06 | 2017-05 | 2017-04 | 2017-03 | 2017-02 |
|---|---|---|---|---|---|---|---|---|---|---|---|---|---|---|---|---|---|---|---|---|---|---|---|---|---|---|---|---|---|---|---|---|---|---|---|
| pm25 | 28 | 26 | 34 | 43 | 56 | 64 | 69 | 35 | 23 | 25 | 24 | 32 | 58 | 46 | 68 | 42 | 53 | 44 | 25 | 36 | 49 | 106 | 52 | 65 | 65 | 51 | 62 | 38 | 36 | 30 | 26 | 50 | 84 | 58 | 75 |
| co | 363 | 329 | 372 | 419 | 496 | 576 | 604 | 517 | 449 | 347 | 302 | 389 | 651 | 550 | 666 | 452 | 442 | 426 | 285 | 413 | 6 | 37 | 637 | 743 | 736 | 514 | 802 | 413 | 545 | 246 | 276 | 505 | 898 | 832 | 1 |
| so2 | 14 | 9 | 17 | 18 | 13 | 6.7 | 10 | 14 | 23 | 31 | 22 | 9 | 18 | 5.3 | 12 | 9.4 | 13 | 15 | 18 | 30 | 28 | 13 | 14 | 17 | 14 | 22 | 39 | 30 | 37 | 42 | 39 | 38 | 57 | 33 | 64 |
| pm10 | 69 | 55 | 80 | 102 | 107 | 122 | 141 | 74 | 55 | 71 | 65 | 61 | 159 | 124 | 133 | 86 | 99 | 93 | 68 | 103 | 106 | 115 | 122 | 137 | 123 | 100 | 121 | 85 | 83 | 74 | 63 | 124 | 200 | 134 | 167 |
| no2 | 18 | 16 | 22 | 27 | 29 | 34 | 34 | 24 | 23 | 31 | 27 | 26 | 33 | 27 | 24 | 18 | 19 | 17 | 13 | 24 | 30 | 38 | 35 | 35 | 36 | 27 | 28 | 19 | 15 | 17 | 19 | 22 | 35 | 27 | 38 |
| o3 | 27 | 29 | 26 | 29 | 31 | 34 | 44 | 31 | 24 | 23 | 20 | 19 | 24 | 36 | 17 | 20 | 21 | 12 | 7.2 | 43 | 40 | 37 | - | - | - | - | - | - | - | - | - | - | - | - | - |