Luftverschmutzung in Punjab: Echtzeit-Luft-Qualitätsindex und Smog-Alarm.
Für die Punjab. Heute ist Samstag, 13. Dezember 2025. Für Punjab wurden folgende Luftverschmutzungswerte gemessen:- Feinstaub (PM10) Schwebestaub - 144 (Sehr ungesund)
- Schwefeldioxid (SO2) - 13 (gut)
- Feinstaub (PM2,5) - 77 (Sehr ungesund)
- Kohlenmonoxid (CO) - 950 (gut)
- Stickstoffdioxid (NO2) - 27 (gut)
- Ozon (O3) - 25 (gut)

Wie ist die Luftqualität Punjab heute? Ist die Luft in Punjab? verschmutzt. Gibt es Smog?
Wie hoch ist der PM10-Stand heute in Punjab? (Feinstaub (PM10) Schwebestaub)
Der aktuelle Feinstaubgehalt PM10 in Punjab is:
144 (Sehr ungesund)
Die höchsten PM10-Werte treten in der Regel im Monat auf: 276 (November 2017).
Der niedrigste Wert der Feinstaub-PM10-Belastung in Punjab ist in der Regel in: April (53).
Wie hoch ist die SO2-Belastung? (Schwefeldioxid (SO2))
13 (gut)
Wie hoch ist der aktuelle PM2,5-Wert in Punjab? (Feinstaub (PM2,5))
Die heutige PM2.5-Stufe ist:
77 (Sehr ungesund)
Zum Vergleich: Der höchste PM2,5-Wert in Punjab in den letzten 7 Tagen war: 75 (Montag, 31. Oktober 2022) und der niedrigste: 75 (Montag, 31. Oktober 2022).
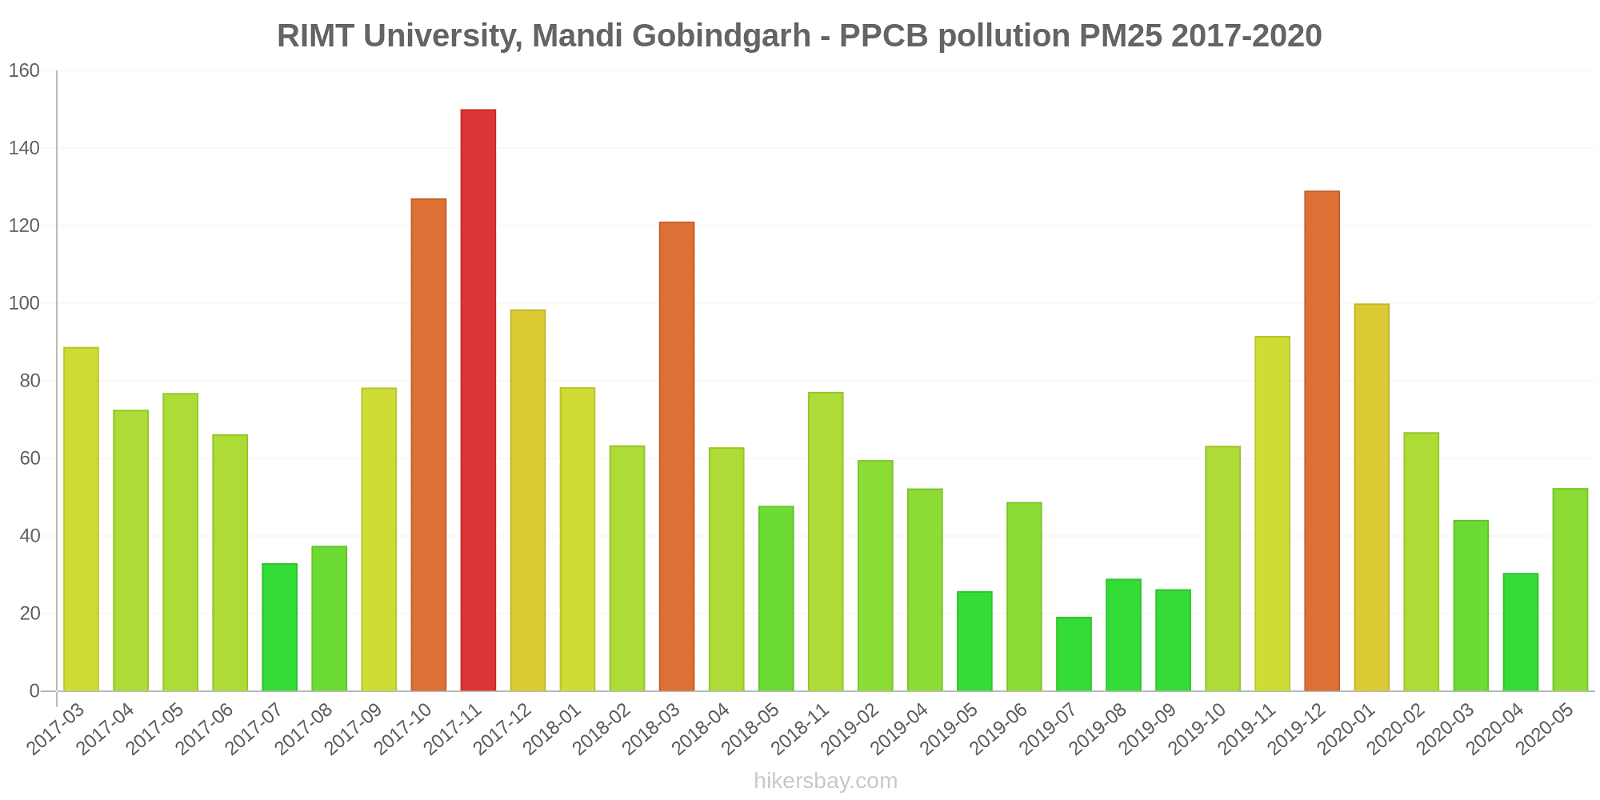
Die höchsten PM2,5-Werte wurden gemessen: 150 (November 2017).
Die niedrigste Feinstaubbelastung PM2,5 tritt im Monat auf: August (23).
Wie hoch ist der CO-Gehalt? (Kohlenmonoxid (CO))
950 (gut)
Wie hoch ist das NO2-Niveau? (Stickstoffdioxid (NO2))
27 (gut)
Wie ist das O3-Niveau heute in Punjab? (Ozon (O3))
25 (gut)
Aktuelle Daten Montag, 31. Oktober 2022, 02:00
PM10 144 (Sehr ungesund)
SO2 13 (gut)
PM2,5 77 (Sehr ungesund)
CO 950 (gut)
NO2 27 (gut)
O3 25 (gut)
Daten zur Luftverschmutzung der letzten Tage in Punjab
index
2022-10-31
pm10
137
Very Unhealthy
so2
13
Good
pm25
75
Very Unhealthy
co
1022
Good
no2
28
Good
o3
24
Good
data source »
Luftverschmutzung in Punjab von März 2017 bis Mai 2020
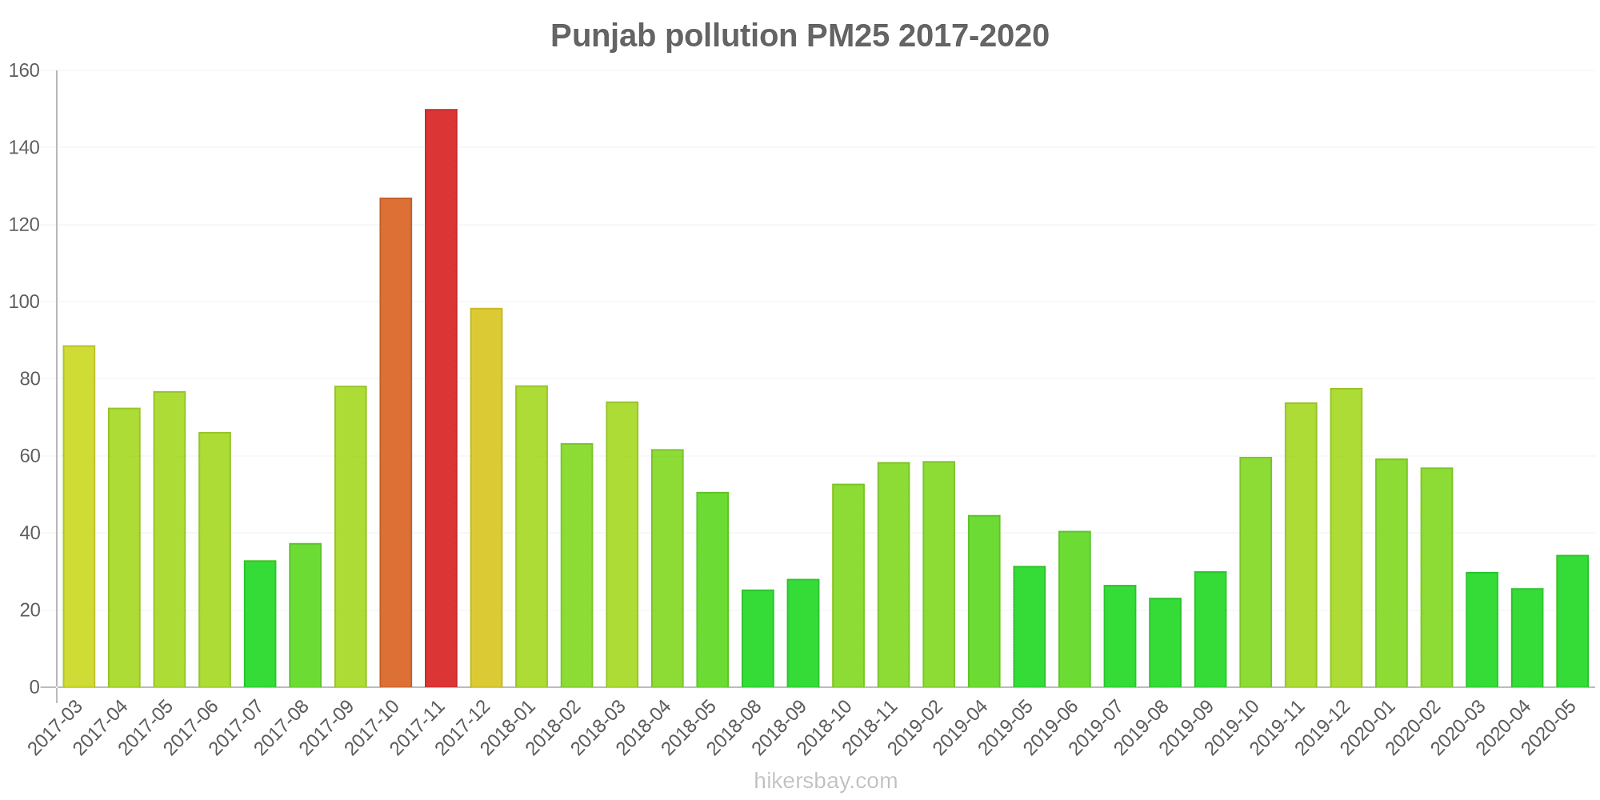
index
2020-05
2020-04
2020-03
2020-02
2020-01
2019-12
2019-11
2019-10
2019-09
2019-08
2019-07
2019-06
2019-05
2019-04
2019-02
2018-11
2018-10
2018-09
2018-08
2018-05
2018-04
2018-03
2018-02
2018-01
2017-12
2017-11
2017-10
2017-09
2017-08
2017-07
2017-06
2017-05
2017-04
2017-03
pm25
34 (Moderate)
26 (Moderate)
30 (Moderate)
57 (Unhealthy)
59 (Unhealthy)
78 (Very Unhealthy)
74 (Unhealthy)
60 (Unhealthy)
30 (Moderate)
23 (Moderate)
27 (Moderate)
41 (Unhealthy for Sensitive Groups)
31 (Moderate)
45 (Unhealthy for Sensitive Groups)
59 (Unhealthy)
58 (Unhealthy)
53 (Unhealthy for Sensitive Groups)
28 (Moderate)
25 (Moderate)
51 (Unhealthy for Sensitive Groups)
62 (Unhealthy)
74 (Unhealthy)
63 (Unhealthy)
78 (Very Unhealthy)
98 (Very Unhealthy)
150 (Very bad Hazardous)
127 (Very bad Hazardous)
78 (Very Unhealthy)
37 (Unhealthy for Sensitive Groups)
33 (Moderate)
66 (Unhealthy)
77 (Very Unhealthy)
73 (Unhealthy)
89 (Very Unhealthy)
pm10
82 (Unhealthy)
53 (Unhealthy for Sensitive Groups)
68 (Unhealthy for Sensitive Groups)
111 (Very Unhealthy)
103 (Unhealthy)
137 (Very Unhealthy)
153 (Very bad Hazardous)
121 (Very Unhealthy)
69 (Unhealthy for Sensitive Groups)
61 (Unhealthy for Sensitive Groups)
68 (Unhealthy for Sensitive Groups)
110 (Very Unhealthy)
86 (Unhealthy)
142 (Very Unhealthy)
139 (Very Unhealthy)
119 (Very Unhealthy)
112 (Very Unhealthy)
55 (Unhealthy for Sensitive Groups)
54 (Unhealthy for Sensitive Groups)
118 (Very Unhealthy)
131 (Very Unhealthy)
98 (Unhealthy)
100 (Unhealthy)
131 (Very Unhealthy)
160 (Very bad Hazardous)
276 (Very bad Hazardous)
236 (Very bad Hazardous)
155 (Very bad Hazardous)
100 (Unhealthy)
125 (Very Unhealthy)
173 (Very bad Hazardous)
212 (Very bad Hazardous)
193 (Very bad Hazardous)
202 (Very bad Hazardous)
no2
24 (Good)
12 (Good)
16 (Good)
16 (Good)
16 (Good)
18 (Good)
28 (Good)
25 (Good)
16 (Good)
15 (Good)
19 (Good)
26 (Good)
24 (Good)
19 (Good)
17 (Good)
23 (Good)
20 (Good)
14 (Good)
13 (Good)
20 (Good)
18 (Good)
23 (Good)
45 (Moderate)
26 (Good)
60 (Moderate)
103 (Unhealthy for Sensitive Groups)
37 (Good)
11 (Good)
11 (Good)
12 (Good)
36 (Good)
11 (Good)
32 (Good)
35 (Good)
so2
10 (Good)
7.5 (Good)
11 (Good)
15 (Good)
12 (Good)
11 (Good)
15 (Good)
9.8 (Good)
9.1 (Good)
9.6 (Good)
23 (Good)
9.7 (Good)
11 (Good)
11 (Good)
7.8 (Good)
12 (Good)
8.2 (Good)
7.3 (Good)
12 (Good)
14 (Good)
17 (Good)
13 (Good)
8.3 (Good)
13 (Good)
9.6 (Good)
8.4 (Good)
7.8 (Good)
16 (Good)
4.2 (Good)
12 (Good)
29 (Good)
22 (Good)
13 (Good)
12 (Good)
co
531 (Good)
333 (Good)
402 (Good)
541 (Good)
449 (Good)
463 (Good)
376 (Good)
357 (Good)
411 (Good)
501 (Good)
260 (Good)
573 (Good)
396 (Good)
520 (Good)
583 (Good)
360 (Good)
387 (Good)
419 (Good)
497 (Good)
555 (Good)
18 (Good)
48 (Good)
1 (Good)
1 (Good)
1 (Good)
966 (Good)
793 (Good)
871 (Good)
525 (Good)
813 (Good)
783 (Good)
542 (Good)
662 (Good)
522 (Good)
o3
26 (Good)
24 (Good)
18 (Good)
21 (Good)
16 (Good)
14 (Good)
14 (Good)
32 (Good)
20 (Good)
16 (Good)
20 (Good)
22 (Good)
26 (Good)
24 (Good)
14 (Good)
15 (Good)
22 (Good)
20 (Good)
24 (Good)
20 (Good)
22 (Good)
18 (Good)
- (Good)
- (Good)
- (Good)
- (Good)
- (Good)
- (Good)
- (Good)
- (Good)
- (Good)
- (Good)
- (Good)
- (Good)
data source »
Lebensqualität in Punjab
Grün und Parks in der Stadt
Punjab
51 %
Népal: 32 %
Bangladesch: 33 %
Bhutan: 82 %
Sri Lanka: 59 %
Pakistan: 49 %
Feinstaub PM2,5
Punjab
82 (Very Unhealthy)
Vergnügen, Zeit in der Stadt zu verbringen
Punjab
38 %
Népal: 32 %
Bangladesch: 26 %
Bhutan: 61 %
Sri Lanka: 52 %
Pakistan: 43 %
Feinstaub PM10
Punjab
150 (Very bad Hazardous)
Luftverschmutzung
Punjab
68 %
Népal: 76 %
Bangladesch: 78 %
Bhutan: 45 %
Sri Lanka: 53 %
Pakistan: 64 %
Müllentsorgung
Punjab
27 %
Népal: 25 %
Bangladesch: 22 %
Bhutan: 47 %
Sri Lanka: 41 %
Pakistan: 34 %
Verfügbarkeit und Qualität von Trinkwasser
Punjab
53 %
Népal: 36 %
Bangladesch: 44 %
Bhutan: 64 %
Sri Lanka: 65 %
Pakistan: 44 %
Sauberkeit und Ordentlichkeit
Punjab
38 %
Népal: 27 %
Bangladesch: 23 %
Bhutan: 57 %
Sri Lanka: 52 %
Pakistan: 40 %
Lärm und Lichtverschmutzung
Punjab
58 %
Népal: 55 %
Bangladesch: 63 %
Bhutan: 55 %
Sri Lanka: 50 %
Pakistan: 59 %
Wasserverschmutzung
Punjab
65 %
Népal: 76 %
Bangladesch: 74 %
Bhutan: 56 %
Sri Lanka: 57 %
Pakistan: 70 %
Source: Numbeo
Civil Line, Jalandhar - PPCB
Montag, 31. Oktober 2022, 02:00
PM10 103 (ungesund)
Feinstaub (PM10) Schwebestaub
SO2 16 (gut)
Schwefeldioxid (SO2)
PM2,5 56 (ungesund)
Feinstaub (PM2,5)
CO 720 (gut)
Kohlenmonoxid (CO)
NO2 25 (gut)
Stickstoffdioxid (NO2)
O3 7.2 (gut)
Ozon (O3)
Golden Temple, Amritsar - PPCB
Montag, 31. Oktober 2022, 02:00
PM10 138 (Sehr ungesund)
Feinstaub (PM10) Schwebestaub
SO2 7.2 (gut)
Schwefeldioxid (SO2)
PM2,5 129 (Sehr schlecht Gefährlich)
Feinstaub (PM2,5)
CO 580 (gut)
Kohlenmonoxid (CO)
NO2 58 (Moderate)
Stickstoffdioxid (NO2)
O3 15 (gut)
Ozon (O3)
Hardev Nagar, Bathinda - PPCB
Montag, 31. Oktober 2022, 01:45
CO 950 (gut)
Kohlenmonoxid (CO)
PM2,5 48 (Ungesund für sensible Gruppen)
Feinstaub (PM2,5)
PM10 109 (ungesund)
Feinstaub (PM10) Schwebestaub
NO2 22 (gut)
Stickstoffdioxid (NO2)
SO2 34 (gut)
Schwefeldioxid (SO2)
Kalal Majra, Khanna - PPCB
Montag, 31. Oktober 2022, 01:00
PM2,5 55 (Ungesund für sensible Gruppen)
Feinstaub (PM2,5)
PM10 155 (Sehr schlecht Gefährlich)
Feinstaub (PM10) Schwebestaub
NO2 23 (gut)
Stickstoffdioxid (NO2)
SO2 8 (gut)
Schwefeldioxid (SO2)
CO 0.75 (gut)
Kohlenmonoxid (CO)
O3 21 (gut)
Ozon (O3)
Model Town, Patiala - PPCB
Montag, 31. Oktober 2022, 01:45
PM10 171 (Sehr schlecht Gefährlich)
Feinstaub (PM10) Schwebestaub
SO2 8.8 (gut)
Schwefeldioxid (SO2)
PM2,5 93 (Sehr ungesund)
Feinstaub (PM2,5)
CO 2060 (Moderate)
Kohlenmonoxid (CO)
NO2 21 (gut)
Stickstoffdioxid (NO2)
O3 28 (gut)
Ozon (O3)
Punjab Agricultural University, Ludhiana - PPCB
Montag, 31. Oktober 2022, 02:00
SO2 6 (gut)
Schwefeldioxid (SO2)
PM2,5 99 (Sehr ungesund)
Feinstaub (PM2,5)
NO2 21 (gut)
Stickstoffdioxid (NO2)
PM10 188 (Sehr schlecht Gefährlich)
Feinstaub (PM10) Schwebestaub
CO 1680 (gut)
Kohlenmonoxid (CO)
O3 8.7 (gut)
Ozon (O3)
RIMT University, Mandi Gobindgarh - PPCB
Montag, 31. Oktober 2022, 02:00
PM2,5 60 (ungesund)
Feinstaub (PM2,5)
PM10 142 (Sehr ungesund)
Feinstaub (PM10) Schwebestaub
NO2 20 (gut)
Stickstoffdioxid (NO2)
SO2 14 (gut)
Schwefeldioxid (SO2)
CO 660 (gut)
Kohlenmonoxid (CO)
O3 68 (gut)
Ozon (O3)
Civil Line, Jalandhar - PPCB
index
2022-10-31
pm10
104
so2
16
pm25
56
co
705
no2
25
o3
7.1
Golden Temple, Amritsar - PPCB
index
2022-10-31
pm10
126
so2
7.7
pm25
110
co
620
no2
63
o3
15
Hardev Nagar, Bathinda - PPCB
index
2022-10-31
co
1450
pm25
48
pm10
71
no2
21
so2
34
Kalal Majra, Khanna - PPCB
index
2022-10-31
pm25
55
pm10
155
no2
23
so2
8
co
0.75
o3
21
Model Town, Patiala - PPCB
index
2022-10-31
pm10
170
so2
8.6
pm25
94
co
2045
no2
23
o3
27
Punjab Agricultural University, Ludhiana - PPCB
index
2022-10-31
so2
5.7
pm25
100
no2
20
pm10
190
co
1675
o3
7.3
RIMT University, Mandi Gobindgarh - PPCB
index
2022-10-31
pm25
60
pm10
142
no2
20
so2
14
co
660
o3
68
Civil Line, Jalandhar - PPCB
2018-03 2020-05
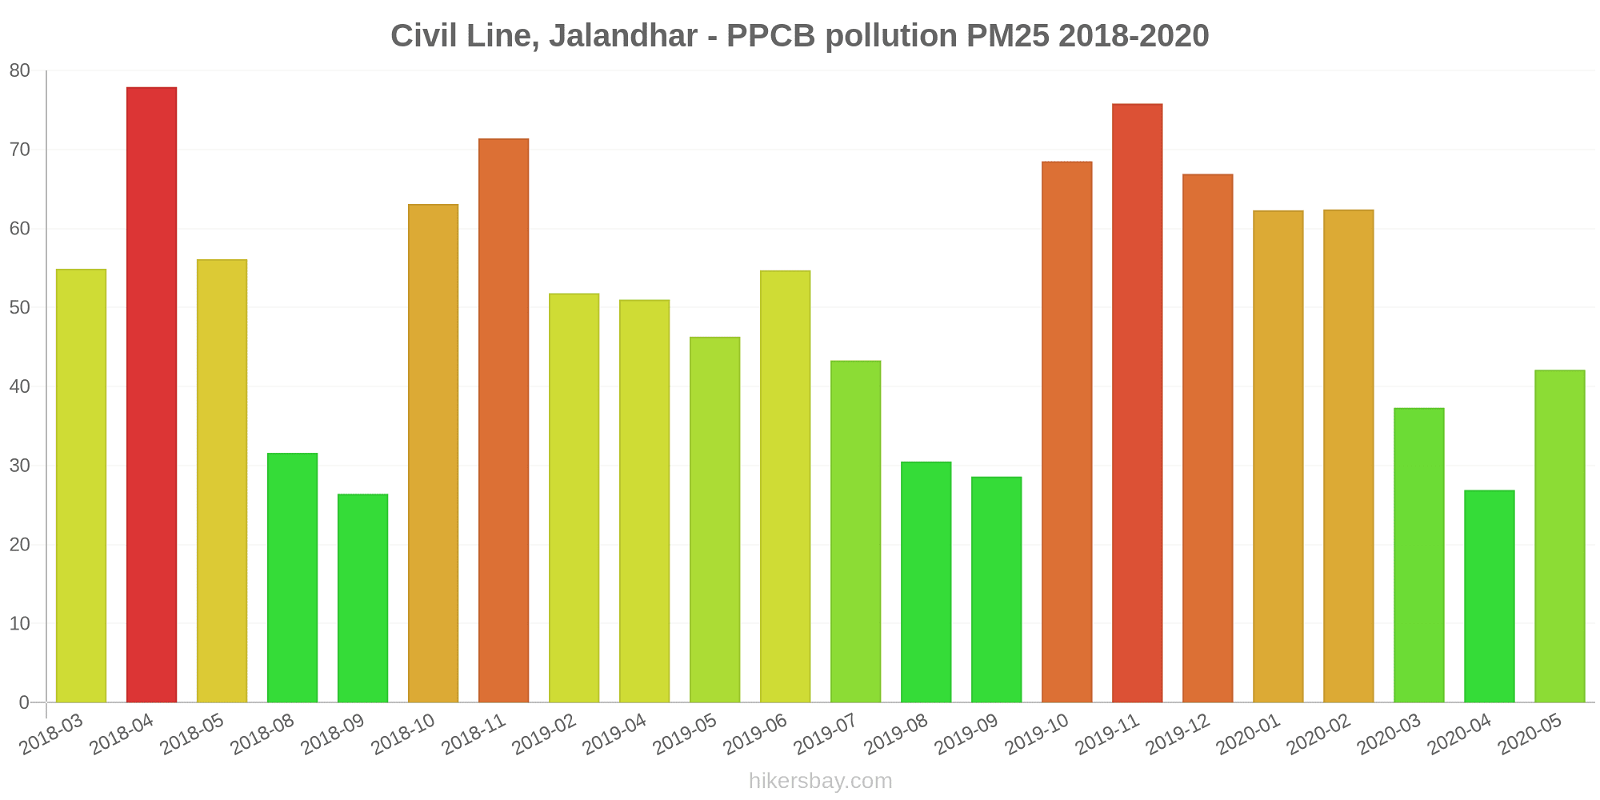
index
2020-05
2020-04
2020-03
2020-02
2020-01
2019-12
2019-11
2019-10
2019-09
2019-08
2019-07
2019-06
2019-05
2019-04
2019-02
2018-11
2018-10
2018-09
2018-08
2018-05
2018-04
2018-03
pm25
42
27
37
62
62
67
76
69
29
31
43
55
46
51
52
71
63
26
32
56
78
55
pm10
72
46
63
107
108
115
131
118
70
112
121
128
113
171
178
112
104
43
52
92
112
103
co
420
319
655
807
760
739
881
829
857
880
1
478
822
906
927
666
754
658
812
954
27
54
o3
23
21
19
25
18
14
15
23
15
15
26
27
18
13
15
17
22
16
24
16
23
17
no2
5.8
9
8.3
15
24
17
36
25
30
20
30
28
28
31
9.1
17
23
26
12
15
8.3
22
so2
9.2
12
11
9.3
8.6
11
13
15
16
34
131
11
23
6.2
11
6.4
7.5
7.6
8.1
-
-
18
Golden Temple, Amritsar - PPCB
2018-03 2020-05
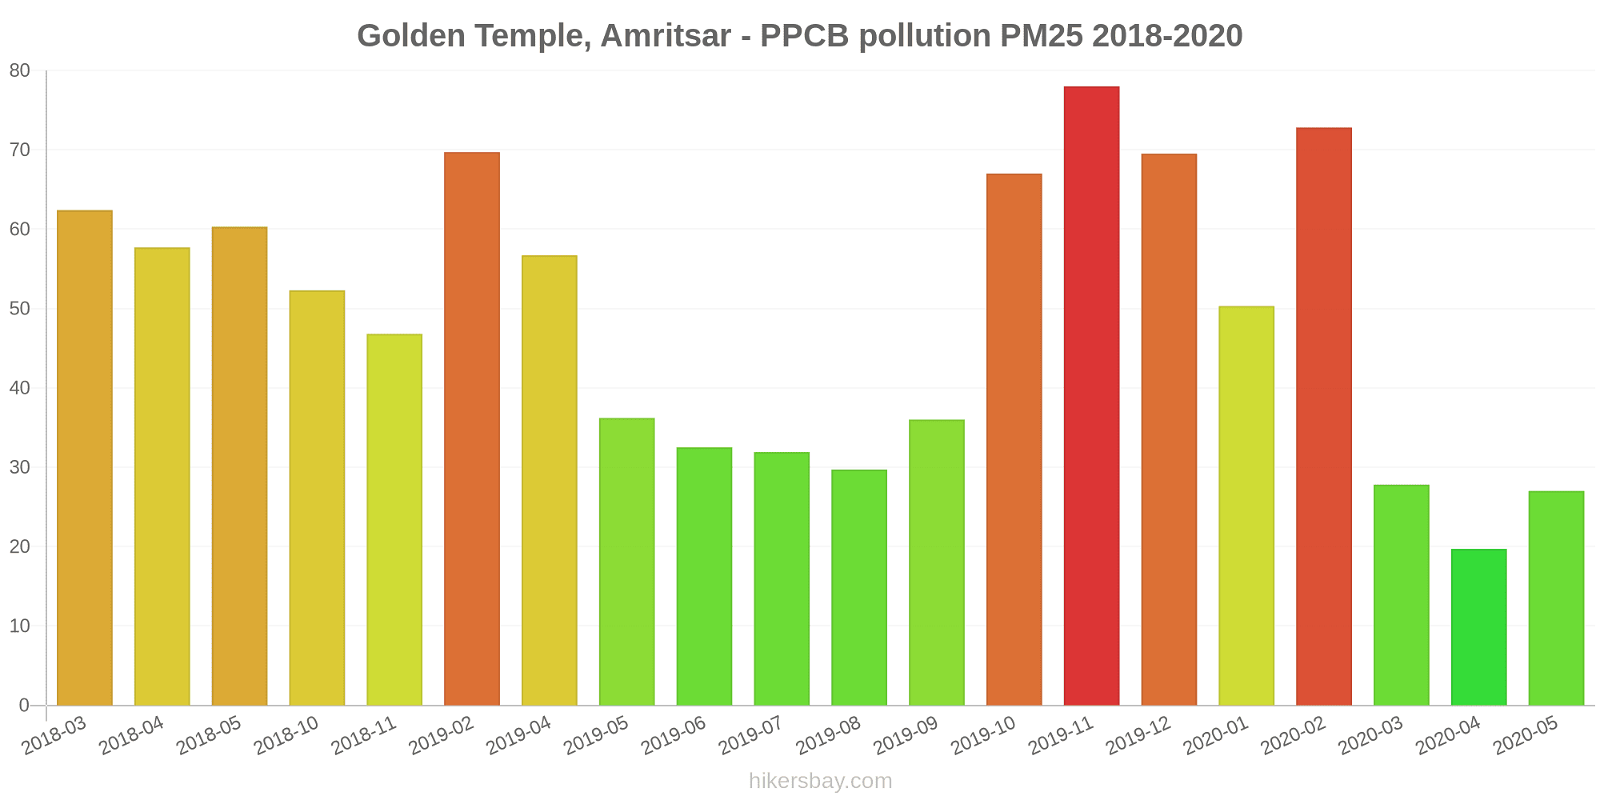
index
2020-05
2020-04
2020-03
2020-02
2020-01
2019-12
2019-11
2019-10
2019-09
2019-08
2019-07
2019-06
2019-05
2019-04
2019-02
2018-11
2018-10
2018-09
2018-08
2018-05
2018-04
2018-03
co
761
746
735
666
624
633
614
442
824
413
371
665
762
849
-
426
66
-
346
799
11
43
o3
37
35
29
34
35
27
14
103
29
17
18
20
32
24
11
18
21
20
32
-
-
28
pm25
27
20
28
73
50
70
78
67
36
30
32
33
36
57
70
47
52
-
-
60
58
62
pm10
79
58
84
127
86
98
155
116
67
56
63
102
90
136
126
126
141
53
53
134
130
108
no2
20
15
12
14
10
12
10
13
11
9.6
12
9.2
17
16
19
31
21
9.5
13
8.5
13
13
so2
9.1
8.8
11
9.7
9.1
8.7
13
11
12
6.6
7.5
9.8
-
-
-
3.4
5.9
3.6
7
6.1
5.6
4.1
Hardev Nagar, Bathinda - PPCB
2018-08 2020-05
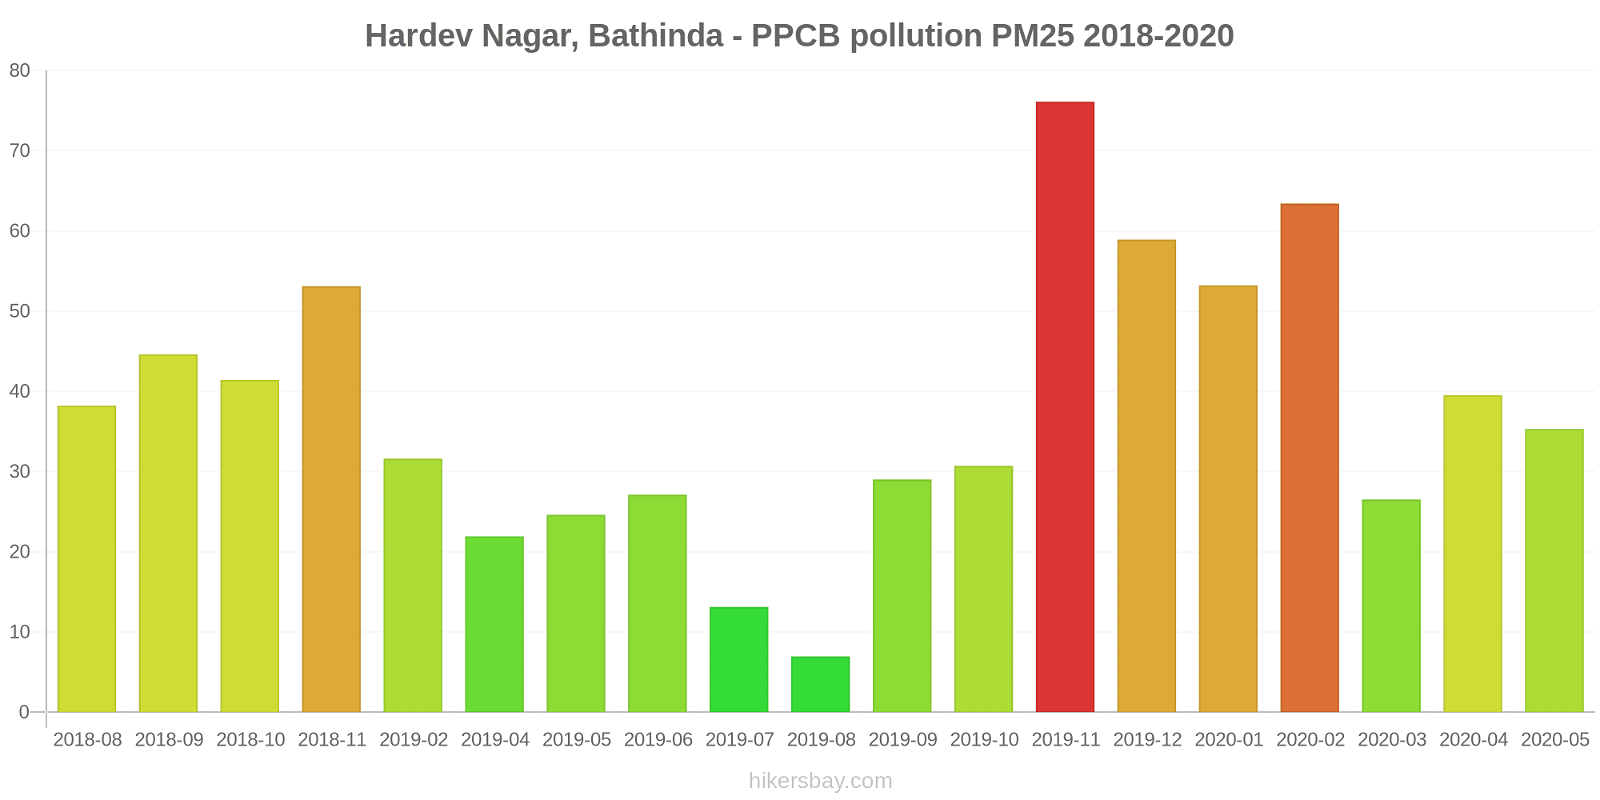
index
2020-05
2020-04
2020-03
2020-02
2020-01
2019-12
2019-11
2019-10
2019-09
2019-08
2019-07
2019-06
2019-05
2019-04
2019-02
2018-11
2018-10
2018-09
2018-08
pm25
35
40
27
63
53
59
76
31
29
6.9
13
27
25
22
32
53
41
45
38
pm10
76
55
83
118
92
159
149
111
64
14
45
88
106
124
118
120
100
68
59
no2
18
18
18
18
18
18
23
23
23
23
21
20
21
21
18
14
16
9.6
10
so2
9.6
8.8
8.6
5.3
7.4
7.4
7.1
6.7
6.5
4.6
4.4
15
4.4
5.3
3.1
18
3
6.1
6.6
co
502
1
2
1
1
1
2
2
1
-
1
966
1
953
575
218
200
128
392
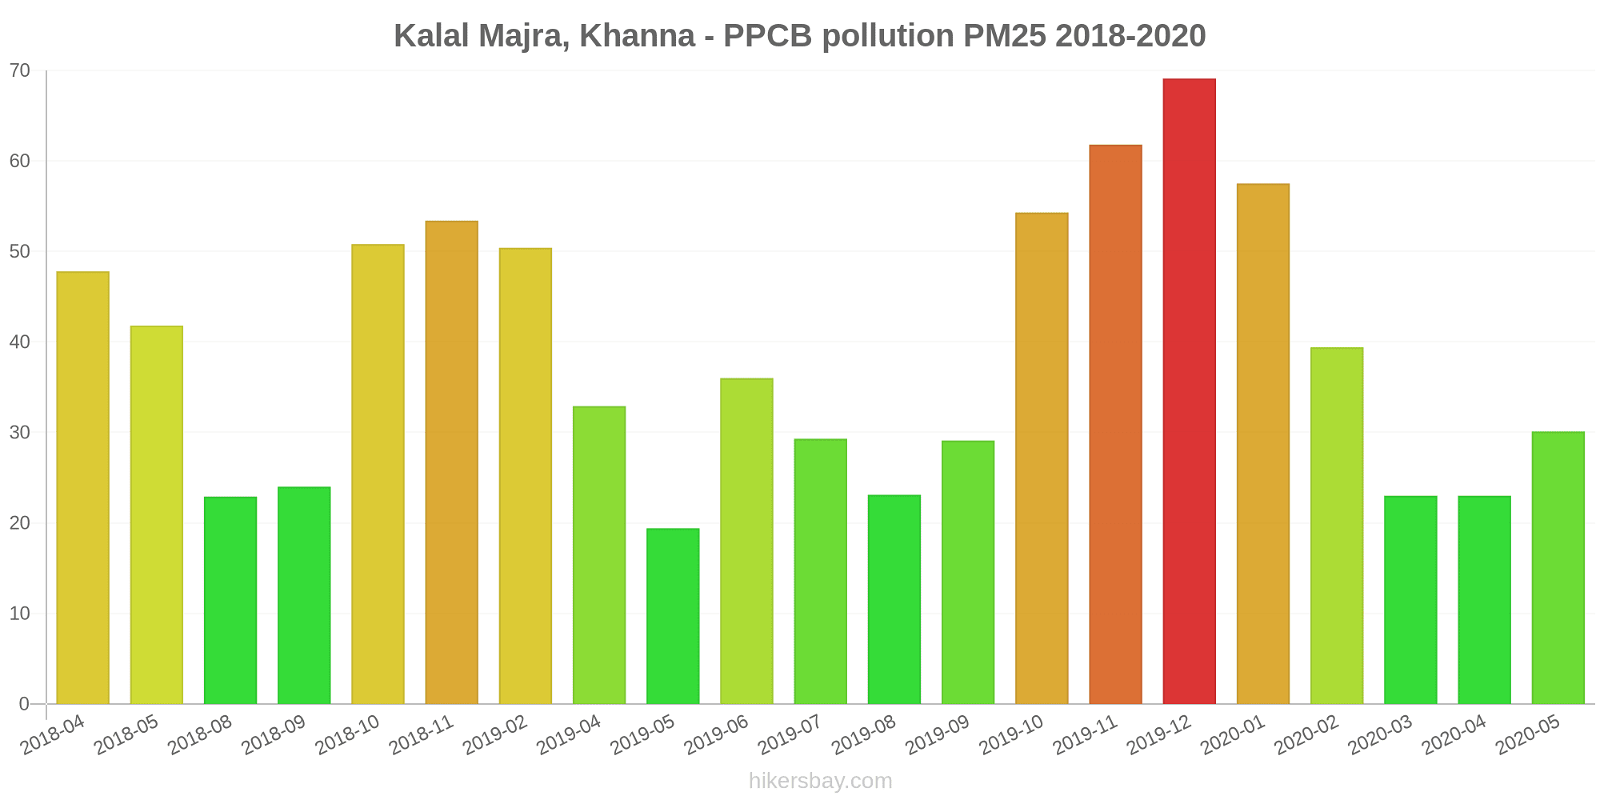
Kalal Majra, Khanna - PPCB
2018-04 2020-05
index
2020-05
2020-04
2020-03
2020-02
2020-01
2019-12
2019-11
2019-10
2019-09
2019-08
2019-07
2019-06
2019-05
2019-04
2019-02
2018-11
2018-10
2018-09
2018-08
2018-05
2018-04
pm25
30
23
23
39
58
69
62
54
29
23
29
36
19
33
50
53
51
24
23
42
48
pm10
82
50
51
81
103
156
152
126
53
45
60
100
54
126
106
118
117
50
54
111
161
co
-
-
1.2
-
0.42
0.76
0.74
0.51
0.87
0.88
0.86
0.69
-
0.19
0.35
0.59
0.61
0.41
0.46
0.79
0.78
o3
22
18
17
16
11
8.2
6.9
21
24
13
21
26
16
16
7.5
14
29
26
22
32
43
no2
6.6
6.4
12
13
8.2
26
32
39
8.9
18
28
26
6.5
7.3
8.9
47
46
11
7.6
7.6
15
so2
7.4
7.1
15
13
11
12
21
11
6.5
4.9
4.6
6.2
13
17
9.3
22
13
7.2
4.5
17
37
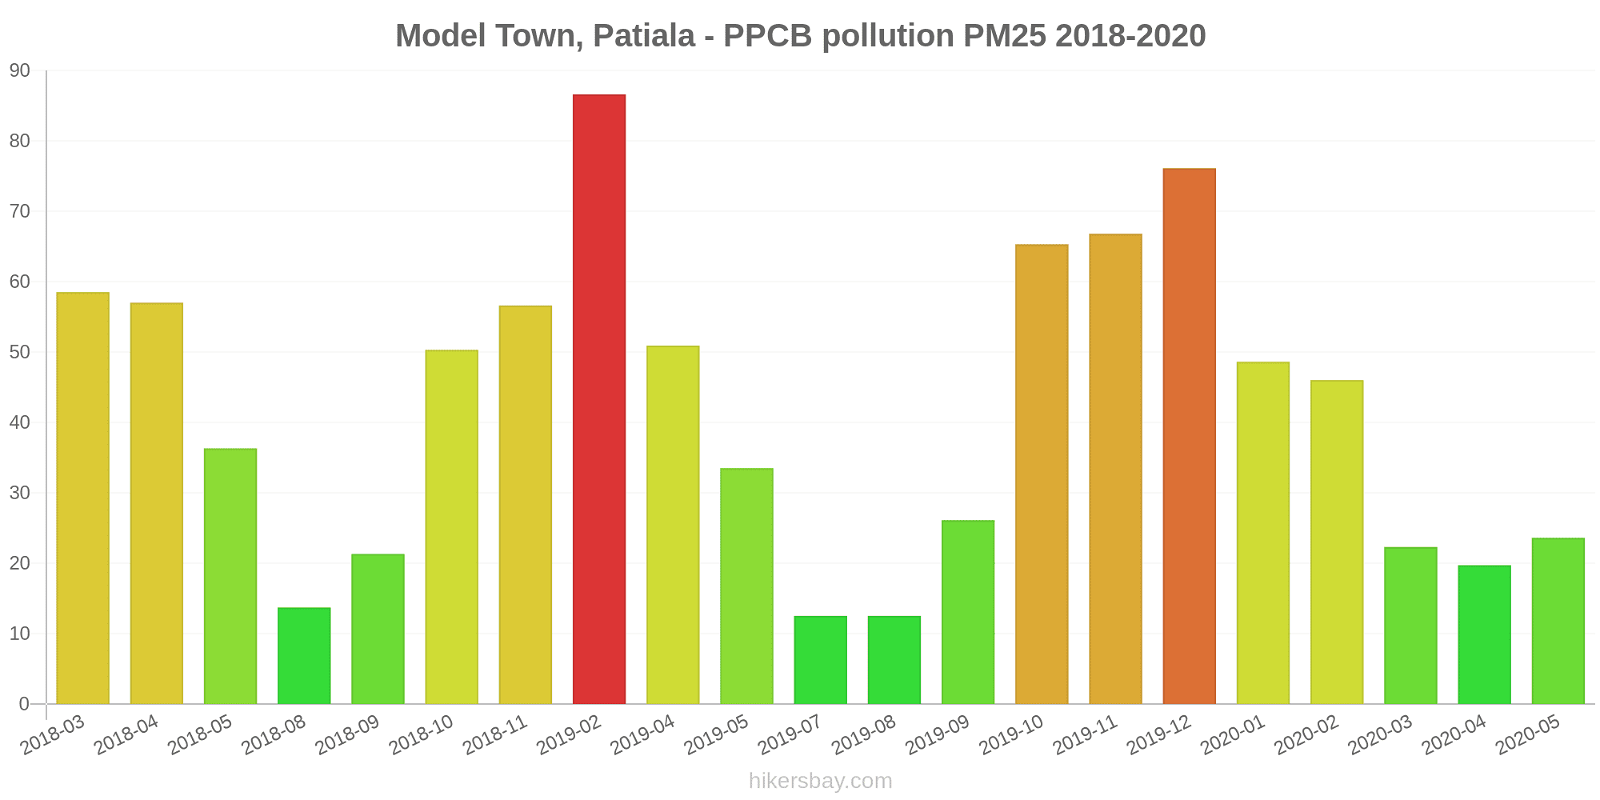
Model Town, Patiala - PPCB
2018-03 2020-05
index
2020-05
2020-04
2020-03
2020-02
2020-01
2019-12
2019-11
2019-10
2019-09
2019-08
2019-07
2019-05
2019-04
2019-02
2018-11
2018-10
2018-09
2018-08
2018-05
2018-04
2018-03
pm25
24
20
22
46
49
76
67
65
26
13
13
34
51
87
57
50
21
14
36
57
59
pm10
70
51
54
96
93
138
151
133
74
44
41
101
183
209
116
107
64
51
137
113
86
no2
6.9
4.3
5.9
6.7
11
18
38
21
0.09
7.5
19
37
26
23
20
4.8
9.3
11
31
34
21
co
448
408
694
792
904
628
454
661
515
584
430
1
1
855
1
874
438
754
945
26
52
o3
22
18
12
12
7.3
9.7
22
9.3
18
23
27
21
25
12
5.6
13
17
18
19
19
21
so2
9.2
5.3
5.6
8.2
9.6
18
21
5.9
4.8
3.3
3.3
7.7
9.5
5.1
12
7.6
7.2
4.5
-
-
9.6
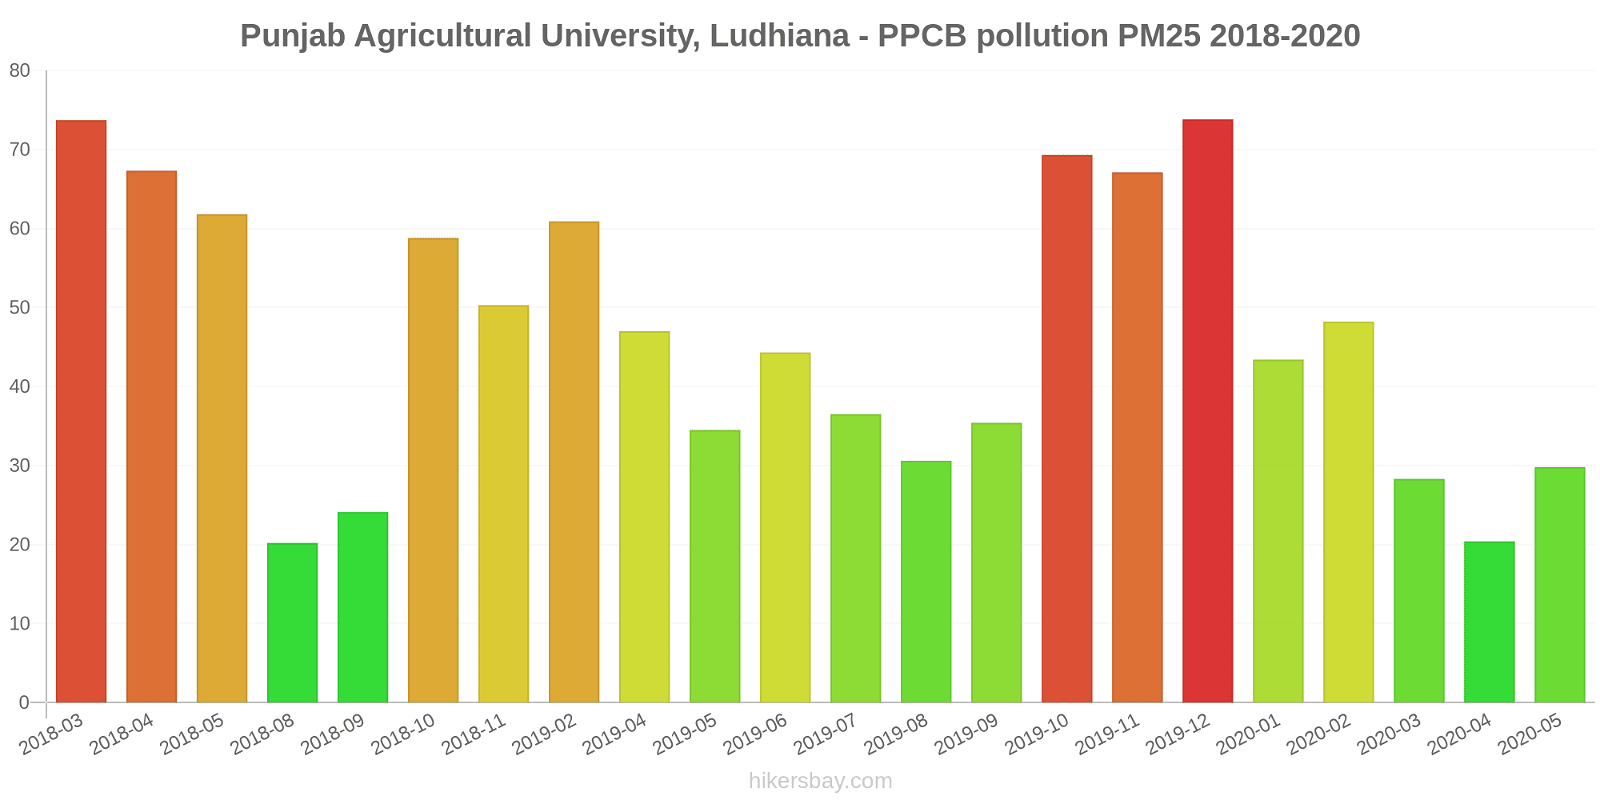
Punjab Agricultural University, Ludhiana - PPCB
2018-03 2020-05
index
2020-05
2020-04
2020-03
2020-02
2020-01
2019-12
2019-11
2019-10
2019-09
2019-08
2019-07
2019-06
2019-05
2019-04
2019-02
2018-11
2018-10
2018-09
2018-08
2018-05
2018-04
2018-03
co
257
227
384
554
341
630
5.8
13
7.4
-
-
-
-
-
-
543
811
736
696
630
14
24
o3
34
33
19
25
17
15
13
23
21
15
18
16
40
39
19
15
13
23
19
-
4
5.3
pm25
30
20
28
48
43
74
67
69
35
31
37
44
35
47
61
50
59
24
20
62
67
74
no2
100
24
47
30
25
21
33
37
22
20
13
64
49
-
26
11
14
18
13
20
20
27
so2
6
5.5
9.3
9.4
6.7
7
4.8
9
6.7
4.9
5.6
6
11
22
7.4
11
10
8.8
16
13
10
13
pm10
66
44
61
100
87
126
141
122
90
99
84
91
61
90
94
112
91
48
48
129
155
83
RIMT University, Mandi Gobindgarh - PPCB
2017-03 2020-05
index
2020-05
2020-04
2020-03
2020-02
2020-01
2019-12
2019-11
2019-10
2019-09
2019-08
2019-07
2019-06
2019-05
2019-04
2019-02
2018-11
2018-10
2018-09
2018-08
2018-05
2018-04
2018-03
2018-02
2018-01
2017-12
2017-11
2017-10
2017-09
2017-08
2017-07
2017-06
2017-05
2017-04
2017-03
pm25
52
30
44
67
100
129
92
63
26
29
19
49
26
52
60
77
-
-
-
48
63
121
63
78
98
150
127
78
37
33
66
77
73
89
no2
8.3
10
12
14
16
13
26
15
-
10
11
11
11
11
-
18
16
14
25
39
17
31
45
26
60
103
37
11
11
12
36
11
32
35
co
798
298
341
426
513
609
677
549
670
628
759
755
392
408
556
665
1
552
479
1
27
68
1
1
1
966
793
871
525
813
783
542
662
522
pm10
129
64
81
151
153
167
191
121
61
55
60
152
80
163
142
129
124
57
64
107
117
109
100
131
160
276
236
155
100
125
173
212
193
202
so2
22
4.5
13
48
28
11
24
11
11
9.1
3
9.7
7.2
9.6
11
12
11
10
37
21
16
21
8.3
13
9.6
8.4
7.8
16
4.2
12
29
22
13
12
o3
20
18
15
17
10
10
12
15
12
11
8.3
22
28
26
22
18
33
18
28
13
23
18
-
-
-
-
-
-
-
-
-
-
-
-
* Pollution data source:
https://openaq.org
(caaqm)
The data is licensed under CC-By 4.0
PM10 144 (Sehr ungesund)
SO2 13 (gut)
PM2,5 77 (Sehr ungesund)
CO 950 (gut)
NO2 27 (gut)
O3 25 (gut)
Daten zur Luftverschmutzung der letzten Tage in Punjab
| index | 2022-10-31 |
|---|---|
| pm10 | 137 Very Unhealthy |
| so2 | 13 Good |
| pm25 | 75 Very Unhealthy |
| co | 1022 Good |
| no2 | 28 Good |
| o3 | 24 Good |
| index | 2020-05 | 2020-04 | 2020-03 | 2020-02 | 2020-01 | 2019-12 | 2019-11 | 2019-10 | 2019-09 | 2019-08 | 2019-07 | 2019-06 | 2019-05 | 2019-04 | 2019-02 | 2018-11 | 2018-10 | 2018-09 | 2018-08 | 2018-05 | 2018-04 | 2018-03 | 2018-02 | 2018-01 | 2017-12 | 2017-11 | 2017-10 | 2017-09 | 2017-08 | 2017-07 | 2017-06 | 2017-05 | 2017-04 | 2017-03 |
|---|---|---|---|---|---|---|---|---|---|---|---|---|---|---|---|---|---|---|---|---|---|---|---|---|---|---|---|---|---|---|---|---|---|---|
| pm25 | 34 (Moderate) | 26 (Moderate) | 30 (Moderate) | 57 (Unhealthy) | 59 (Unhealthy) | 78 (Very Unhealthy) | 74 (Unhealthy) | 60 (Unhealthy) | 30 (Moderate) | 23 (Moderate) | 27 (Moderate) | 41 (Unhealthy for Sensitive Groups) | 31 (Moderate) | 45 (Unhealthy for Sensitive Groups) | 59 (Unhealthy) | 58 (Unhealthy) | 53 (Unhealthy for Sensitive Groups) | 28 (Moderate) | 25 (Moderate) | 51 (Unhealthy for Sensitive Groups) | 62 (Unhealthy) | 74 (Unhealthy) | 63 (Unhealthy) | 78 (Very Unhealthy) | 98 (Very Unhealthy) | 150 (Very bad Hazardous) | 127 (Very bad Hazardous) | 78 (Very Unhealthy) | 37 (Unhealthy for Sensitive Groups) | 33 (Moderate) | 66 (Unhealthy) | 77 (Very Unhealthy) | 73 (Unhealthy) | 89 (Very Unhealthy) |
| pm10 | 82 (Unhealthy) | 53 (Unhealthy for Sensitive Groups) | 68 (Unhealthy for Sensitive Groups) | 111 (Very Unhealthy) | 103 (Unhealthy) | 137 (Very Unhealthy) | 153 (Very bad Hazardous) | 121 (Very Unhealthy) | 69 (Unhealthy for Sensitive Groups) | 61 (Unhealthy for Sensitive Groups) | 68 (Unhealthy for Sensitive Groups) | 110 (Very Unhealthy) | 86 (Unhealthy) | 142 (Very Unhealthy) | 139 (Very Unhealthy) | 119 (Very Unhealthy) | 112 (Very Unhealthy) | 55 (Unhealthy for Sensitive Groups) | 54 (Unhealthy for Sensitive Groups) | 118 (Very Unhealthy) | 131 (Very Unhealthy) | 98 (Unhealthy) | 100 (Unhealthy) | 131 (Very Unhealthy) | 160 (Very bad Hazardous) | 276 (Very bad Hazardous) | 236 (Very bad Hazardous) | 155 (Very bad Hazardous) | 100 (Unhealthy) | 125 (Very Unhealthy) | 173 (Very bad Hazardous) | 212 (Very bad Hazardous) | 193 (Very bad Hazardous) | 202 (Very bad Hazardous) |
| no2 | 24 (Good) | 12 (Good) | 16 (Good) | 16 (Good) | 16 (Good) | 18 (Good) | 28 (Good) | 25 (Good) | 16 (Good) | 15 (Good) | 19 (Good) | 26 (Good) | 24 (Good) | 19 (Good) | 17 (Good) | 23 (Good) | 20 (Good) | 14 (Good) | 13 (Good) | 20 (Good) | 18 (Good) | 23 (Good) | 45 (Moderate) | 26 (Good) | 60 (Moderate) | 103 (Unhealthy for Sensitive Groups) | 37 (Good) | 11 (Good) | 11 (Good) | 12 (Good) | 36 (Good) | 11 (Good) | 32 (Good) | 35 (Good) |
| so2 | 10 (Good) | 7.5 (Good) | 11 (Good) | 15 (Good) | 12 (Good) | 11 (Good) | 15 (Good) | 9.8 (Good) | 9.1 (Good) | 9.6 (Good) | 23 (Good) | 9.7 (Good) | 11 (Good) | 11 (Good) | 7.8 (Good) | 12 (Good) | 8.2 (Good) | 7.3 (Good) | 12 (Good) | 14 (Good) | 17 (Good) | 13 (Good) | 8.3 (Good) | 13 (Good) | 9.6 (Good) | 8.4 (Good) | 7.8 (Good) | 16 (Good) | 4.2 (Good) | 12 (Good) | 29 (Good) | 22 (Good) | 13 (Good) | 12 (Good) |
| co | 531 (Good) | 333 (Good) | 402 (Good) | 541 (Good) | 449 (Good) | 463 (Good) | 376 (Good) | 357 (Good) | 411 (Good) | 501 (Good) | 260 (Good) | 573 (Good) | 396 (Good) | 520 (Good) | 583 (Good) | 360 (Good) | 387 (Good) | 419 (Good) | 497 (Good) | 555 (Good) | 18 (Good) | 48 (Good) | 1 (Good) | 1 (Good) | 1 (Good) | 966 (Good) | 793 (Good) | 871 (Good) | 525 (Good) | 813 (Good) | 783 (Good) | 542 (Good) | 662 (Good) | 522 (Good) |
| o3 | 26 (Good) | 24 (Good) | 18 (Good) | 21 (Good) | 16 (Good) | 14 (Good) | 14 (Good) | 32 (Good) | 20 (Good) | 16 (Good) | 20 (Good) | 22 (Good) | 26 (Good) | 24 (Good) | 14 (Good) | 15 (Good) | 22 (Good) | 20 (Good) | 24 (Good) | 20 (Good) | 22 (Good) | 18 (Good) | - (Good) | - (Good) | - (Good) | - (Good) | - (Good) | - (Good) | - (Good) | - (Good) | - (Good) | - (Good) | - (Good) | - (Good) |
Grün und Parks in der Stadt
Punjab 51 %
Népal: 32 % Bangladesch: 33 % Bhutan: 82 % Sri Lanka: 59 % Pakistan: 49 %Feinstaub PM2,5
Punjab 82 (Very Unhealthy)
Vergnügen, Zeit in der Stadt zu verbringen
Punjab 38 %
Népal: 32 % Bangladesch: 26 % Bhutan: 61 % Sri Lanka: 52 % Pakistan: 43 %Feinstaub PM10
Punjab 150 (Very bad Hazardous)
Luftverschmutzung
Punjab 68 %
Népal: 76 % Bangladesch: 78 % Bhutan: 45 % Sri Lanka: 53 % Pakistan: 64 %Müllentsorgung
Punjab 27 %
Népal: 25 % Bangladesch: 22 % Bhutan: 47 % Sri Lanka: 41 % Pakistan: 34 %Verfügbarkeit und Qualität von Trinkwasser
Punjab 53 %
Népal: 36 % Bangladesch: 44 % Bhutan: 64 % Sri Lanka: 65 % Pakistan: 44 %Sauberkeit und Ordentlichkeit
Punjab 38 %
Népal: 27 % Bangladesch: 23 % Bhutan: 57 % Sri Lanka: 52 % Pakistan: 40 %Lärm und Lichtverschmutzung
Punjab 58 %
Népal: 55 % Bangladesch: 63 % Bhutan: 55 % Sri Lanka: 50 % Pakistan: 59 %Wasserverschmutzung
Punjab 65 %
Népal: 76 % Bangladesch: 74 % Bhutan: 56 % Sri Lanka: 57 % Pakistan: 70 %PM10 103 (ungesund)
Feinstaub (PM10) SchwebestaubSO2 16 (gut)
Schwefeldioxid (SO2)PM2,5 56 (ungesund)
Feinstaub (PM2,5)CO 720 (gut)
Kohlenmonoxid (CO)NO2 25 (gut)
Stickstoffdioxid (NO2)O3 7.2 (gut)
Ozon (O3)PM10 138 (Sehr ungesund)
Feinstaub (PM10) SchwebestaubSO2 7.2 (gut)
Schwefeldioxid (SO2)PM2,5 129 (Sehr schlecht Gefährlich)
Feinstaub (PM2,5)CO 580 (gut)
Kohlenmonoxid (CO)NO2 58 (Moderate)
Stickstoffdioxid (NO2)O3 15 (gut)
Ozon (O3)CO 950 (gut)
Kohlenmonoxid (CO)PM2,5 48 (Ungesund für sensible Gruppen)
Feinstaub (PM2,5)PM10 109 (ungesund)
Feinstaub (PM10) SchwebestaubNO2 22 (gut)
Stickstoffdioxid (NO2)SO2 34 (gut)
Schwefeldioxid (SO2)PM2,5 55 (Ungesund für sensible Gruppen)
Feinstaub (PM2,5)PM10 155 (Sehr schlecht Gefährlich)
Feinstaub (PM10) SchwebestaubNO2 23 (gut)
Stickstoffdioxid (NO2)SO2 8 (gut)
Schwefeldioxid (SO2)CO 0.75 (gut)
Kohlenmonoxid (CO)O3 21 (gut)
Ozon (O3)PM10 171 (Sehr schlecht Gefährlich)
Feinstaub (PM10) SchwebestaubSO2 8.8 (gut)
Schwefeldioxid (SO2)PM2,5 93 (Sehr ungesund)
Feinstaub (PM2,5)CO 2060 (Moderate)
Kohlenmonoxid (CO)NO2 21 (gut)
Stickstoffdioxid (NO2)O3 28 (gut)
Ozon (O3)SO2 6 (gut)
Schwefeldioxid (SO2)PM2,5 99 (Sehr ungesund)
Feinstaub (PM2,5)NO2 21 (gut)
Stickstoffdioxid (NO2)PM10 188 (Sehr schlecht Gefährlich)
Feinstaub (PM10) SchwebestaubCO 1680 (gut)
Kohlenmonoxid (CO)O3 8.7 (gut)
Ozon (O3)PM2,5 60 (ungesund)
Feinstaub (PM2,5)PM10 142 (Sehr ungesund)
Feinstaub (PM10) SchwebestaubNO2 20 (gut)
Stickstoffdioxid (NO2)SO2 14 (gut)
Schwefeldioxid (SO2)CO 660 (gut)
Kohlenmonoxid (CO)O3 68 (gut)
Ozon (O3)Civil Line, Jalandhar - PPCB
| index | 2022-10-31 |
|---|---|
| pm10 | 104 |
| so2 | 16 |
| pm25 | 56 |
| co | 705 |
| no2 | 25 |
| o3 | 7.1 |
Golden Temple, Amritsar - PPCB
| index | 2022-10-31 |
|---|---|
| pm10 | 126 |
| so2 | 7.7 |
| pm25 | 110 |
| co | 620 |
| no2 | 63 |
| o3 | 15 |
Hardev Nagar, Bathinda - PPCB
| index | 2022-10-31 |
|---|---|
| co | 1450 |
| pm25 | 48 |
| pm10 | 71 |
| no2 | 21 |
| so2 | 34 |
Kalal Majra, Khanna - PPCB
| index | 2022-10-31 |
|---|---|
| pm25 | 55 |
| pm10 | 155 |
| no2 | 23 |
| so2 | 8 |
| co | 0.75 |
| o3 | 21 |
Model Town, Patiala - PPCB
| index | 2022-10-31 |
|---|---|
| pm10 | 170 |
| so2 | 8.6 |
| pm25 | 94 |
| co | 2045 |
| no2 | 23 |
| o3 | 27 |
Punjab Agricultural University, Ludhiana - PPCB
| index | 2022-10-31 |
|---|---|
| so2 | 5.7 |
| pm25 | 100 |
| no2 | 20 |
| pm10 | 190 |
| co | 1675 |
| o3 | 7.3 |
RIMT University, Mandi Gobindgarh - PPCB
| index | 2022-10-31 |
|---|---|
| pm25 | 60 |
| pm10 | 142 |
| no2 | 20 |
| so2 | 14 |
| co | 660 |
| o3 | 68 |
Civil Line, Jalandhar - PPCB
| index | 2020-05 | 2020-04 | 2020-03 | 2020-02 | 2020-01 | 2019-12 | 2019-11 | 2019-10 | 2019-09 | 2019-08 | 2019-07 | 2019-06 | 2019-05 | 2019-04 | 2019-02 | 2018-11 | 2018-10 | 2018-09 | 2018-08 | 2018-05 | 2018-04 | 2018-03 |
|---|---|---|---|---|---|---|---|---|---|---|---|---|---|---|---|---|---|---|---|---|---|---|
| pm25 | 42 | 27 | 37 | 62 | 62 | 67 | 76 | 69 | 29 | 31 | 43 | 55 | 46 | 51 | 52 | 71 | 63 | 26 | 32 | 56 | 78 | 55 |
| pm10 | 72 | 46 | 63 | 107 | 108 | 115 | 131 | 118 | 70 | 112 | 121 | 128 | 113 | 171 | 178 | 112 | 104 | 43 | 52 | 92 | 112 | 103 |
| co | 420 | 319 | 655 | 807 | 760 | 739 | 881 | 829 | 857 | 880 | 1 | 478 | 822 | 906 | 927 | 666 | 754 | 658 | 812 | 954 | 27 | 54 |
| o3 | 23 | 21 | 19 | 25 | 18 | 14 | 15 | 23 | 15 | 15 | 26 | 27 | 18 | 13 | 15 | 17 | 22 | 16 | 24 | 16 | 23 | 17 |
| no2 | 5.8 | 9 | 8.3 | 15 | 24 | 17 | 36 | 25 | 30 | 20 | 30 | 28 | 28 | 31 | 9.1 | 17 | 23 | 26 | 12 | 15 | 8.3 | 22 |
| so2 | 9.2 | 12 | 11 | 9.3 | 8.6 | 11 | 13 | 15 | 16 | 34 | 131 | 11 | 23 | 6.2 | 11 | 6.4 | 7.5 | 7.6 | 8.1 | - | - | 18 |
Golden Temple, Amritsar - PPCB
| index | 2020-05 | 2020-04 | 2020-03 | 2020-02 | 2020-01 | 2019-12 | 2019-11 | 2019-10 | 2019-09 | 2019-08 | 2019-07 | 2019-06 | 2019-05 | 2019-04 | 2019-02 | 2018-11 | 2018-10 | 2018-09 | 2018-08 | 2018-05 | 2018-04 | 2018-03 |
|---|---|---|---|---|---|---|---|---|---|---|---|---|---|---|---|---|---|---|---|---|---|---|
| co | 761 | 746 | 735 | 666 | 624 | 633 | 614 | 442 | 824 | 413 | 371 | 665 | 762 | 849 | - | 426 | 66 | - | 346 | 799 | 11 | 43 |
| o3 | 37 | 35 | 29 | 34 | 35 | 27 | 14 | 103 | 29 | 17 | 18 | 20 | 32 | 24 | 11 | 18 | 21 | 20 | 32 | - | - | 28 |
| pm25 | 27 | 20 | 28 | 73 | 50 | 70 | 78 | 67 | 36 | 30 | 32 | 33 | 36 | 57 | 70 | 47 | 52 | - | - | 60 | 58 | 62 |
| pm10 | 79 | 58 | 84 | 127 | 86 | 98 | 155 | 116 | 67 | 56 | 63 | 102 | 90 | 136 | 126 | 126 | 141 | 53 | 53 | 134 | 130 | 108 |
| no2 | 20 | 15 | 12 | 14 | 10 | 12 | 10 | 13 | 11 | 9.6 | 12 | 9.2 | 17 | 16 | 19 | 31 | 21 | 9.5 | 13 | 8.5 | 13 | 13 |
| so2 | 9.1 | 8.8 | 11 | 9.7 | 9.1 | 8.7 | 13 | 11 | 12 | 6.6 | 7.5 | 9.8 | - | - | - | 3.4 | 5.9 | 3.6 | 7 | 6.1 | 5.6 | 4.1 |
Hardev Nagar, Bathinda - PPCB
| index | 2020-05 | 2020-04 | 2020-03 | 2020-02 | 2020-01 | 2019-12 | 2019-11 | 2019-10 | 2019-09 | 2019-08 | 2019-07 | 2019-06 | 2019-05 | 2019-04 | 2019-02 | 2018-11 | 2018-10 | 2018-09 | 2018-08 |
|---|---|---|---|---|---|---|---|---|---|---|---|---|---|---|---|---|---|---|---|
| pm25 | 35 | 40 | 27 | 63 | 53 | 59 | 76 | 31 | 29 | 6.9 | 13 | 27 | 25 | 22 | 32 | 53 | 41 | 45 | 38 |
| pm10 | 76 | 55 | 83 | 118 | 92 | 159 | 149 | 111 | 64 | 14 | 45 | 88 | 106 | 124 | 118 | 120 | 100 | 68 | 59 |
| no2 | 18 | 18 | 18 | 18 | 18 | 18 | 23 | 23 | 23 | 23 | 21 | 20 | 21 | 21 | 18 | 14 | 16 | 9.6 | 10 |
| so2 | 9.6 | 8.8 | 8.6 | 5.3 | 7.4 | 7.4 | 7.1 | 6.7 | 6.5 | 4.6 | 4.4 | 15 | 4.4 | 5.3 | 3.1 | 18 | 3 | 6.1 | 6.6 |
| co | 502 | 1 | 2 | 1 | 1 | 1 | 2 | 2 | 1 | - | 1 | 966 | 1 | 953 | 575 | 218 | 200 | 128 | 392 |
Kalal Majra, Khanna - PPCB
| index | 2020-05 | 2020-04 | 2020-03 | 2020-02 | 2020-01 | 2019-12 | 2019-11 | 2019-10 | 2019-09 | 2019-08 | 2019-07 | 2019-06 | 2019-05 | 2019-04 | 2019-02 | 2018-11 | 2018-10 | 2018-09 | 2018-08 | 2018-05 | 2018-04 |
|---|---|---|---|---|---|---|---|---|---|---|---|---|---|---|---|---|---|---|---|---|---|
| pm25 | 30 | 23 | 23 | 39 | 58 | 69 | 62 | 54 | 29 | 23 | 29 | 36 | 19 | 33 | 50 | 53 | 51 | 24 | 23 | 42 | 48 |
| pm10 | 82 | 50 | 51 | 81 | 103 | 156 | 152 | 126 | 53 | 45 | 60 | 100 | 54 | 126 | 106 | 118 | 117 | 50 | 54 | 111 | 161 |
| co | - | - | 1.2 | - | 0.42 | 0.76 | 0.74 | 0.51 | 0.87 | 0.88 | 0.86 | 0.69 | - | 0.19 | 0.35 | 0.59 | 0.61 | 0.41 | 0.46 | 0.79 | 0.78 |
| o3 | 22 | 18 | 17 | 16 | 11 | 8.2 | 6.9 | 21 | 24 | 13 | 21 | 26 | 16 | 16 | 7.5 | 14 | 29 | 26 | 22 | 32 | 43 |
| no2 | 6.6 | 6.4 | 12 | 13 | 8.2 | 26 | 32 | 39 | 8.9 | 18 | 28 | 26 | 6.5 | 7.3 | 8.9 | 47 | 46 | 11 | 7.6 | 7.6 | 15 |
| so2 | 7.4 | 7.1 | 15 | 13 | 11 | 12 | 21 | 11 | 6.5 | 4.9 | 4.6 | 6.2 | 13 | 17 | 9.3 | 22 | 13 | 7.2 | 4.5 | 17 | 37 |
Model Town, Patiala - PPCB
| index | 2020-05 | 2020-04 | 2020-03 | 2020-02 | 2020-01 | 2019-12 | 2019-11 | 2019-10 | 2019-09 | 2019-08 | 2019-07 | 2019-05 | 2019-04 | 2019-02 | 2018-11 | 2018-10 | 2018-09 | 2018-08 | 2018-05 | 2018-04 | 2018-03 |
|---|---|---|---|---|---|---|---|---|---|---|---|---|---|---|---|---|---|---|---|---|---|
| pm25 | 24 | 20 | 22 | 46 | 49 | 76 | 67 | 65 | 26 | 13 | 13 | 34 | 51 | 87 | 57 | 50 | 21 | 14 | 36 | 57 | 59 |
| pm10 | 70 | 51 | 54 | 96 | 93 | 138 | 151 | 133 | 74 | 44 | 41 | 101 | 183 | 209 | 116 | 107 | 64 | 51 | 137 | 113 | 86 |
| no2 | 6.9 | 4.3 | 5.9 | 6.7 | 11 | 18 | 38 | 21 | 0.09 | 7.5 | 19 | 37 | 26 | 23 | 20 | 4.8 | 9.3 | 11 | 31 | 34 | 21 |
| co | 448 | 408 | 694 | 792 | 904 | 628 | 454 | 661 | 515 | 584 | 430 | 1 | 1 | 855 | 1 | 874 | 438 | 754 | 945 | 26 | 52 |
| o3 | 22 | 18 | 12 | 12 | 7.3 | 9.7 | 22 | 9.3 | 18 | 23 | 27 | 21 | 25 | 12 | 5.6 | 13 | 17 | 18 | 19 | 19 | 21 |
| so2 | 9.2 | 5.3 | 5.6 | 8.2 | 9.6 | 18 | 21 | 5.9 | 4.8 | 3.3 | 3.3 | 7.7 | 9.5 | 5.1 | 12 | 7.6 | 7.2 | 4.5 | - | - | 9.6 |
Punjab Agricultural University, Ludhiana - PPCB
| index | 2020-05 | 2020-04 | 2020-03 | 2020-02 | 2020-01 | 2019-12 | 2019-11 | 2019-10 | 2019-09 | 2019-08 | 2019-07 | 2019-06 | 2019-05 | 2019-04 | 2019-02 | 2018-11 | 2018-10 | 2018-09 | 2018-08 | 2018-05 | 2018-04 | 2018-03 |
|---|---|---|---|---|---|---|---|---|---|---|---|---|---|---|---|---|---|---|---|---|---|---|
| co | 257 | 227 | 384 | 554 | 341 | 630 | 5.8 | 13 | 7.4 | - | - | - | - | - | - | 543 | 811 | 736 | 696 | 630 | 14 | 24 |
| o3 | 34 | 33 | 19 | 25 | 17 | 15 | 13 | 23 | 21 | 15 | 18 | 16 | 40 | 39 | 19 | 15 | 13 | 23 | 19 | - | 4 | 5.3 |
| pm25 | 30 | 20 | 28 | 48 | 43 | 74 | 67 | 69 | 35 | 31 | 37 | 44 | 35 | 47 | 61 | 50 | 59 | 24 | 20 | 62 | 67 | 74 |
| no2 | 100 | 24 | 47 | 30 | 25 | 21 | 33 | 37 | 22 | 20 | 13 | 64 | 49 | - | 26 | 11 | 14 | 18 | 13 | 20 | 20 | 27 |
| so2 | 6 | 5.5 | 9.3 | 9.4 | 6.7 | 7 | 4.8 | 9 | 6.7 | 4.9 | 5.6 | 6 | 11 | 22 | 7.4 | 11 | 10 | 8.8 | 16 | 13 | 10 | 13 |
| pm10 | 66 | 44 | 61 | 100 | 87 | 126 | 141 | 122 | 90 | 99 | 84 | 91 | 61 | 90 | 94 | 112 | 91 | 48 | 48 | 129 | 155 | 83 |
RIMT University, Mandi Gobindgarh - PPCB
| index | 2020-05 | 2020-04 | 2020-03 | 2020-02 | 2020-01 | 2019-12 | 2019-11 | 2019-10 | 2019-09 | 2019-08 | 2019-07 | 2019-06 | 2019-05 | 2019-04 | 2019-02 | 2018-11 | 2018-10 | 2018-09 | 2018-08 | 2018-05 | 2018-04 | 2018-03 | 2018-02 | 2018-01 | 2017-12 | 2017-11 | 2017-10 | 2017-09 | 2017-08 | 2017-07 | 2017-06 | 2017-05 | 2017-04 | 2017-03 |
|---|---|---|---|---|---|---|---|---|---|---|---|---|---|---|---|---|---|---|---|---|---|---|---|---|---|---|---|---|---|---|---|---|---|---|
| pm25 | 52 | 30 | 44 | 67 | 100 | 129 | 92 | 63 | 26 | 29 | 19 | 49 | 26 | 52 | 60 | 77 | - | - | - | 48 | 63 | 121 | 63 | 78 | 98 | 150 | 127 | 78 | 37 | 33 | 66 | 77 | 73 | 89 |
| no2 | 8.3 | 10 | 12 | 14 | 16 | 13 | 26 | 15 | - | 10 | 11 | 11 | 11 | 11 | - | 18 | 16 | 14 | 25 | 39 | 17 | 31 | 45 | 26 | 60 | 103 | 37 | 11 | 11 | 12 | 36 | 11 | 32 | 35 |
| co | 798 | 298 | 341 | 426 | 513 | 609 | 677 | 549 | 670 | 628 | 759 | 755 | 392 | 408 | 556 | 665 | 1 | 552 | 479 | 1 | 27 | 68 | 1 | 1 | 1 | 966 | 793 | 871 | 525 | 813 | 783 | 542 | 662 | 522 |
| pm10 | 129 | 64 | 81 | 151 | 153 | 167 | 191 | 121 | 61 | 55 | 60 | 152 | 80 | 163 | 142 | 129 | 124 | 57 | 64 | 107 | 117 | 109 | 100 | 131 | 160 | 276 | 236 | 155 | 100 | 125 | 173 | 212 | 193 | 202 |
| so2 | 22 | 4.5 | 13 | 48 | 28 | 11 | 24 | 11 | 11 | 9.1 | 3 | 9.7 | 7.2 | 9.6 | 11 | 12 | 11 | 10 | 37 | 21 | 16 | 21 | 8.3 | 13 | 9.6 | 8.4 | 7.8 | 16 | 4.2 | 12 | 29 | 22 | 13 | 12 |
| o3 | 20 | 18 | 15 | 17 | 10 | 10 | 12 | 15 | 12 | 11 | 8.3 | 22 | 28 | 26 | 22 | 18 | 33 | 18 | 28 | 13 | 23 | 18 | - | - | - | - | - | - | - | - | - | - | - | - |