Luftverschmutzung in Pāli: Echtzeit-Luft-Qualitätsindex und Smog-Alarm.
Für die Pāli. Heute ist Samstag, 13. Dezember 2025. Für Pāli wurden folgende Luftverschmutzungswerte gemessen:- Feinstaub (PM10) Schwebestaub - 54 (Ungesund für sensible Gruppen)
- Schwefeldioxid (SO2) - 10 (gut)
- Feinstaub (PM2,5) - 50 (Ungesund für sensible Gruppen)
- Kohlenmonoxid (CO) - 1130 (gut)
- Stickstoffdioxid (NO2) - 20 (gut)
- Ozon (O3) - 14 (gut)

Wie ist die Luftqualität Pāli heute? Ist die Luft in Pāli? verschmutzt. Gibt es Smog?
Wie hoch ist der PM10-Stand heute in Pāli? (Feinstaub (PM10) Schwebestaub)
Der aktuelle Feinstaubgehalt PM10 in Pāli is:
54 (Ungesund für sensible Gruppen)
Die höchsten PM10-Werte treten in der Regel im Monat auf: 246 (Mai 2019).
Der niedrigste Wert der Feinstaub-PM10-Belastung in Pāli ist in der Regel in: Mai (66).
Wie hoch ist die SO2-Belastung? (Schwefeldioxid (SO2))
10 (gut)
Wie hoch ist der aktuelle PM2,5-Wert in Pāli? (Feinstaub (PM2,5))
Die heutige PM2.5-Stufe ist:
50 (Ungesund für sensible Gruppen)
Zum Vergleich: Der höchste PM2,5-Wert in Pāli in den letzten 7 Tagen war: 56 (Montag, 31. Oktober 2022) und der niedrigste: 56 (Montag, 31. Oktober 2022).
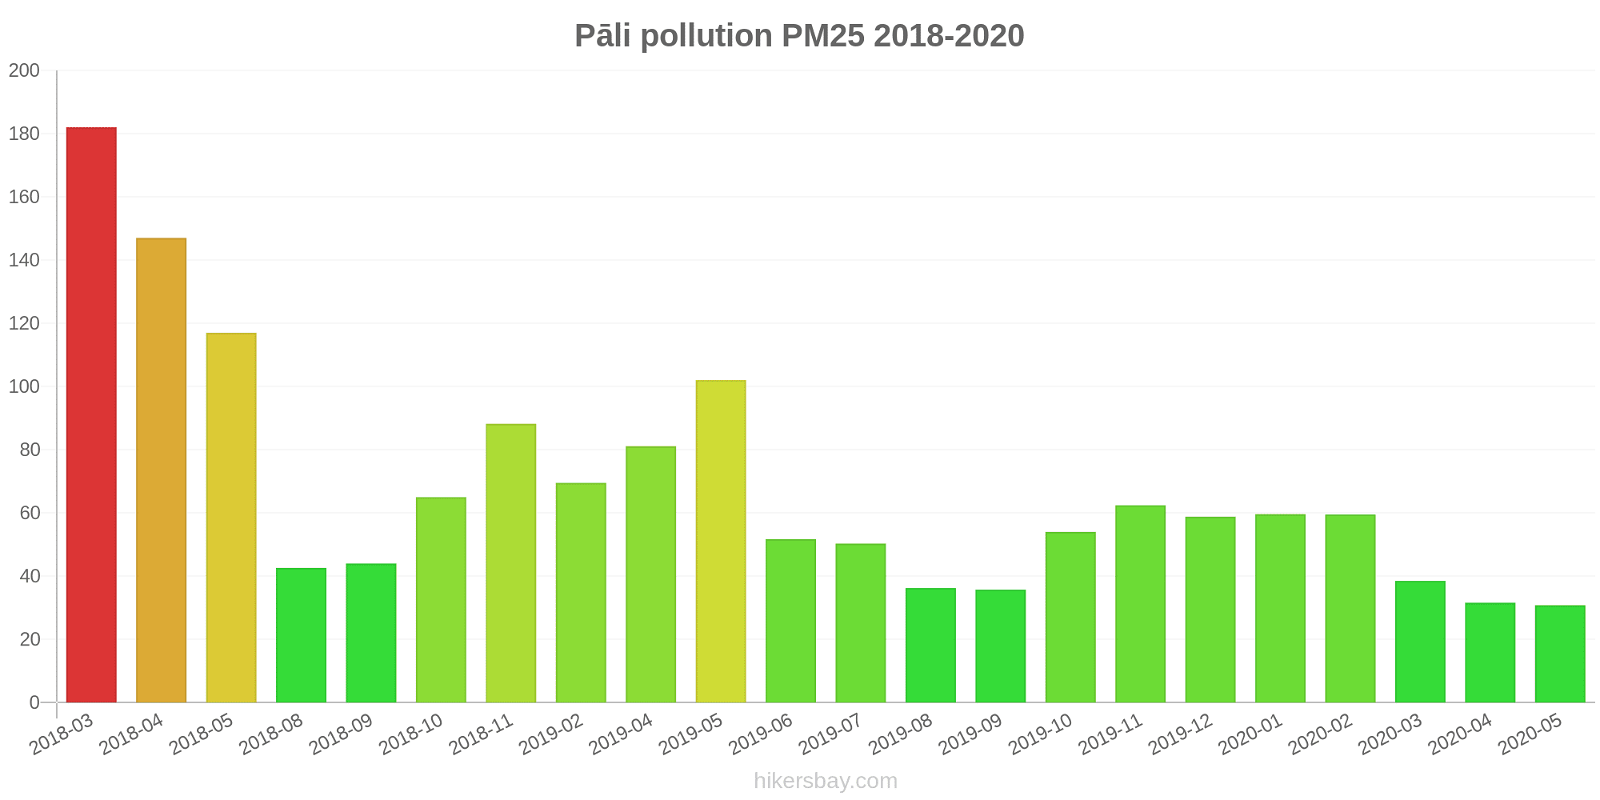
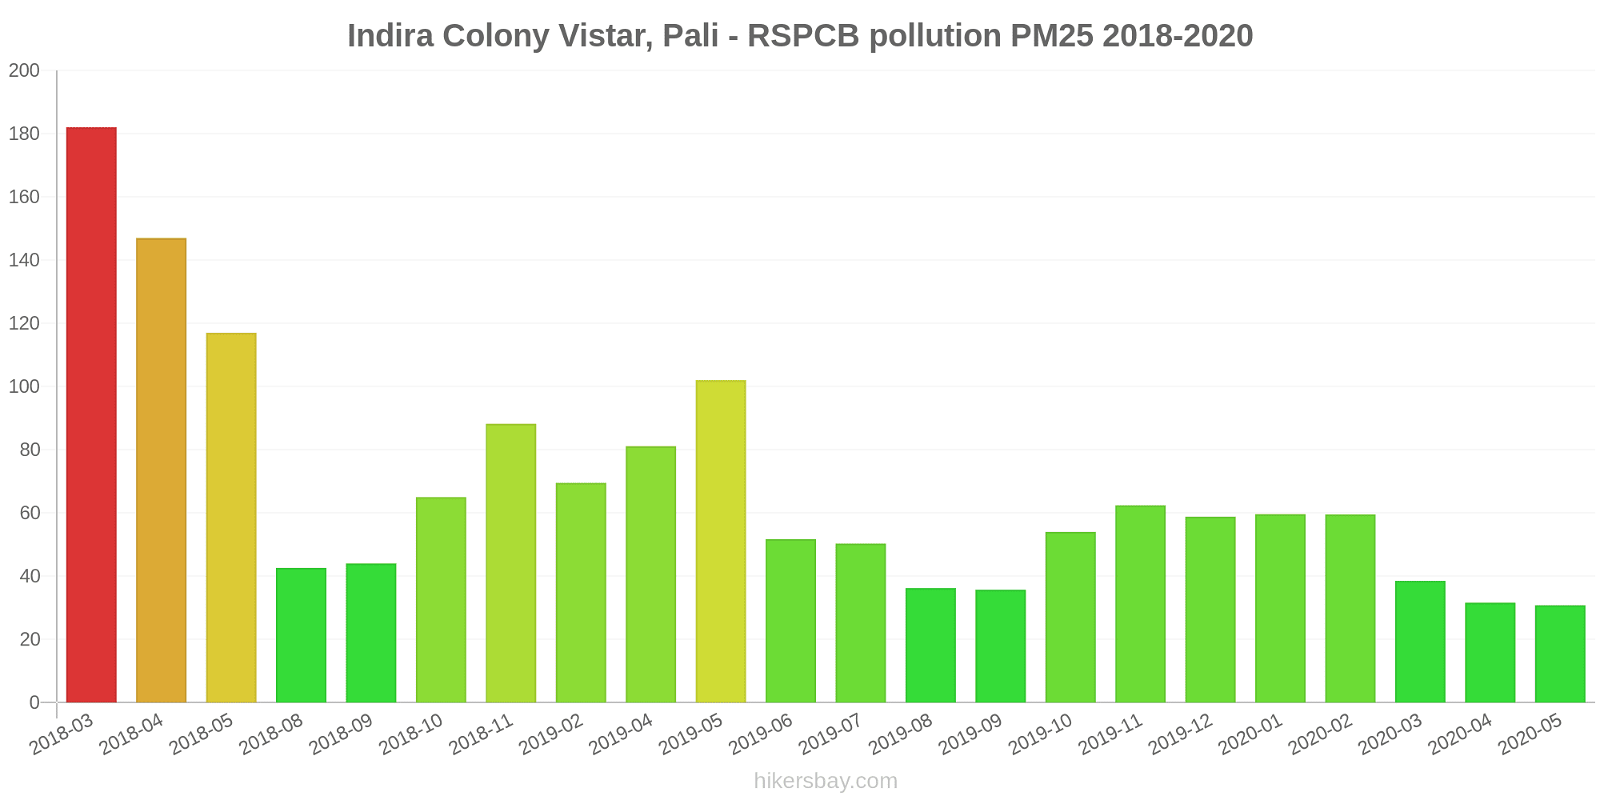
Die höchsten PM2,5-Werte wurden gemessen: 182 (März 2018).
Die niedrigste Feinstaubbelastung PM2,5 tritt im Monat auf: Mai (31).
Wie hoch ist der CO-Gehalt? (Kohlenmonoxid (CO))
1130 (gut)
Wie hoch ist das NO2-Niveau? (Stickstoffdioxid (NO2))
20 (gut)
Wie ist das O3-Niveau heute in Pāli? (Ozon (O3))
14 (gut)
Aktuelle Daten Montag, 31. Oktober 2022, 01:45
PM10 54 (Ungesund für sensible Gruppen)
SO2 10 (gut)
PM2,5 50 (Ungesund für sensible Gruppen)
CO 1130 (gut)
NO2 20 (gut)
O3 14 (gut)
Daten zur Luftverschmutzung der letzten Tage in Pāli
index
2022-10-31
pm10
64
Unhealthy for Sensitive Groups
so2
9
Good
pm25
56
Unhealthy
co
1070
Good
no2
19
Good
o3
18
Good
data source »
Luftverschmutzung in Pāli von März 2018 bis Mai 2020

index
2020-05
2020-04
2020-03
2020-02
2020-01
2019-12
2019-11
2019-10
2019-09
2019-08
2019-07
2019-06
2019-05
2019-04
2019-02
2018-11
2018-10
2018-09
2018-08
2018-05
2018-04
2018-03
pm25
31 (Moderate)
32 (Moderate)
39 (Unhealthy for Sensitive Groups)
60 (Unhealthy)
60 (Unhealthy)
59 (Unhealthy)
62 (Unhealthy)
54 (Unhealthy for Sensitive Groups)
36 (Unhealthy for Sensitive Groups)
36 (Unhealthy for Sensitive Groups)
50 (Unhealthy for Sensitive Groups)
52 (Unhealthy for Sensitive Groups)
102 (Very Unhealthy)
81 (Very Unhealthy)
70 (Unhealthy)
88 (Very Unhealthy)
65 (Unhealthy)
44 (Unhealthy for Sensitive Groups)
43 (Unhealthy for Sensitive Groups)
117 (Very bad Hazardous)
147 (Very bad Hazardous)
182 (Very bad Hazardous)
pm10
66 (Unhealthy for Sensitive Groups)
83 (Unhealthy)
100 (Unhealthy)
123 (Very Unhealthy)
101 (Unhealthy)
100 (Unhealthy)
100 (Unhealthy)
93 (Unhealthy)
69 (Unhealthy for Sensitive Groups)
74 (Unhealthy for Sensitive Groups)
101 (Unhealthy)
107 (Unhealthy)
246 (Very bad Hazardous)
183 (Very bad Hazardous)
124 (Very Unhealthy)
162 (Very bad Hazardous)
141 (Very Unhealthy)
87 (Unhealthy)
98 (Unhealthy)
210 (Very bad Hazardous)
169 (Very bad Hazardous)
137 (Very Unhealthy)
no2
8.1 (Good)
13 (Good)
26 (Good)
23 (Good)
22 (Good)
23 (Good)
22 (Good)
28 (Good)
31 (Good)
31 (Good)
24 (Good)
29 (Good)
39 (Good)
32 (Good)
42 (Moderate)
48 (Moderate)
27 (Good)
23 (Good)
14 (Good)
12 (Good)
9.9 (Good)
15 (Good)
so2
2.1 (Good)
2.6 (Good)
3.9 (Good)
8.2 (Good)
7.9 (Good)
6.7 (Good)
6.4 (Good)
8.5 (Good)
5.6 (Good)
5.7 (Good)
6 (Good)
8.7 (Good)
13 (Good)
22 (Good)
14 (Good)
9.9 (Good)
6.9 (Good)
3.5 (Good)
3.5 (Good)
12 (Good)
18 (Good)
29 (Good)
co
322 (Good)
307 (Good)
335 (Good)
583 (Good)
575 (Good)
577 (Good)
617 (Good)
686 (Good)
668 (Good)
480 (Good)
465 (Good)
456 (Good)
523 (Good)
589 (Good)
654 (Good)
937 (Good)
661 (Good)
454 (Good)
237 (Good)
448 (Good)
11 (Good)
32 (Good)
o3
41 (Good)
40 (Good)
44 (Good)
49 (Good)
37 (Good)
39 (Good)
41 (Good)
34 (Good)
22 (Good)
22 (Good)
30 (Good)
37 (Good)
40 (Good)
38 (Good)
45 (Good)
40 (Good)
47 (Good)
31 (Good)
33 (Good)
36 (Good)
35 (Good)
34 (Good)
data source »
Indira Colony Vistar, Pali - RSPCB
Montag, 31. Oktober 2022, 01:45
PM10 54 (Ungesund für sensible Gruppen)
Feinstaub (PM10) Schwebestaub
SO2 9.8 (gut)
Schwefeldioxid (SO2)
PM2,5 50 (Ungesund für sensible Gruppen)
Feinstaub (PM2,5)
CO 1130 (gut)
Kohlenmonoxid (CO)
NO2 20 (gut)
Stickstoffdioxid (NO2)
O3 14 (gut)
Ozon (O3)
Indira Colony Vistar, Pali - RSPCB
index
2022-10-31
pm10
64
so2
9.1
pm25
56
co
1070
no2
19
o3
18
Indira Colony Vistar, Pali - RSPCB
2018-03 2020-05

index
2020-05
2020-04
2020-03
2020-02
2020-01
2019-12
2019-11
2019-10
2019-09
2019-08
2019-07
2019-06
2019-05
2019-04
2019-02
2018-11
2018-10
2018-09
2018-08
2018-05
2018-04
2018-03
pm25
31
32
39
60
60
59
62
54
36
36
50
52
102
81
70
88
65
44
43
117
147
182
pm10
66
83
100
123
101
100
100
93
69
74
101
107
246
183
124
162
141
87
98
210
169
137
no2
8.1
13
26
23
22
23
22
28
31
31
24
29
39
32
42
48
27
23
14
12
9.9
15
so2
2.1
2.6
3.9
8.2
7.9
6.7
6.4
8.5
5.6
5.7
6
8.7
13
22
14
9.9
6.9
3.5
3.5
12
18
29
co
322
307
335
583
575
577
617
686
668
480
465
456
523
589
654
937
661
454
237
448
11
32
o3
41
40
44
49
37
39
41
34
22
22
30
37
40
38
45
40
47
31
33
36
35
34
* Pollution data source:
https://openaq.org
(caaqm)
The data is licensed under CC-By 4.0
PM10 54 (Ungesund für sensible Gruppen)
SO2 10 (gut)
PM2,5 50 (Ungesund für sensible Gruppen)
CO 1130 (gut)
NO2 20 (gut)
O3 14 (gut)
Daten zur Luftverschmutzung der letzten Tage in Pāli
| index | 2022-10-31 |
|---|---|
| pm10 | 64 Unhealthy for Sensitive Groups |
| so2 | 9 Good |
| pm25 | 56 Unhealthy |
| co | 1070 Good |
| no2 | 19 Good |
| o3 | 18 Good |

| index | 2020-05 | 2020-04 | 2020-03 | 2020-02 | 2020-01 | 2019-12 | 2019-11 | 2019-10 | 2019-09 | 2019-08 | 2019-07 | 2019-06 | 2019-05 | 2019-04 | 2019-02 | 2018-11 | 2018-10 | 2018-09 | 2018-08 | 2018-05 | 2018-04 | 2018-03 |
|---|---|---|---|---|---|---|---|---|---|---|---|---|---|---|---|---|---|---|---|---|---|---|
| pm25 | 31 (Moderate) | 32 (Moderate) | 39 (Unhealthy for Sensitive Groups) | 60 (Unhealthy) | 60 (Unhealthy) | 59 (Unhealthy) | 62 (Unhealthy) | 54 (Unhealthy for Sensitive Groups) | 36 (Unhealthy for Sensitive Groups) | 36 (Unhealthy for Sensitive Groups) | 50 (Unhealthy for Sensitive Groups) | 52 (Unhealthy for Sensitive Groups) | 102 (Very Unhealthy) | 81 (Very Unhealthy) | 70 (Unhealthy) | 88 (Very Unhealthy) | 65 (Unhealthy) | 44 (Unhealthy for Sensitive Groups) | 43 (Unhealthy for Sensitive Groups) | 117 (Very bad Hazardous) | 147 (Very bad Hazardous) | 182 (Very bad Hazardous) |
| pm10 | 66 (Unhealthy for Sensitive Groups) | 83 (Unhealthy) | 100 (Unhealthy) | 123 (Very Unhealthy) | 101 (Unhealthy) | 100 (Unhealthy) | 100 (Unhealthy) | 93 (Unhealthy) | 69 (Unhealthy for Sensitive Groups) | 74 (Unhealthy for Sensitive Groups) | 101 (Unhealthy) | 107 (Unhealthy) | 246 (Very bad Hazardous) | 183 (Very bad Hazardous) | 124 (Very Unhealthy) | 162 (Very bad Hazardous) | 141 (Very Unhealthy) | 87 (Unhealthy) | 98 (Unhealthy) | 210 (Very bad Hazardous) | 169 (Very bad Hazardous) | 137 (Very Unhealthy) |
| no2 | 8.1 (Good) | 13 (Good) | 26 (Good) | 23 (Good) | 22 (Good) | 23 (Good) | 22 (Good) | 28 (Good) | 31 (Good) | 31 (Good) | 24 (Good) | 29 (Good) | 39 (Good) | 32 (Good) | 42 (Moderate) | 48 (Moderate) | 27 (Good) | 23 (Good) | 14 (Good) | 12 (Good) | 9.9 (Good) | 15 (Good) |
| so2 | 2.1 (Good) | 2.6 (Good) | 3.9 (Good) | 8.2 (Good) | 7.9 (Good) | 6.7 (Good) | 6.4 (Good) | 8.5 (Good) | 5.6 (Good) | 5.7 (Good) | 6 (Good) | 8.7 (Good) | 13 (Good) | 22 (Good) | 14 (Good) | 9.9 (Good) | 6.9 (Good) | 3.5 (Good) | 3.5 (Good) | 12 (Good) | 18 (Good) | 29 (Good) |
| co | 322 (Good) | 307 (Good) | 335 (Good) | 583 (Good) | 575 (Good) | 577 (Good) | 617 (Good) | 686 (Good) | 668 (Good) | 480 (Good) | 465 (Good) | 456 (Good) | 523 (Good) | 589 (Good) | 654 (Good) | 937 (Good) | 661 (Good) | 454 (Good) | 237 (Good) | 448 (Good) | 11 (Good) | 32 (Good) |
| o3 | 41 (Good) | 40 (Good) | 44 (Good) | 49 (Good) | 37 (Good) | 39 (Good) | 41 (Good) | 34 (Good) | 22 (Good) | 22 (Good) | 30 (Good) | 37 (Good) | 40 (Good) | 38 (Good) | 45 (Good) | 40 (Good) | 47 (Good) | 31 (Good) | 33 (Good) | 36 (Good) | 35 (Good) | 34 (Good) |
PM10 54 (Ungesund für sensible Gruppen)
Feinstaub (PM10) SchwebestaubSO2 9.8 (gut)
Schwefeldioxid (SO2)PM2,5 50 (Ungesund für sensible Gruppen)
Feinstaub (PM2,5)CO 1130 (gut)
Kohlenmonoxid (CO)NO2 20 (gut)
Stickstoffdioxid (NO2)O3 14 (gut)
Ozon (O3)Indira Colony Vistar, Pali - RSPCB
| index | 2022-10-31 |
|---|---|
| pm10 | 64 |
| so2 | 9.1 |
| pm25 | 56 |
| co | 1070 |
| no2 | 19 |
| o3 | 18 |
Indira Colony Vistar, Pali - RSPCB

| index | 2020-05 | 2020-04 | 2020-03 | 2020-02 | 2020-01 | 2019-12 | 2019-11 | 2019-10 | 2019-09 | 2019-08 | 2019-07 | 2019-06 | 2019-05 | 2019-04 | 2019-02 | 2018-11 | 2018-10 | 2018-09 | 2018-08 | 2018-05 | 2018-04 | 2018-03 |
|---|---|---|---|---|---|---|---|---|---|---|---|---|---|---|---|---|---|---|---|---|---|---|
| pm25 | 31 | 32 | 39 | 60 | 60 | 59 | 62 | 54 | 36 | 36 | 50 | 52 | 102 | 81 | 70 | 88 | 65 | 44 | 43 | 117 | 147 | 182 |
| pm10 | 66 | 83 | 100 | 123 | 101 | 100 | 100 | 93 | 69 | 74 | 101 | 107 | 246 | 183 | 124 | 162 | 141 | 87 | 98 | 210 | 169 | 137 |
| no2 | 8.1 | 13 | 26 | 23 | 22 | 23 | 22 | 28 | 31 | 31 | 24 | 29 | 39 | 32 | 42 | 48 | 27 | 23 | 14 | 12 | 9.9 | 15 |
| so2 | 2.1 | 2.6 | 3.9 | 8.2 | 7.9 | 6.7 | 6.4 | 8.5 | 5.6 | 5.7 | 6 | 8.7 | 13 | 22 | 14 | 9.9 | 6.9 | 3.5 | 3.5 | 12 | 18 | 29 |
| co | 322 | 307 | 335 | 583 | 575 | 577 | 617 | 686 | 668 | 480 | 465 | 456 | 523 | 589 | 654 | 937 | 661 | 454 | 237 | 448 | 11 | 32 |
| o3 | 41 | 40 | 44 | 49 | 37 | 39 | 41 | 34 | 22 | 22 | 30 | 37 | 40 | 38 | 45 | 40 | 47 | 31 | 33 | 36 | 35 | 34 |