Luftverschmutzung in Mahalakshmi: Echtzeit-Luft-Qualitätsindex und Smog-Alarm.
Für die Mahalakshmi. Heute ist Samstag, 13. Juni 2026. Für Mahalakshmi wurden folgende Luftverschmutzungswerte gemessen:- Feinstaub (PM2,5) - 66 (ungesund)
- Feinstaub (PM10) Schwebestaub - 121 (Sehr ungesund)
- Stickstoffdioxid (NO2) - 0 (gut)
- Schwefeldioxid (SO2) - 13 (gut)
- Kohlenmonoxid (CO) - 1400 (gut)
- Ozon (O3) - 4 (gut)

Wie ist die Luftqualität Mahalakshmi heute? Ist die Luft in Mahalakshmi? verschmutzt. Gibt es Smog?
Wie hoch ist der aktuelle PM2,5-Wert in Mahalakshmi? (Feinstaub (PM2,5))
Die heutige PM2.5-Stufe ist:
66 (ungesund)
Zum Vergleich: Der höchste PM2,5-Wert in Mahalakshmi in den letzten 7 Tagen war: 66 (Montag, 31. Oktober 2022) und der niedrigste: 66 (Montag, 31. Oktober 2022).
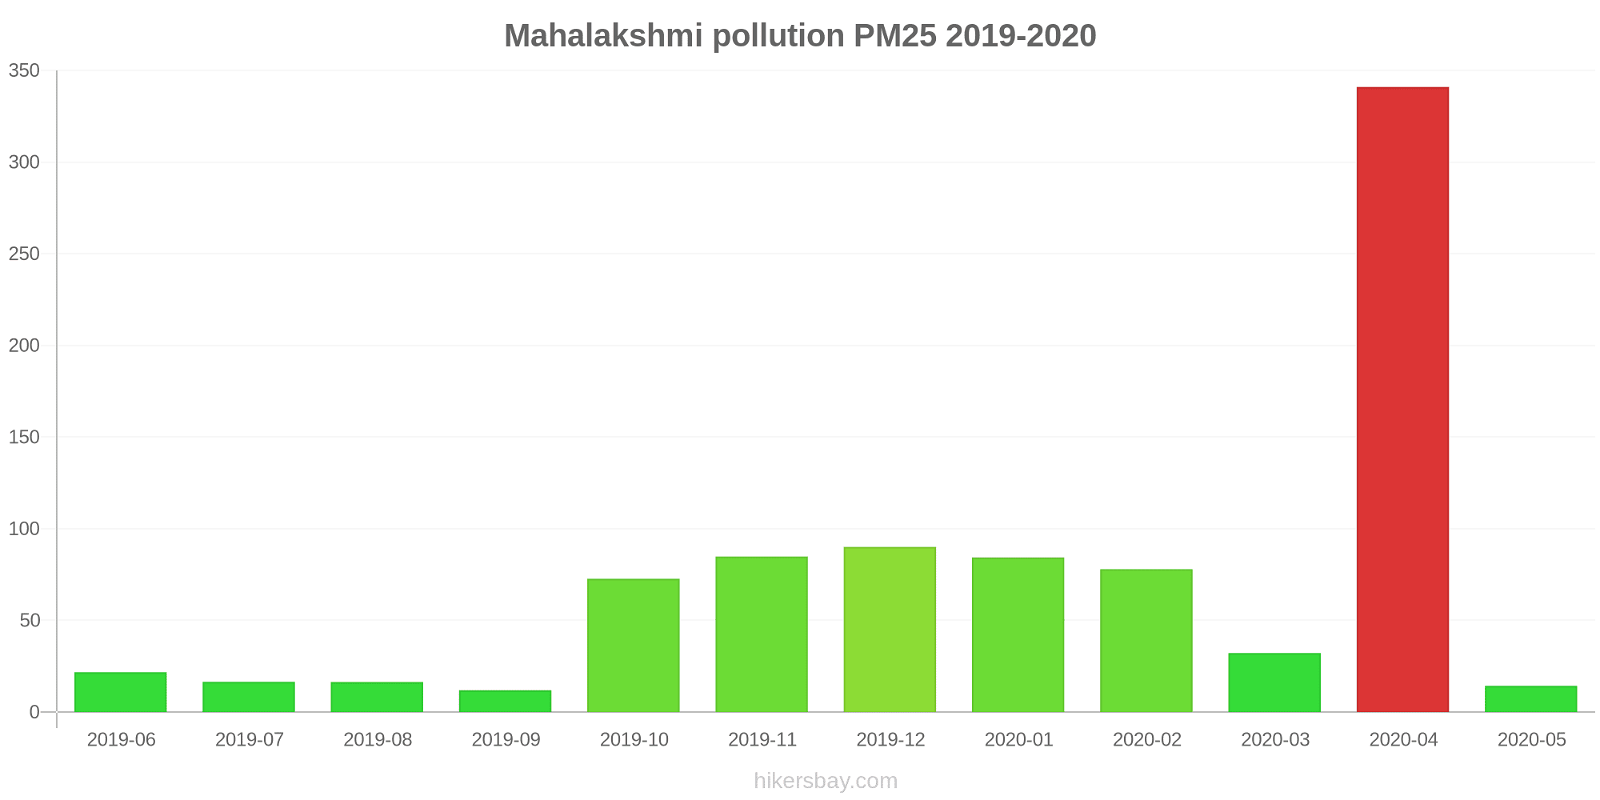
Die höchsten PM2,5-Werte wurden gemessen: 341 (April 2020).
Die niedrigste Feinstaubbelastung PM2,5 tritt im Monat auf: September (12).
Wie hoch ist der PM10-Stand heute in Mahalakshmi? (Feinstaub (PM10) Schwebestaub)
Der aktuelle Feinstaubgehalt PM10 in Mahalakshmi is:
121 (Sehr ungesund)
Die höchsten PM10-Werte treten in der Regel im Monat auf: 338 (April 2020).
Der niedrigste Wert der Feinstaub-PM10-Belastung in Mahalakshmi ist in der Regel in: September (41).
Wie hoch ist das NO2-Niveau? (Stickstoffdioxid (NO2))
0 (gut)
Wie hoch ist die SO2-Belastung? (Schwefeldioxid (SO2))
13 (gut)
Wie hoch ist der CO-Gehalt? (Kohlenmonoxid (CO))
1400 (gut)
Wie ist das O3-Niveau heute in Mahalakshmi? (Ozon (O3))
4 (gut)
Aktuelle Daten Montag, 31. Oktober 2022, 02:00
PM2,5 66 (ungesund)
PM10 121 (Sehr ungesund)
NO2 0 (gut)
SO2 13 (gut)
CO 1400 (gut)
O3 4 (gut)
Daten zur Luftverschmutzung der letzten Tage in Mahalakshmi
index
2022-10-31
pm25
66
Unhealthy
pm10
121
Very Unhealthy
no2
0
Good
so2
13
Good
co
1400
Good
o3
4
Good
data source »
Luftverschmutzung in Mahalakshmi von Juni 2019 bis Mai 2020
index
2020-05
2020-04
2020-03
2020-02
2020-01
2019-12
2019-11
2019-10
2019-09
2019-08
2019-07
2019-06
pm25
14 (Moderate)
341 (Very bad Hazardous)
32 (Moderate)
78 (Very Unhealthy)
84 (Very Unhealthy)
90 (Very Unhealthy)
85 (Very Unhealthy)
73 (Unhealthy)
12 (Good)
16 (Moderate)
17 (Moderate)
22 (Moderate)
pm10
52 (Unhealthy for Sensitive Groups)
338 (Very bad Hazardous)
91 (Unhealthy)
146 (Very Unhealthy)
136 (Very Unhealthy)
138 (Very Unhealthy)
138 (Very Unhealthy)
85 (Unhealthy)
41 (Moderate)
61 (Unhealthy for Sensitive Groups)
63 (Unhealthy for Sensitive Groups)
80 (Unhealthy)
no2
5.3 (Good)
4.8 (Good)
22 (Good)
44 (Moderate)
40 (Moderate)
38 (Good)
36 (Good)
21 (Good)
10 (Good)
7.3 (Good)
9.8 (Good)
8.2 (Good)
so2
3.8 (Good)
3.9 (Good)
5.5 (Good)
12 (Good)
10 (Good)
6.5 (Good)
6.9 (Good)
12 (Good)
3.5 (Good)
2.5 (Good)
6.2 (Good)
1.7 (Good)
co
222 (Good)
273 (Good)
331 (Good)
741 (Good)
724 (Good)
717 (Good)
742 (Good)
455 (Good)
261 (Good)
240 (Good)
281 (Good)
348 (Good)
o3
27 (Good)
35 (Good)
50 (Good)
367 (Very bad Hazardous)
55 (Good)
62 (Good)
55 (Good)
23 (Good)
21 (Good)
13 (Good)
14 (Good)
13 (Good)
data source »
Worli, Mumbai - MPCB
Montag, 31. Oktober 2022, 02:00
PM2,5 66 (ungesund)
Feinstaub (PM2,5)
PM10 121 (Sehr ungesund)
Feinstaub (PM10) Schwebestaub
NO2 0.08 (gut)
Stickstoffdioxid (NO2)
SO2 13 (gut)
Schwefeldioxid (SO2)
CO 1400 (gut)
Kohlenmonoxid (CO)
O3 4 (gut)
Ozon (O3)
Worli, Mumbai - MPCB
index
2022-10-31
pm25
66
pm10
121
no2
0.08
so2
13
co
1400
o3
4
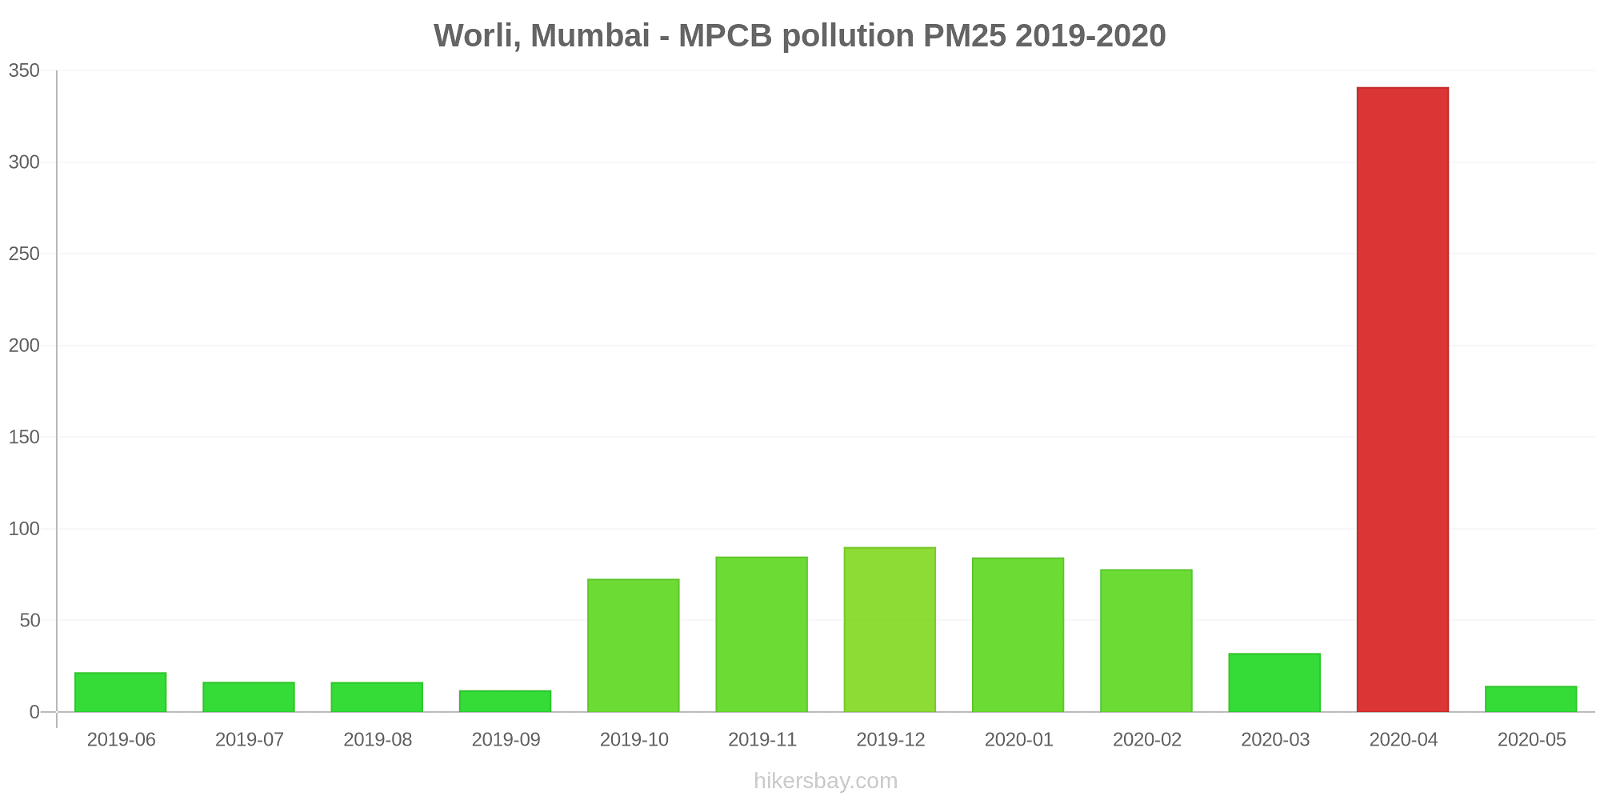
Worli, Mumbai - MPCB
2019-06 2020-05
index
2020-05
2020-04
2020-03
2020-02
2020-01
2019-12
2019-11
2019-10
2019-09
2019-08
2019-07
2019-06
pm25
14
341
32
78
84
90
85
73
12
16
17
22
pm10
52
338
91
146
136
138
138
85
41
61
63
80
no2
5.3
4.8
22
44
40
38
36
21
10
7.3
9.8
8.2
so2
3.8
3.9
5.5
12
10
6.5
6.9
12
3.5
2.5
6.2
1.7
co
222
273
331
741
724
717
742
455
261
240
281
348
o3
27
35
50
367
55
62
55
23
21
13
14
13
* Pollution data source:
https://openaq.org
(caaqm)
The data is licensed under CC-By 4.0
PM2,5 66 (ungesund)
PM10 121 (Sehr ungesund)
NO2 0 (gut)
SO2 13 (gut)
CO 1400 (gut)
O3 4 (gut)
Daten zur Luftverschmutzung der letzten Tage in Mahalakshmi
| index | 2022-10-31 |
|---|---|
| pm25 | 66 Unhealthy |
| pm10 | 121 Very Unhealthy |
| no2 | 0 Good |
| so2 | 13 Good |
| co | 1400 Good |
| o3 | 4 Good |

| index | 2020-05 | 2020-04 | 2020-03 | 2020-02 | 2020-01 | 2019-12 | 2019-11 | 2019-10 | 2019-09 | 2019-08 | 2019-07 | 2019-06 |
|---|---|---|---|---|---|---|---|---|---|---|---|---|
| pm25 | 14 (Moderate) | 341 (Very bad Hazardous) | 32 (Moderate) | 78 (Very Unhealthy) | 84 (Very Unhealthy) | 90 (Very Unhealthy) | 85 (Very Unhealthy) | 73 (Unhealthy) | 12 (Good) | 16 (Moderate) | 17 (Moderate) | 22 (Moderate) |
| pm10 | 52 (Unhealthy for Sensitive Groups) | 338 (Very bad Hazardous) | 91 (Unhealthy) | 146 (Very Unhealthy) | 136 (Very Unhealthy) | 138 (Very Unhealthy) | 138 (Very Unhealthy) | 85 (Unhealthy) | 41 (Moderate) | 61 (Unhealthy for Sensitive Groups) | 63 (Unhealthy for Sensitive Groups) | 80 (Unhealthy) |
| no2 | 5.3 (Good) | 4.8 (Good) | 22 (Good) | 44 (Moderate) | 40 (Moderate) | 38 (Good) | 36 (Good) | 21 (Good) | 10 (Good) | 7.3 (Good) | 9.8 (Good) | 8.2 (Good) |
| so2 | 3.8 (Good) | 3.9 (Good) | 5.5 (Good) | 12 (Good) | 10 (Good) | 6.5 (Good) | 6.9 (Good) | 12 (Good) | 3.5 (Good) | 2.5 (Good) | 6.2 (Good) | 1.7 (Good) |
| co | 222 (Good) | 273 (Good) | 331 (Good) | 741 (Good) | 724 (Good) | 717 (Good) | 742 (Good) | 455 (Good) | 261 (Good) | 240 (Good) | 281 (Good) | 348 (Good) |
| o3 | 27 (Good) | 35 (Good) | 50 (Good) | 367 (Very bad Hazardous) | 55 (Good) | 62 (Good) | 55 (Good) | 23 (Good) | 21 (Good) | 13 (Good) | 14 (Good) | 13 (Good) |
PM2,5 66 (ungesund)
Feinstaub (PM2,5)PM10 121 (Sehr ungesund)
Feinstaub (PM10) SchwebestaubNO2 0.08 (gut)
Stickstoffdioxid (NO2)SO2 13 (gut)
Schwefeldioxid (SO2)CO 1400 (gut)
Kohlenmonoxid (CO)O3 4 (gut)
Ozon (O3)Worli, Mumbai - MPCB
| index | 2022-10-31 |
|---|---|
| pm25 | 66 |
| pm10 | 121 |
| no2 | 0.08 |
| so2 | 13 |
| co | 1400 |
| o3 | 4 |
Worli, Mumbai - MPCB

| index | 2020-05 | 2020-04 | 2020-03 | 2020-02 | 2020-01 | 2019-12 | 2019-11 | 2019-10 | 2019-09 | 2019-08 | 2019-07 | 2019-06 |
|---|---|---|---|---|---|---|---|---|---|---|---|---|
| pm25 | 14 | 341 | 32 | 78 | 84 | 90 | 85 | 73 | 12 | 16 | 17 | 22 |
| pm10 | 52 | 338 | 91 | 146 | 136 | 138 | 138 | 85 | 41 | 61 | 63 | 80 |
| no2 | 5.3 | 4.8 | 22 | 44 | 40 | 38 | 36 | 21 | 10 | 7.3 | 9.8 | 8.2 |
| so2 | 3.8 | 3.9 | 5.5 | 12 | 10 | 6.5 | 6.9 | 12 | 3.5 | 2.5 | 6.2 | 1.7 |
| co | 222 | 273 | 331 | 741 | 724 | 717 | 742 | 455 | 261 | 240 | 281 | 348 |
| o3 | 27 | 35 | 50 | 367 | 55 | 62 | 55 | 23 | 21 | 13 | 14 | 13 |