Luftverschmutzung in Jogeshwari: Echtzeit-Luft-Qualitätsindex und Smog-Alarm.
Für die Jogeshwari. Heute ist Sonntag, 14. Dezember 2025. Für Jogeshwari wurden folgende Luftverschmutzungswerte gemessen:- Feinstaub (PM10) Schwebestaub - 117 (Sehr ungesund)
- Schwefeldioxid (SO2) - 13 (gut)
- Feinstaub (PM2,5) - 63 (ungesund)
- Kohlenmonoxid (CO) - 1000 (gut)
- Stickstoffdioxid (NO2) - 22 (gut)
- Ozon (O3) - 3 (gut)

Wie ist die Luftqualität Jogeshwari heute? Ist die Luft in Jogeshwari? verschmutzt. Gibt es Smog?
Wie hoch ist der PM10-Stand heute in Jogeshwari? (Feinstaub (PM10) Schwebestaub)
Der aktuelle Feinstaubgehalt PM10 in Jogeshwari is:
117 (Sehr ungesund)
Die höchsten PM10-Werte treten in der Regel im Monat auf: 120 (November 2018).
Der niedrigste Wert der Feinstaub-PM10-Belastung in Jogeshwari ist in der Regel in: Mai (42).
Wie hoch ist die SO2-Belastung? (Schwefeldioxid (SO2))
13 (gut)
Wie hoch ist der aktuelle PM2,5-Wert in Jogeshwari? (Feinstaub (PM2,5))
Die heutige PM2.5-Stufe ist:
63 (ungesund)
Zum Vergleich: Der höchste PM2,5-Wert in Jogeshwari in den letzten 7 Tagen war: 58 (Montag, 31. Oktober 2022) und der niedrigste: 58 (Montag, 31. Oktober 2022).
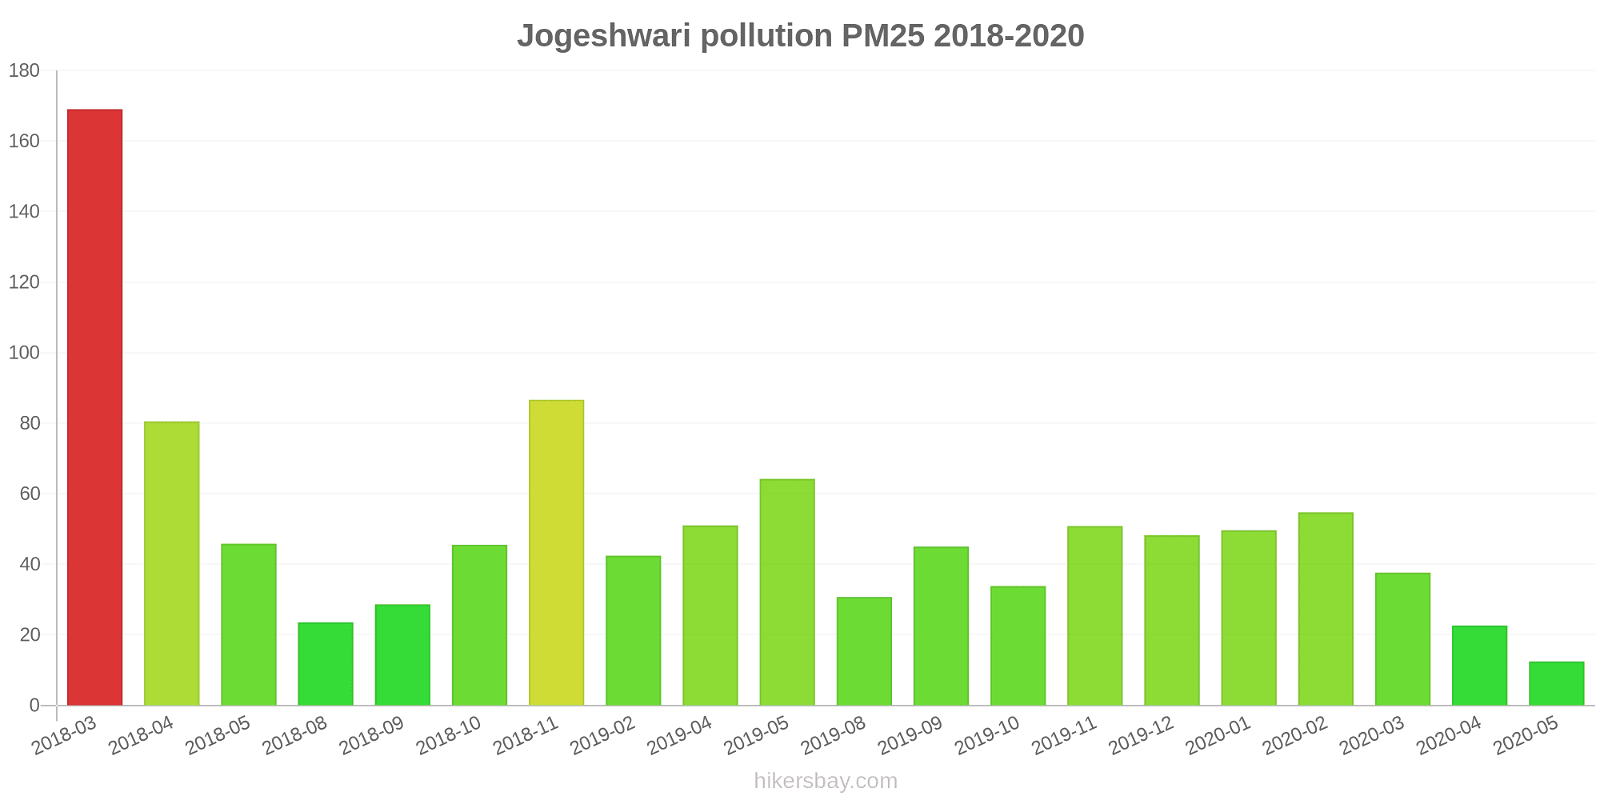
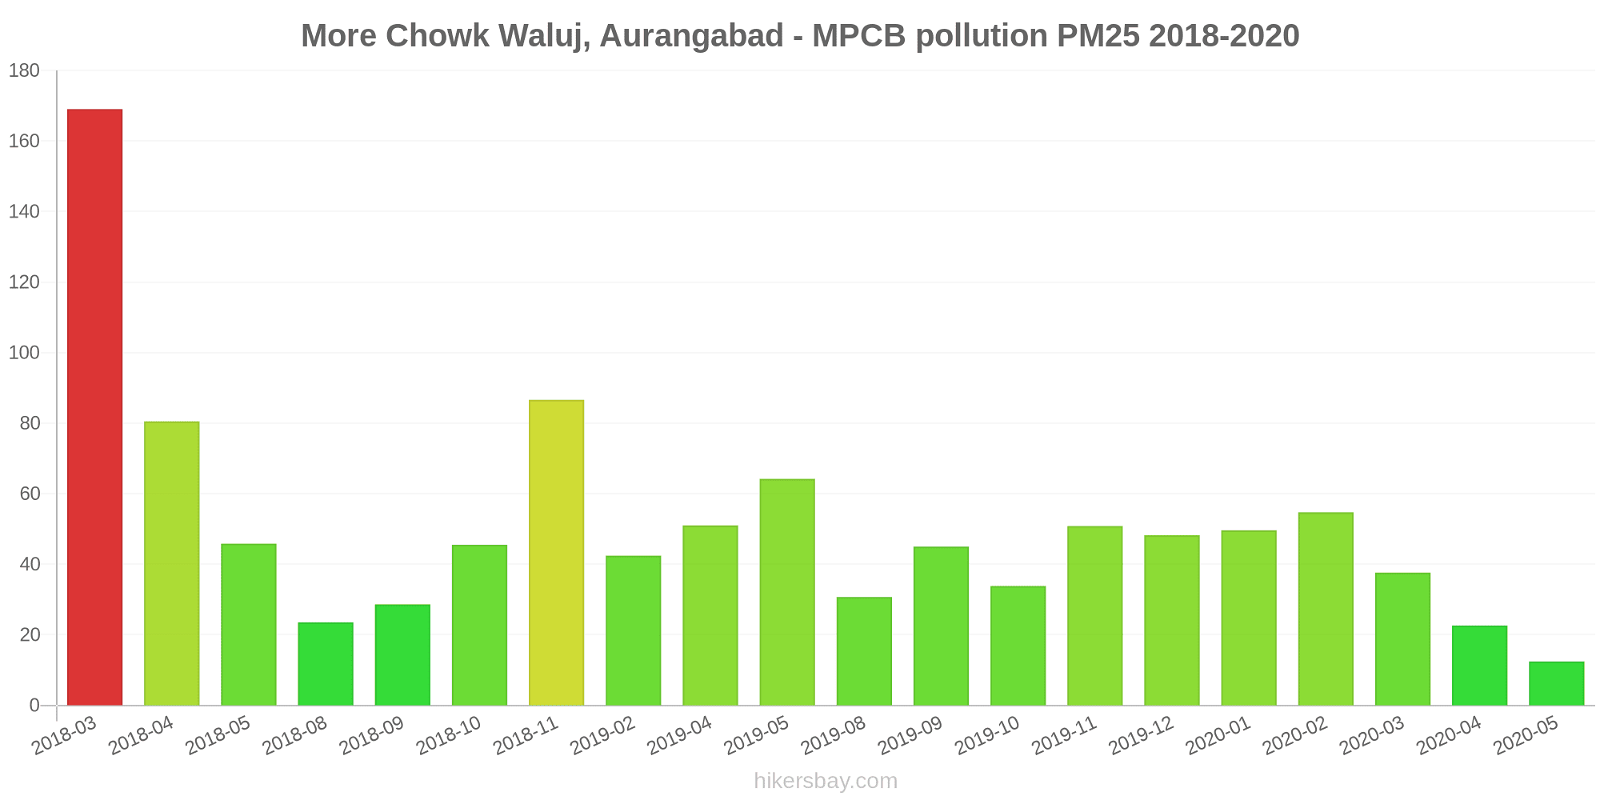
Die höchsten PM2,5-Werte wurden gemessen: 169 (März 2018).
Die niedrigste Feinstaubbelastung PM2,5 tritt im Monat auf: Mai (12).
Wie hoch ist der CO-Gehalt? (Kohlenmonoxid (CO))
1000 (gut)
Wie hoch ist das NO2-Niveau? (Stickstoffdioxid (NO2))
22 (gut)
Wie ist das O3-Niveau heute in Jogeshwari? (Ozon (O3))
3 (gut)
Aktuelle Daten Montag, 31. Oktober 2022, 01:45
PM10 117 (Sehr ungesund)
SO2 13 (gut)
PM2,5 63 (ungesund)
CO 1000 (gut)
NO2 22 (gut)
O3 3 (gut)
Daten zur Luftverschmutzung der letzten Tage in Jogeshwari
index
2022-10-31
pm10
113
Very Unhealthy
so2
13
Good
pm25
58
Unhealthy
co
910
Good
no2
22
Good
o3
2
Good
data source »
Luftverschmutzung in Jogeshwari von März 2018 bis Mai 2020

index
2020-05
2020-04
2020-03
2020-02
2020-01
2019-12
2019-11
2019-10
2019-09
2019-08
2019-07
2019-05
2019-04
2019-02
2018-11
2018-10
2018-09
2018-08
2018-05
2018-04
2018-03
pm25
12 (Good)
23 (Moderate)
38 (Unhealthy for Sensitive Groups)
55 (Unhealthy for Sensitive Groups)
50 (Unhealthy for Sensitive Groups)
48 (Unhealthy for Sensitive Groups)
51 (Unhealthy for Sensitive Groups)
34 (Moderate)
45 (Unhealthy for Sensitive Groups)
31 (Moderate)
- (Good)
64 (Unhealthy)
51 (Unhealthy for Sensitive Groups)
42 (Unhealthy for Sensitive Groups)
87 (Very Unhealthy)
46 (Unhealthy for Sensitive Groups)
29 (Moderate)
24 (Moderate)
46 (Unhealthy for Sensitive Groups)
81 (Very Unhealthy)
169 (Very bad Hazardous)
pm10
42 (Moderate)
43 (Moderate)
71 (Unhealthy for Sensitive Groups)
75 (Unhealthy for Sensitive Groups)
99 (Unhealthy)
87 (Unhealthy)
81 (Unhealthy)
64 (Unhealthy for Sensitive Groups)
62 (Unhealthy for Sensitive Groups)
66 (Unhealthy for Sensitive Groups)
77 (Unhealthy for Sensitive Groups)
89 (Unhealthy)
74 (Unhealthy for Sensitive Groups)
71 (Unhealthy for Sensitive Groups)
120 (Very Unhealthy)
81 (Unhealthy)
61 (Unhealthy for Sensitive Groups)
49 (Moderate)
105 (Unhealthy)
106 (Unhealthy)
119 (Very Unhealthy)
no2
23 (Good)
18 (Good)
22 (Good)
13 (Good)
14 (Good)
13 (Good)
6.4 (Good)
21 (Good)
16 (Good)
17 (Good)
25 (Good)
2.2 (Good)
1.8 (Good)
- (Good)
12 (Good)
27 (Good)
7.3 (Good)
18 (Good)
31 (Good)
23 (Good)
46 (Moderate)
so2
5.5 (Good)
5.5 (Good)
7.3 (Good)
9.3 (Good)
7.8 (Good)
9.3 (Good)
7.5 (Good)
8.2 (Good)
11 (Good)
6.5 (Good)
5.1 (Good)
3.3 (Good)
3.2 (Good)
8.1 (Good)
4.4 (Good)
6.7 (Good)
5 (Good)
4.8 (Good)
4.8 (Good)
5.9 (Good)
6.8 (Good)
co
427 (Good)
560 (Good)
650 (Good)
876 (Good)
750 (Good)
791 (Good)
879 (Good)
728 (Good)
654 (Good)
411 (Good)
454 (Good)
454 (Good)
382 (Good)
788 (Good)
844 (Good)
683 (Good)
531 (Good)
452 (Good)
510 (Good)
21 (Good)
48 (Good)
o3
50 (Good)
49 (Good)
153 (Unhealthy)
52 (Good)
25 (Good)
30 (Good)
31 (Good)
158 (Unhealthy)
13 (Good)
23 (Good)
17 (Good)
- (Good)
57 (Good)
70 (Good)
55 (Good)
72 (Moderate)
45 (Good)
18 (Good)
67 (Good)
62 (Good)
55 (Good)
data source »
More Chowk Waluj, Aurangabad - MPCB
Montag, 31. Oktober 2022, 01:45
PM10 117 (Sehr ungesund)
Feinstaub (PM10) Schwebestaub
SO2 13 (gut)
Schwefeldioxid (SO2)
PM2,5 63 (ungesund)
Feinstaub (PM2,5)
CO 1000 (gut)
Kohlenmonoxid (CO)
NO2 22 (gut)
Stickstoffdioxid (NO2)
O3 2.9 (gut)
Ozon (O3)
More Chowk Waluj, Aurangabad - MPCB
index
2022-10-31
pm10
113
so2
13
pm25
58
co
910
no2
22
o3
2.1
More Chowk Waluj, Aurangabad - MPCB
2018-03 2020-05

index
2020-05
2020-04
2020-03
2020-02
2020-01
2019-12
2019-11
2019-10
2019-09
2019-08
2019-07
2019-05
2019-04
2019-02
2018-11
2018-10
2018-09
2018-08
2018-05
2018-04
2018-03
co
427
560
650
876
750
791
879
728
654
411
454
454
382
788
844
683
531
452
510
21
48
o3
50
49
153
52
25
30
31
158
13
23
17
-
57
70
55
72
45
18
67
62
55
pm25
12
23
38
55
50
48
51
34
45
31
-
64
51
42
87
46
29
24
46
81
169
pm10
42
43
71
75
99
87
81
64
62
66
77
89
74
71
120
81
61
49
105
106
119
no2
23
18
22
13
14
13
6.4
21
16
17
25
2.2
1.8
-
12
27
7.3
18
31
23
46
so2
5.5
5.5
7.3
9.3
7.8
9.3
7.5
8.2
11
6.5
5.1
3.3
3.2
8.1
4.4
6.7
5
4.8
4.8
5.9
6.8
* Pollution data source:
https://openaq.org
(caaqm)
The data is licensed under CC-By 4.0
PM10 117 (Sehr ungesund)
SO2 13 (gut)
PM2,5 63 (ungesund)
CO 1000 (gut)
NO2 22 (gut)
O3 3 (gut)
Daten zur Luftverschmutzung der letzten Tage in Jogeshwari
| index | 2022-10-31 |
|---|---|
| pm10 | 113 Very Unhealthy |
| so2 | 13 Good |
| pm25 | 58 Unhealthy |
| co | 910 Good |
| no2 | 22 Good |
| o3 | 2 Good |

| index | 2020-05 | 2020-04 | 2020-03 | 2020-02 | 2020-01 | 2019-12 | 2019-11 | 2019-10 | 2019-09 | 2019-08 | 2019-07 | 2019-05 | 2019-04 | 2019-02 | 2018-11 | 2018-10 | 2018-09 | 2018-08 | 2018-05 | 2018-04 | 2018-03 |
|---|---|---|---|---|---|---|---|---|---|---|---|---|---|---|---|---|---|---|---|---|---|
| pm25 | 12 (Good) | 23 (Moderate) | 38 (Unhealthy for Sensitive Groups) | 55 (Unhealthy for Sensitive Groups) | 50 (Unhealthy for Sensitive Groups) | 48 (Unhealthy for Sensitive Groups) | 51 (Unhealthy for Sensitive Groups) | 34 (Moderate) | 45 (Unhealthy for Sensitive Groups) | 31 (Moderate) | - (Good) | 64 (Unhealthy) | 51 (Unhealthy for Sensitive Groups) | 42 (Unhealthy for Sensitive Groups) | 87 (Very Unhealthy) | 46 (Unhealthy for Sensitive Groups) | 29 (Moderate) | 24 (Moderate) | 46 (Unhealthy for Sensitive Groups) | 81 (Very Unhealthy) | 169 (Very bad Hazardous) |
| pm10 | 42 (Moderate) | 43 (Moderate) | 71 (Unhealthy for Sensitive Groups) | 75 (Unhealthy for Sensitive Groups) | 99 (Unhealthy) | 87 (Unhealthy) | 81 (Unhealthy) | 64 (Unhealthy for Sensitive Groups) | 62 (Unhealthy for Sensitive Groups) | 66 (Unhealthy for Sensitive Groups) | 77 (Unhealthy for Sensitive Groups) | 89 (Unhealthy) | 74 (Unhealthy for Sensitive Groups) | 71 (Unhealthy for Sensitive Groups) | 120 (Very Unhealthy) | 81 (Unhealthy) | 61 (Unhealthy for Sensitive Groups) | 49 (Moderate) | 105 (Unhealthy) | 106 (Unhealthy) | 119 (Very Unhealthy) |
| no2 | 23 (Good) | 18 (Good) | 22 (Good) | 13 (Good) | 14 (Good) | 13 (Good) | 6.4 (Good) | 21 (Good) | 16 (Good) | 17 (Good) | 25 (Good) | 2.2 (Good) | 1.8 (Good) | - (Good) | 12 (Good) | 27 (Good) | 7.3 (Good) | 18 (Good) | 31 (Good) | 23 (Good) | 46 (Moderate) |
| so2 | 5.5 (Good) | 5.5 (Good) | 7.3 (Good) | 9.3 (Good) | 7.8 (Good) | 9.3 (Good) | 7.5 (Good) | 8.2 (Good) | 11 (Good) | 6.5 (Good) | 5.1 (Good) | 3.3 (Good) | 3.2 (Good) | 8.1 (Good) | 4.4 (Good) | 6.7 (Good) | 5 (Good) | 4.8 (Good) | 4.8 (Good) | 5.9 (Good) | 6.8 (Good) |
| co | 427 (Good) | 560 (Good) | 650 (Good) | 876 (Good) | 750 (Good) | 791 (Good) | 879 (Good) | 728 (Good) | 654 (Good) | 411 (Good) | 454 (Good) | 454 (Good) | 382 (Good) | 788 (Good) | 844 (Good) | 683 (Good) | 531 (Good) | 452 (Good) | 510 (Good) | 21 (Good) | 48 (Good) |
| o3 | 50 (Good) | 49 (Good) | 153 (Unhealthy) | 52 (Good) | 25 (Good) | 30 (Good) | 31 (Good) | 158 (Unhealthy) | 13 (Good) | 23 (Good) | 17 (Good) | - (Good) | 57 (Good) | 70 (Good) | 55 (Good) | 72 (Moderate) | 45 (Good) | 18 (Good) | 67 (Good) | 62 (Good) | 55 (Good) |
PM10 117 (Sehr ungesund)
Feinstaub (PM10) SchwebestaubSO2 13 (gut)
Schwefeldioxid (SO2)PM2,5 63 (ungesund)
Feinstaub (PM2,5)CO 1000 (gut)
Kohlenmonoxid (CO)NO2 22 (gut)
Stickstoffdioxid (NO2)O3 2.9 (gut)
Ozon (O3)More Chowk Waluj, Aurangabad - MPCB
| index | 2022-10-31 |
|---|---|
| pm10 | 113 |
| so2 | 13 |
| pm25 | 58 |
| co | 910 |
| no2 | 22 |
| o3 | 2.1 |
More Chowk Waluj, Aurangabad - MPCB

| index | 2020-05 | 2020-04 | 2020-03 | 2020-02 | 2020-01 | 2019-12 | 2019-11 | 2019-10 | 2019-09 | 2019-08 | 2019-07 | 2019-05 | 2019-04 | 2019-02 | 2018-11 | 2018-10 | 2018-09 | 2018-08 | 2018-05 | 2018-04 | 2018-03 |
|---|---|---|---|---|---|---|---|---|---|---|---|---|---|---|---|---|---|---|---|---|---|
| co | 427 | 560 | 650 | 876 | 750 | 791 | 879 | 728 | 654 | 411 | 454 | 454 | 382 | 788 | 844 | 683 | 531 | 452 | 510 | 21 | 48 |
| o3 | 50 | 49 | 153 | 52 | 25 | 30 | 31 | 158 | 13 | 23 | 17 | - | 57 | 70 | 55 | 72 | 45 | 18 | 67 | 62 | 55 |
| pm25 | 12 | 23 | 38 | 55 | 50 | 48 | 51 | 34 | 45 | 31 | - | 64 | 51 | 42 | 87 | 46 | 29 | 24 | 46 | 81 | 169 |
| pm10 | 42 | 43 | 71 | 75 | 99 | 87 | 81 | 64 | 62 | 66 | 77 | 89 | 74 | 71 | 120 | 81 | 61 | 49 | 105 | 106 | 119 |
| no2 | 23 | 18 | 22 | 13 | 14 | 13 | 6.4 | 21 | 16 | 17 | 25 | 2.2 | 1.8 | - | 12 | 27 | 7.3 | 18 | 31 | 23 | 46 |
| so2 | 5.5 | 5.5 | 7.3 | 9.3 | 7.8 | 9.3 | 7.5 | 8.2 | 11 | 6.5 | 5.1 | 3.3 | 3.2 | 8.1 | 4.4 | 6.7 | 5 | 4.8 | 4.8 | 5.9 | 6.8 |