Luftverschmutzung in Bulandshahr district: Echtzeit-Luft-Qualitätsindex und Smog-Alarm.
Für die Bulandshahr district. Heute ist Sonntag, 14. Dezember 2025. Für Bulandshahr district wurden folgende Luftverschmutzungswerte gemessen:- Feinstaub (PM2,5) - 160 (Sehr schlecht Gefährlich)
- Feinstaub (PM10) Schwebestaub - 302 (Sehr schlecht Gefährlich)
- Stickstoffdioxid (NO2) - 18 (gut)
- Ozon (O3) - 2 (gut)

Wie ist die Luftqualität Bulandshahr district heute? Ist die Luft in Bulandshahr district? verschmutzt. Gibt es Smog?
Wie hoch ist der aktuelle PM2,5-Wert in Bulandshahr district? (Feinstaub (PM2,5))
Die heutige PM2.5-Stufe ist:
160 (Sehr schlecht Gefährlich)
Zum Vergleich: Der höchste PM2,5-Wert in Bulandshahr district in den letzten 7 Tagen war: 160 (Montag, 31. Oktober 2022) und der niedrigste: 160 (Montag, 31. Oktober 2022).
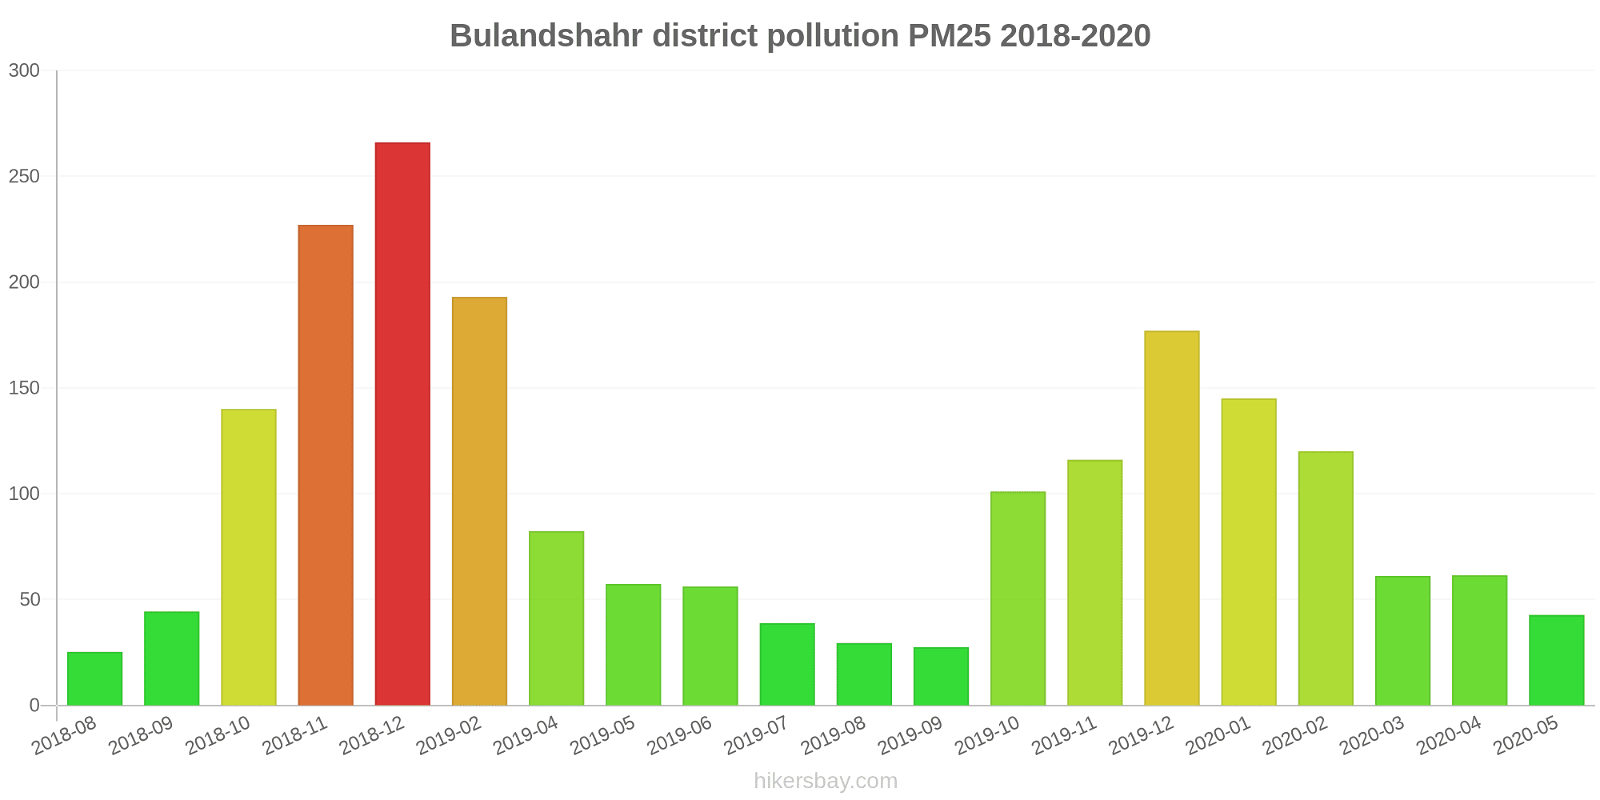
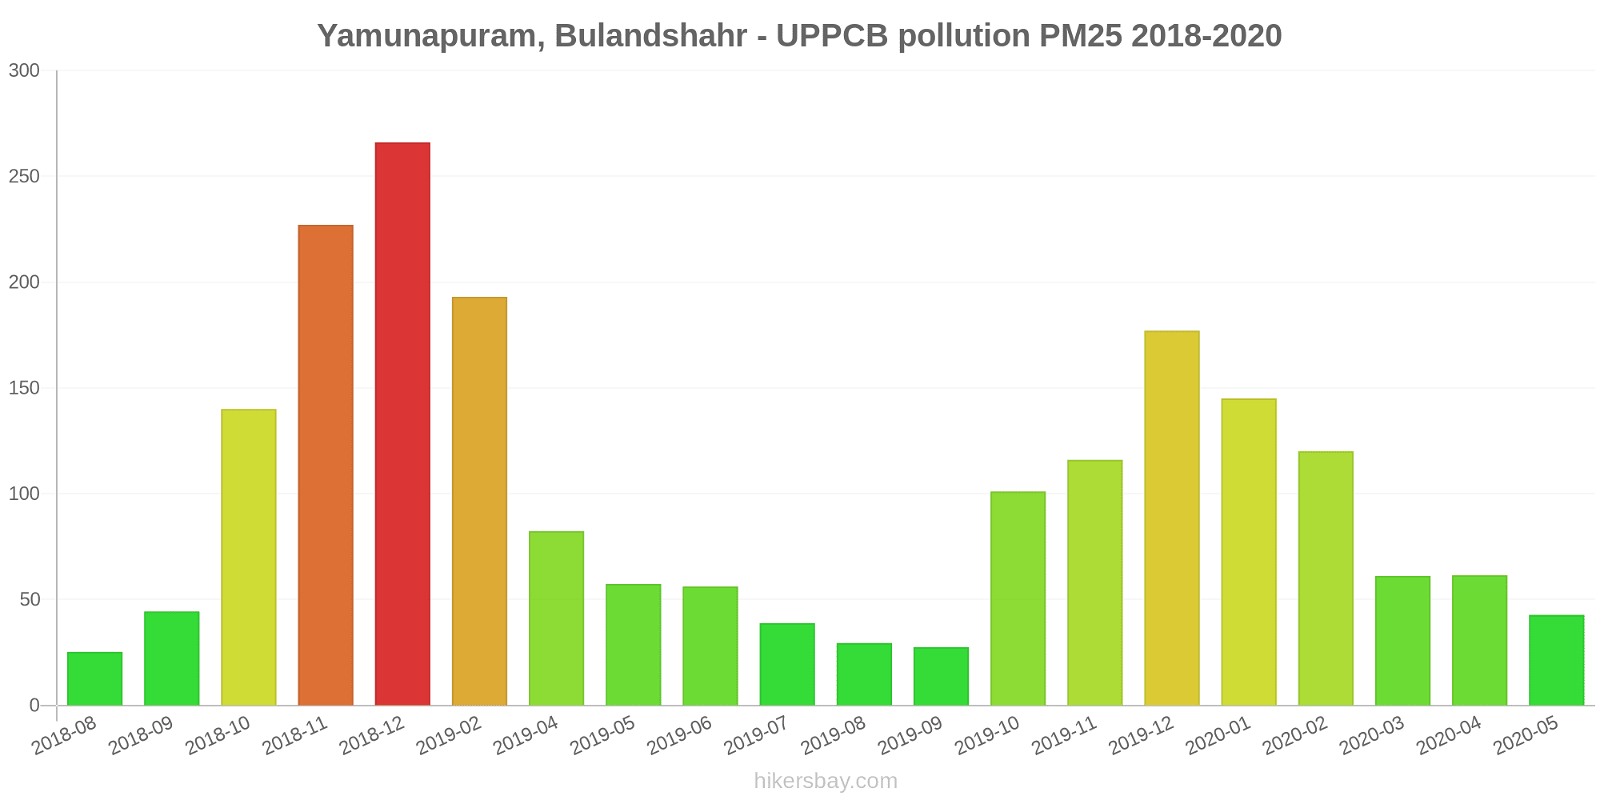
Die höchsten PM2,5-Werte wurden gemessen: 266 (Dezember 2018).
Die niedrigste Feinstaubbelastung PM2,5 tritt im Monat auf: August (25).
Wie hoch ist der PM10-Stand heute in Bulandshahr district? (Feinstaub (PM10) Schwebestaub)
Der aktuelle Feinstaubgehalt PM10 in Bulandshahr district is:
302 (Sehr schlecht Gefährlich)
Die höchsten PM10-Werte treten in der Regel im Monat auf: 368 (Dezember 2018).
Der niedrigste Wert der Feinstaub-PM10-Belastung in Bulandshahr district ist in der Regel in: September (51).
Wie hoch ist das NO2-Niveau? (Stickstoffdioxid (NO2))
18 (gut)
Wie ist das O3-Niveau heute in Bulandshahr district? (Ozon (O3))
2 (gut)
Aktuelle Daten Montag, 31. Oktober 2022, 01:00
PM2,5 160 (Sehr schlecht Gefährlich)
PM10 302 (Sehr schlecht Gefährlich)
NO2 18 (gut)
O3 2 (gut)
Daten zur Luftverschmutzung der letzten Tage in Bulandshahr district
index
2022-10-31
pm25
160
Very bad Hazardous
pm10
302
Very bad Hazardous
no2
18
Good
o3
2
Good
data source »
Luftverschmutzung in Bulandshahr district von August 2018 bis Mai 2020

index
2020-05
2020-04
2020-03
2020-02
2020-01
2019-12
2019-11
2019-10
2019-09
2019-08
2019-07
2019-06
2019-05
2019-04
2019-02
2018-12
2018-11
2018-10
2018-09
2018-08
pm25
43 (Unhealthy for Sensitive Groups)
61 (Unhealthy)
61 (Unhealthy)
120 (Very bad Hazardous)
145 (Very bad Hazardous)
177 (Very bad Hazardous)
116 (Very bad Hazardous)
101 (Very Unhealthy)
27 (Moderate)
29 (Moderate)
39 (Unhealthy for Sensitive Groups)
56 (Unhealthy)
57 (Unhealthy)
82 (Very Unhealthy)
193 (Very bad Hazardous)
266 (Very bad Hazardous)
227 (Very bad Hazardous)
140 (Very bad Hazardous)
44 (Unhealthy for Sensitive Groups)
25 (Moderate)
pm10
119 (Very Unhealthy)
158 (Very bad Hazardous)
127 (Very Unhealthy)
206 (Very bad Hazardous)
200 (Very bad Hazardous)
254 (Very bad Hazardous)
268 (Very bad Hazardous)
240 (Very bad Hazardous)
61 (Unhealthy for Sensitive Groups)
56 (Unhealthy for Sensitive Groups)
97 (Unhealthy)
174 (Very bad Hazardous)
251 (Very bad Hazardous)
356 (Very bad Hazardous)
264 (Very bad Hazardous)
368 (Very bad Hazardous)
- (Good)
- (Good)
51 (Unhealthy for Sensitive Groups)
59 (Unhealthy for Sensitive Groups)
no2
13 (Good)
16 (Good)
27 (Good)
49 (Moderate)
49 (Moderate)
51 (Moderate)
65 (Moderate)
48 (Moderate)
13 (Good)
13 (Good)
12 (Good)
28 (Good)
18 (Good)
42 (Moderate)
43 (Moderate)
76 (Moderate)
42 (Moderate)
50 (Moderate)
28 (Good)
16 (Good)
co
899 (Good)
1 (Good)
1 (Good)
1 (Good)
1 (Good)
1 (Good)
1 (Good)
2 (Good)
851 (Good)
816 (Good)
758 (Good)
958 (Good)
832 (Good)
840 (Good)
1 (Good)
1 (Good)
1 (Good)
1 (Good)
1 (Good)
1 (Good)
o3
82 (Moderate)
76 (Moderate)
74 (Moderate)
75 (Moderate)
46 (Good)
48 (Good)
48 (Good)
64 (Good)
34 (Good)
30 (Good)
41 (Good)
70 (Moderate)
96 (Moderate)
79 (Moderate)
49 (Good)
33 (Good)
73 (Moderate)
76 (Moderate)
71 (Moderate)
47 (Good)
so2
12 (Good)
24 (Good)
29 (Good)
30 (Good)
21 (Good)
21 (Good)
33 (Good)
26 (Good)
6.9 (Good)
9.7 (Good)
18 (Good)
35 (Good)
22 (Good)
51 (Moderate)
7.1 (Good)
16 (Good)
19 (Good)
11 (Good)
11 (Good)
5.2 (Good)
data source »
Yamunapuram, Bulandshahr - UPPCB
Montag, 31. Oktober 2022, 01:00
PM2,5 160 (Sehr schlecht Gefährlich)
Feinstaub (PM2,5)
PM10 302 (Sehr schlecht Gefährlich)
Feinstaub (PM10) Schwebestaub
NO2 18 (gut)
Stickstoffdioxid (NO2)
O3 1.7 (gut)
Ozon (O3)
Yamunapuram, Bulandshahr - UPPCB
index
2022-10-31
pm25
160
pm10
302
no2
18
o3
1.7
Yamunapuram, Bulandshahr - UPPCB
2018-08 2020-05

index
2020-05
2020-04
2020-03
2020-02
2020-01
2019-12
2019-11
2019-10
2019-09
2019-08
2019-07
2019-06
2019-05
2019-04
2019-02
2018-12
2018-11
2018-10
2018-09
2018-08
pm25
43
61
61
120
145
177
116
101
27
29
39
56
57
82
193
266
227
140
44
25
pm10
119
158
127
206
200
254
268
240
61
56
97
174
251
356
264
368
-
-
51
59
no2
13
16
27
49
49
51
65
48
13
13
12
28
18
42
43
76
42
50
28
16
so2
12
24
29
30
21
21
33
26
6.9
9.7
18
35
22
51
7.1
16
19
11
11
5.2
co
899
1
1
1
1
1
1
2
851
816
758
958
832
840
1
1
1
1
1
1
o3
82
76
74
75
46
48
48
64
34
30
41
70
96
79
49
33
73
76
71
47
* Pollution data source:
https://openaq.org
(caaqm)
The data is licensed under CC-By 4.0
PM2,5 160 (Sehr schlecht Gefährlich)
PM10 302 (Sehr schlecht Gefährlich)
NO2 18 (gut)
O3 2 (gut)
Daten zur Luftverschmutzung der letzten Tage in Bulandshahr district
| index | 2022-10-31 |
|---|---|
| pm25 | 160 Very bad Hazardous |
| pm10 | 302 Very bad Hazardous |
| no2 | 18 Good |
| o3 | 2 Good |

| index | 2020-05 | 2020-04 | 2020-03 | 2020-02 | 2020-01 | 2019-12 | 2019-11 | 2019-10 | 2019-09 | 2019-08 | 2019-07 | 2019-06 | 2019-05 | 2019-04 | 2019-02 | 2018-12 | 2018-11 | 2018-10 | 2018-09 | 2018-08 |
|---|---|---|---|---|---|---|---|---|---|---|---|---|---|---|---|---|---|---|---|---|
| pm25 | 43 (Unhealthy for Sensitive Groups) | 61 (Unhealthy) | 61 (Unhealthy) | 120 (Very bad Hazardous) | 145 (Very bad Hazardous) | 177 (Very bad Hazardous) | 116 (Very bad Hazardous) | 101 (Very Unhealthy) | 27 (Moderate) | 29 (Moderate) | 39 (Unhealthy for Sensitive Groups) | 56 (Unhealthy) | 57 (Unhealthy) | 82 (Very Unhealthy) | 193 (Very bad Hazardous) | 266 (Very bad Hazardous) | 227 (Very bad Hazardous) | 140 (Very bad Hazardous) | 44 (Unhealthy for Sensitive Groups) | 25 (Moderate) |
| pm10 | 119 (Very Unhealthy) | 158 (Very bad Hazardous) | 127 (Very Unhealthy) | 206 (Very bad Hazardous) | 200 (Very bad Hazardous) | 254 (Very bad Hazardous) | 268 (Very bad Hazardous) | 240 (Very bad Hazardous) | 61 (Unhealthy for Sensitive Groups) | 56 (Unhealthy for Sensitive Groups) | 97 (Unhealthy) | 174 (Very bad Hazardous) | 251 (Very bad Hazardous) | 356 (Very bad Hazardous) | 264 (Very bad Hazardous) | 368 (Very bad Hazardous) | - (Good) | - (Good) | 51 (Unhealthy for Sensitive Groups) | 59 (Unhealthy for Sensitive Groups) |
| no2 | 13 (Good) | 16 (Good) | 27 (Good) | 49 (Moderate) | 49 (Moderate) | 51 (Moderate) | 65 (Moderate) | 48 (Moderate) | 13 (Good) | 13 (Good) | 12 (Good) | 28 (Good) | 18 (Good) | 42 (Moderate) | 43 (Moderate) | 76 (Moderate) | 42 (Moderate) | 50 (Moderate) | 28 (Good) | 16 (Good) |
| co | 899 (Good) | 1 (Good) | 1 (Good) | 1 (Good) | 1 (Good) | 1 (Good) | 1 (Good) | 2 (Good) | 851 (Good) | 816 (Good) | 758 (Good) | 958 (Good) | 832 (Good) | 840 (Good) | 1 (Good) | 1 (Good) | 1 (Good) | 1 (Good) | 1 (Good) | 1 (Good) |
| o3 | 82 (Moderate) | 76 (Moderate) | 74 (Moderate) | 75 (Moderate) | 46 (Good) | 48 (Good) | 48 (Good) | 64 (Good) | 34 (Good) | 30 (Good) | 41 (Good) | 70 (Moderate) | 96 (Moderate) | 79 (Moderate) | 49 (Good) | 33 (Good) | 73 (Moderate) | 76 (Moderate) | 71 (Moderate) | 47 (Good) |
| so2 | 12 (Good) | 24 (Good) | 29 (Good) | 30 (Good) | 21 (Good) | 21 (Good) | 33 (Good) | 26 (Good) | 6.9 (Good) | 9.7 (Good) | 18 (Good) | 35 (Good) | 22 (Good) | 51 (Moderate) | 7.1 (Good) | 16 (Good) | 19 (Good) | 11 (Good) | 11 (Good) | 5.2 (Good) |
PM2,5 160 (Sehr schlecht Gefährlich)
Feinstaub (PM2,5)PM10 302 (Sehr schlecht Gefährlich)
Feinstaub (PM10) SchwebestaubNO2 18 (gut)
Stickstoffdioxid (NO2)O3 1.7 (gut)
Ozon (O3)Yamunapuram, Bulandshahr - UPPCB
| index | 2022-10-31 |
|---|---|
| pm25 | 160 |
| pm10 | 302 |
| no2 | 18 |
| o3 | 1.7 |
Yamunapuram, Bulandshahr - UPPCB

| index | 2020-05 | 2020-04 | 2020-03 | 2020-02 | 2020-01 | 2019-12 | 2019-11 | 2019-10 | 2019-09 | 2019-08 | 2019-07 | 2019-06 | 2019-05 | 2019-04 | 2019-02 | 2018-12 | 2018-11 | 2018-10 | 2018-09 | 2018-08 |
|---|---|---|---|---|---|---|---|---|---|---|---|---|---|---|---|---|---|---|---|---|
| pm25 | 43 | 61 | 61 | 120 | 145 | 177 | 116 | 101 | 27 | 29 | 39 | 56 | 57 | 82 | 193 | 266 | 227 | 140 | 44 | 25 |
| pm10 | 119 | 158 | 127 | 206 | 200 | 254 | 268 | 240 | 61 | 56 | 97 | 174 | 251 | 356 | 264 | 368 | - | - | 51 | 59 |
| no2 | 13 | 16 | 27 | 49 | 49 | 51 | 65 | 48 | 13 | 13 | 12 | 28 | 18 | 42 | 43 | 76 | 42 | 50 | 28 | 16 |
| so2 | 12 | 24 | 29 | 30 | 21 | 21 | 33 | 26 | 6.9 | 9.7 | 18 | 35 | 22 | 51 | 7.1 | 16 | 19 | 11 | 11 | 5.2 |
| co | 899 | 1 | 1 | 1 | 1 | 1 | 1 | 2 | 851 | 816 | 758 | 958 | 832 | 840 | 1 | 1 | 1 | 1 | 1 | 1 |
| o3 | 82 | 76 | 74 | 75 | 46 | 48 | 48 | 64 | 34 | 30 | 41 | 70 | 96 | 79 | 49 | 33 | 73 | 76 | 71 | 47 |