Luftverschmutzung in Ballabgarh: Echtzeit-Luft-Qualitätsindex und Smog-Alarm.
Für die Ballabgarh. Heute ist Donnerstag, 4. Juni 2026. Für Ballabgarh wurden folgende Luftverschmutzungswerte gemessen:- Feinstaub (PM10) Schwebestaub - 300 (Sehr schlecht Gefährlich)
- Schwefeldioxid (SO2) - 4 (gut)
- Feinstaub (PM2,5) - 123 (Sehr schlecht Gefährlich)
- Kohlenmonoxid (CO) - 3830 (Moderate)
- Stickstoffdioxid (NO2) - 5 (gut)
- Ozon (O3) - 6 (gut)

Wie ist die Luftqualität Ballabgarh heute? Ist die Luft in Ballabgarh? verschmutzt. Gibt es Smog?
Wie hoch ist der PM10-Stand heute in Ballabgarh? (Feinstaub (PM10) Schwebestaub)
Der aktuelle Feinstaubgehalt PM10 in Ballabgarh is:
300 (Sehr schlecht Gefährlich)
Die höchsten PM10-Werte treten in der Regel im Monat auf: 368 (April 2019).
Der niedrigste Wert der Feinstaub-PM10-Belastung in Ballabgarh ist in der Regel in: September (66).
Wie hoch ist die SO2-Belastung? (Schwefeldioxid (SO2))
4 (gut)
Wie hoch ist der aktuelle PM2,5-Wert in Ballabgarh? (Feinstaub (PM2,5))
Die heutige PM2.5-Stufe ist:
123 (Sehr schlecht Gefährlich)
Zum Vergleich: Der höchste PM2,5-Wert in Ballabgarh in den letzten 7 Tagen war: 126 (Montag, 31. Oktober 2022) und der niedrigste: 126 (Montag, 31. Oktober 2022).
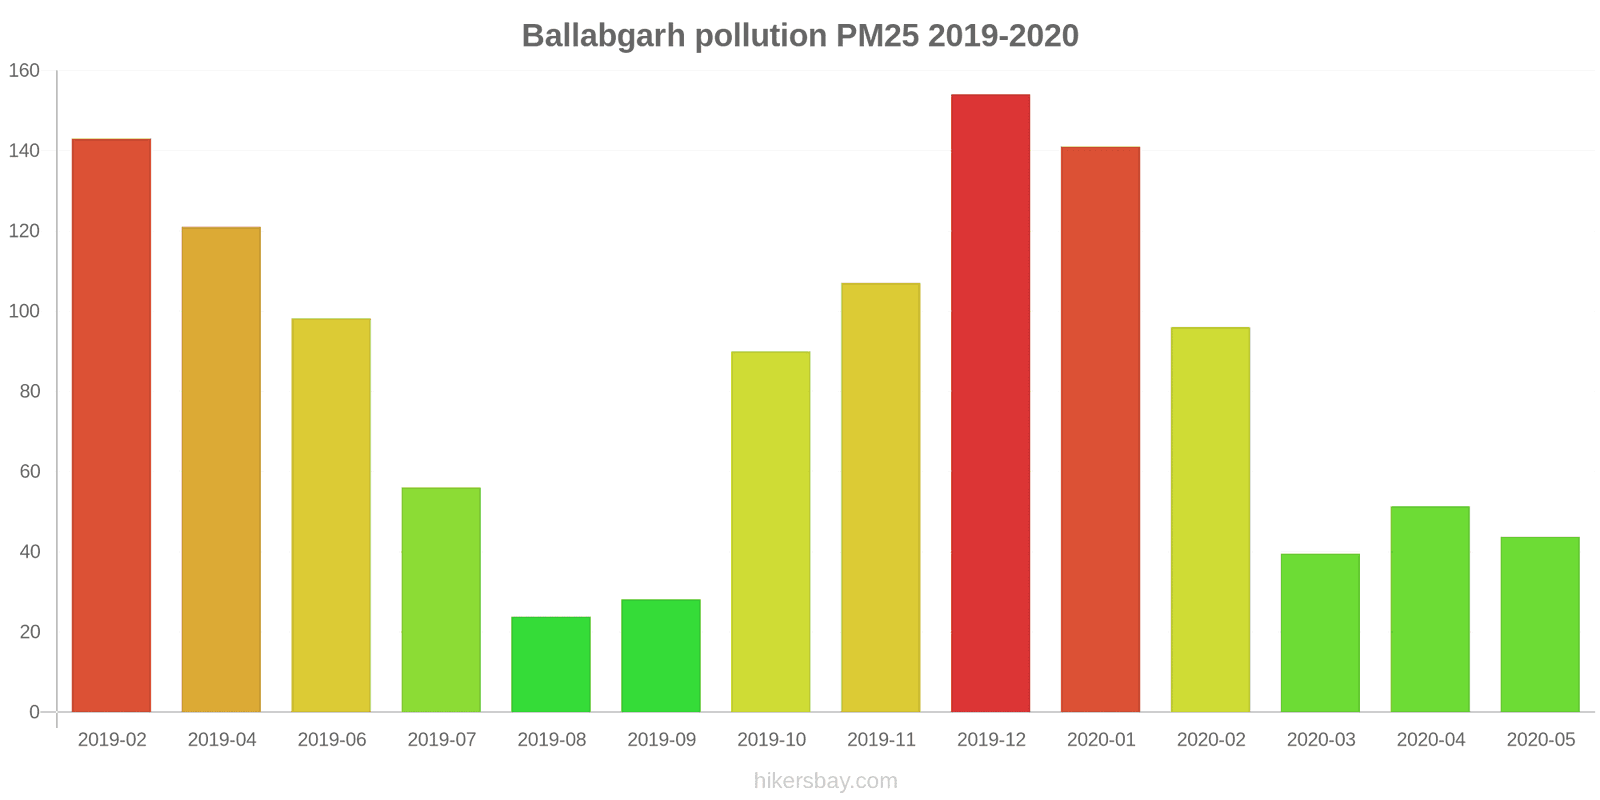
Die höchsten PM2,5-Werte wurden gemessen: 154 (Dezember 2019).
Die niedrigste Feinstaubbelastung PM2,5 tritt im Monat auf: August (24).
Wie hoch ist der CO-Gehalt? (Kohlenmonoxid (CO))
3830 (Moderate)
Wie hoch ist das NO2-Niveau? (Stickstoffdioxid (NO2))
5 (gut)
Wie ist das O3-Niveau heute in Ballabgarh? (Ozon (O3))
6 (gut)
Aktuelle Daten Montag, 31. Oktober 2022, 01:45
PM10 300 (Sehr schlecht Gefährlich)
SO2 4 (gut)
PM2,5 123 (Sehr schlecht Gefährlich)
CO 3830 (Moderate)
NO2 5 (gut)
O3 6 (gut)
Daten zur Luftverschmutzung der letzten Tage in Ballabgarh
index
2022-10-31
pm10
271
Very bad Hazardous
so2
4
Good
pm25
126
Very bad Hazardous
co
3525
Moderate
no2
5
Good
o3
3
Good
data source »
Luftverschmutzung in Ballabgarh von Februar 2019 bis Mai 2020
index
2020-05
2020-04
2020-03
2020-02
2020-01
2019-12
2019-11
2019-10
2019-09
2019-08
2019-07
2019-06
2019-04
2019-02
pm25
44 (Unhealthy for Sensitive Groups)
51 (Unhealthy for Sensitive Groups)
40 (Unhealthy for Sensitive Groups)
96 (Very Unhealthy)
141 (Very bad Hazardous)
154 (Very bad Hazardous)
107 (Very Unhealthy)
90 (Very Unhealthy)
28 (Moderate)
24 (Moderate)
56 (Unhealthy)
98 (Very Unhealthy)
121 (Very bad Hazardous)
143 (Very bad Hazardous)
pm10
90 (Unhealthy)
68 (Unhealthy for Sensitive Groups)
98 (Unhealthy)
247 (Very bad Hazardous)
257 (Very bad Hazardous)
326 (Very bad Hazardous)
265 (Very bad Hazardous)
212 (Very bad Hazardous)
66 (Unhealthy for Sensitive Groups)
72 (Unhealthy for Sensitive Groups)
181 (Very bad Hazardous)
263 (Very bad Hazardous)
368 (Very bad Hazardous)
217 (Very bad Hazardous)
no2
5.5 (Good)
18 (Good)
22 (Good)
10 (Good)
53 (Moderate)
71 (Moderate)
40 (Moderate)
46 (Moderate)
29 (Good)
15 (Good)
18 (Good)
24 (Good)
52 (Moderate)
49 (Moderate)
so2
8 (Good)
6.2 (Good)
6.8 (Good)
9.4 (Good)
7.1 (Good)
6.7 (Good)
18 (Good)
8.7 (Good)
2.6 (Good)
2 (Good)
2.5 (Good)
9.8 (Good)
9.8 (Good)
11 (Good)
co
1 (Good)
1 (Good)
912 (Good)
1 (Good)
1 (Good)
1 (Good)
1 (Good)
1 (Good)
1 (Good)
1 (Good)
1 (Good)
976 (Good)
1 (Good)
4 (Good)
o3
8.8 (Good)
14 (Good)
9 (Good)
6 (Good)
5.3 (Good)
8.7 (Good)
12 (Good)
19 (Good)
39 (Good)
40 (Good)
56 (Good)
24 (Good)
14 (Good)
9.8 (Good)
data source »
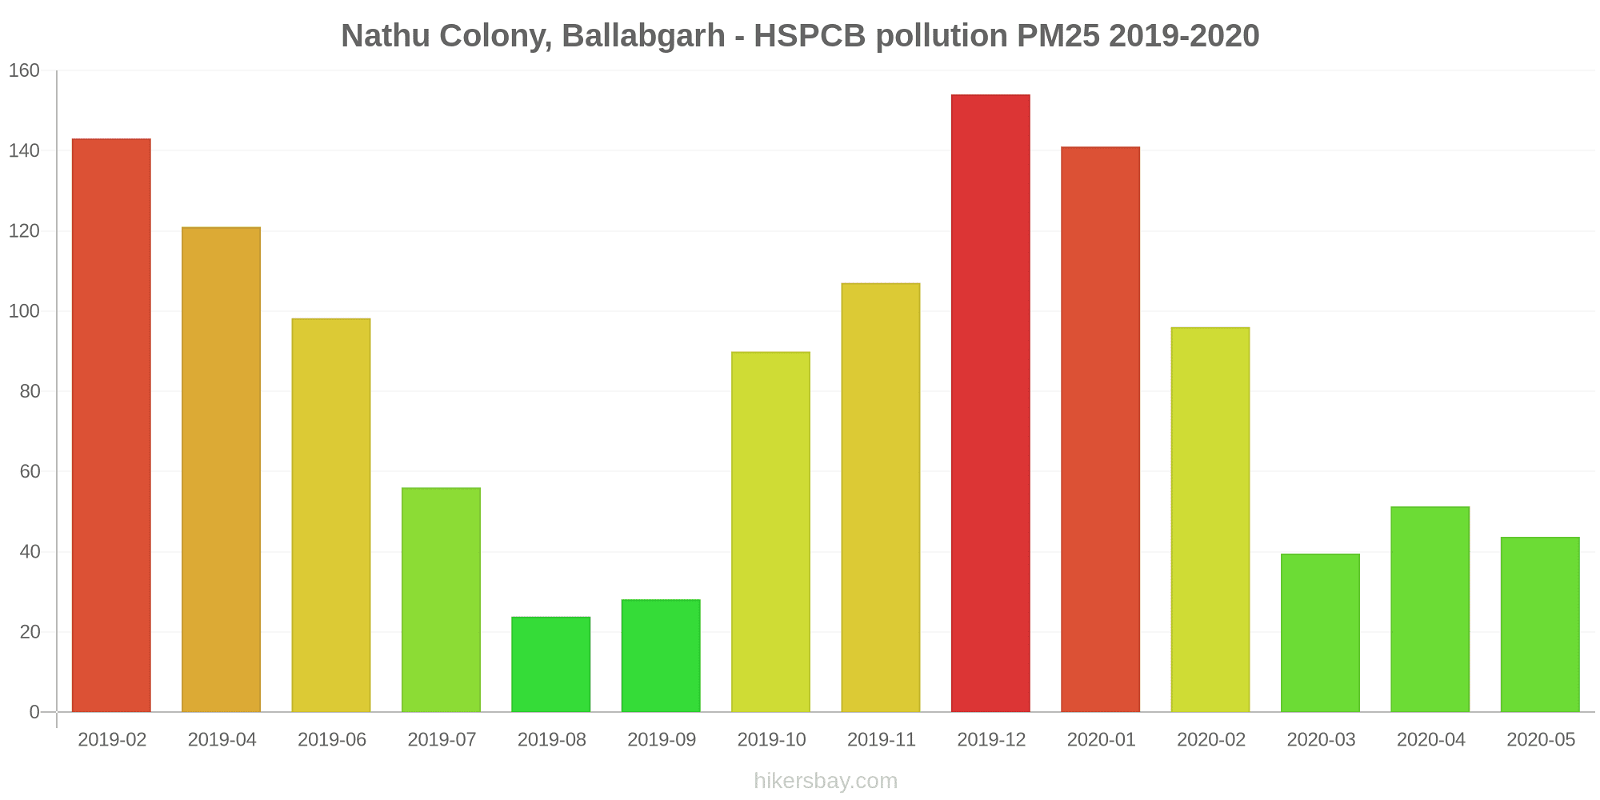
Nathu Colony, Ballabgarh - HSPCB
Montag, 31. Oktober 2022, 01:45
PM10 300 (Sehr schlecht Gefährlich)
Feinstaub (PM10) Schwebestaub
SO2 3.7 (gut)
Schwefeldioxid (SO2)
PM2,5 123 (Sehr schlecht Gefährlich)
Feinstaub (PM2,5)
CO 3830 (Moderate)
Kohlenmonoxid (CO)
NO2 4.8 (gut)
Stickstoffdioxid (NO2)
O3 5.6 (gut)
Ozon (O3)
Nathu Colony, Ballabgarh - HSPCB
index
2022-10-31
pm10
271
so2
3.7
pm25
126
co
3525
no2
4.8
o3
3.2
Nathu Colony, Ballabgarh - HSPCB
2019-02 2020-05
index
2020-05
2020-04
2020-03
2020-02
2020-01
2019-12
2019-11
2019-10
2019-09
2019-08
2019-07
2019-06
2019-04
2019-02
pm25
44
51
40
96
141
154
107
90
28
24
56
98
121
143
pm10
90
68
98
247
257
326
265
212
66
72
181
263
368
217
no2
5.5
18
22
10
53
71
40
46
29
15
18
24
52
49
so2
8
6.2
6.8
9.4
7.1
6.7
18
8.7
2.6
2
2.5
9.8
9.8
11
co
1
1
912
1
1
1
1
1
1
1
1
976
1
4
o3
8.8
14
9
6
5.3
8.7
12
19
39
40
56
24
14
9.8
* Pollution data source:
https://openaq.org
(caaqm)
The data is licensed under CC-By 4.0
PM10 300 (Sehr schlecht Gefährlich)
SO2 4 (gut)
PM2,5 123 (Sehr schlecht Gefährlich)
CO 3830 (Moderate)
NO2 5 (gut)
O3 6 (gut)
Daten zur Luftverschmutzung der letzten Tage in Ballabgarh
| index | 2022-10-31 |
|---|---|
| pm10 | 271 Very bad Hazardous |
| so2 | 4 Good |
| pm25 | 126 Very bad Hazardous |
| co | 3525 Moderate |
| no2 | 5 Good |
| o3 | 3 Good |

| index | 2020-05 | 2020-04 | 2020-03 | 2020-02 | 2020-01 | 2019-12 | 2019-11 | 2019-10 | 2019-09 | 2019-08 | 2019-07 | 2019-06 | 2019-04 | 2019-02 |
|---|---|---|---|---|---|---|---|---|---|---|---|---|---|---|
| pm25 | 44 (Unhealthy for Sensitive Groups) | 51 (Unhealthy for Sensitive Groups) | 40 (Unhealthy for Sensitive Groups) | 96 (Very Unhealthy) | 141 (Very bad Hazardous) | 154 (Very bad Hazardous) | 107 (Very Unhealthy) | 90 (Very Unhealthy) | 28 (Moderate) | 24 (Moderate) | 56 (Unhealthy) | 98 (Very Unhealthy) | 121 (Very bad Hazardous) | 143 (Very bad Hazardous) |
| pm10 | 90 (Unhealthy) | 68 (Unhealthy for Sensitive Groups) | 98 (Unhealthy) | 247 (Very bad Hazardous) | 257 (Very bad Hazardous) | 326 (Very bad Hazardous) | 265 (Very bad Hazardous) | 212 (Very bad Hazardous) | 66 (Unhealthy for Sensitive Groups) | 72 (Unhealthy for Sensitive Groups) | 181 (Very bad Hazardous) | 263 (Very bad Hazardous) | 368 (Very bad Hazardous) | 217 (Very bad Hazardous) |
| no2 | 5.5 (Good) | 18 (Good) | 22 (Good) | 10 (Good) | 53 (Moderate) | 71 (Moderate) | 40 (Moderate) | 46 (Moderate) | 29 (Good) | 15 (Good) | 18 (Good) | 24 (Good) | 52 (Moderate) | 49 (Moderate) |
| so2 | 8 (Good) | 6.2 (Good) | 6.8 (Good) | 9.4 (Good) | 7.1 (Good) | 6.7 (Good) | 18 (Good) | 8.7 (Good) | 2.6 (Good) | 2 (Good) | 2.5 (Good) | 9.8 (Good) | 9.8 (Good) | 11 (Good) |
| co | 1 (Good) | 1 (Good) | 912 (Good) | 1 (Good) | 1 (Good) | 1 (Good) | 1 (Good) | 1 (Good) | 1 (Good) | 1 (Good) | 1 (Good) | 976 (Good) | 1 (Good) | 4 (Good) |
| o3 | 8.8 (Good) | 14 (Good) | 9 (Good) | 6 (Good) | 5.3 (Good) | 8.7 (Good) | 12 (Good) | 19 (Good) | 39 (Good) | 40 (Good) | 56 (Good) | 24 (Good) | 14 (Good) | 9.8 (Good) |
PM10 300 (Sehr schlecht Gefährlich)
Feinstaub (PM10) SchwebestaubSO2 3.7 (gut)
Schwefeldioxid (SO2)PM2,5 123 (Sehr schlecht Gefährlich)
Feinstaub (PM2,5)CO 3830 (Moderate)
Kohlenmonoxid (CO)NO2 4.8 (gut)
Stickstoffdioxid (NO2)O3 5.6 (gut)
Ozon (O3)Nathu Colony, Ballabgarh - HSPCB
| index | 2022-10-31 |
|---|---|
| pm10 | 271 |
| so2 | 3.7 |
| pm25 | 126 |
| co | 3525 |
| no2 | 4.8 |
| o3 | 3.2 |
Nathu Colony, Ballabgarh - HSPCB

| index | 2020-05 | 2020-04 | 2020-03 | 2020-02 | 2020-01 | 2019-12 | 2019-11 | 2019-10 | 2019-09 | 2019-08 | 2019-07 | 2019-06 | 2019-04 | 2019-02 |
|---|---|---|---|---|---|---|---|---|---|---|---|---|---|---|
| pm25 | 44 | 51 | 40 | 96 | 141 | 154 | 107 | 90 | 28 | 24 | 56 | 98 | 121 | 143 |
| pm10 | 90 | 68 | 98 | 247 | 257 | 326 | 265 | 212 | 66 | 72 | 181 | 263 | 368 | 217 |
| no2 | 5.5 | 18 | 22 | 10 | 53 | 71 | 40 | 46 | 29 | 15 | 18 | 24 | 52 | 49 |
| so2 | 8 | 6.2 | 6.8 | 9.4 | 7.1 | 6.7 | 18 | 8.7 | 2.6 | 2 | 2.5 | 9.8 | 9.8 | 11 |
| co | 1 | 1 | 912 | 1 | 1 | 1 | 1 | 1 | 1 | 1 | 1 | 976 | 1 | 4 |
| o3 | 8.8 | 14 | 9 | 6 | 5.3 | 8.7 | 12 | 19 | 39 | 40 | 56 | 24 | 14 | 9.8 |