Luftverschmutzung in Kurla West: Echtzeit-Luft-Qualitätsindex und Smog-Alarm.
Für die Kurla West. Heute ist Samstag, 13. Juni 2026. Für Kurla West wurden folgende Luftverschmutzungswerte gemessen:- Feinstaub (PM2,5) - 72 (ungesund)
- Feinstaub (PM10) Schwebestaub - 67 (Ungesund für sensible Gruppen)
- Stickstoffdioxid (NO2) - 38 (gut)
- Schwefeldioxid (SO2) - 13 (gut)
- Kohlenmonoxid (CO) - 640 (gut)
- Ozon (O3) - 37 (gut)

Wie ist die Luftqualität Kurla West heute? Ist die Luft in Kurla West? verschmutzt. Gibt es Smog?
Wie hoch ist der aktuelle PM2,5-Wert in Kurla West? (Feinstaub (PM2,5))
Die heutige PM2.5-Stufe ist:
72 (ungesund)
Zum Vergleich: Der höchste PM2,5-Wert in Kurla West in den letzten 7 Tagen war: 72 (Montag, 31. Oktober 2022) und der niedrigste: 72 (Montag, 31. Oktober 2022).
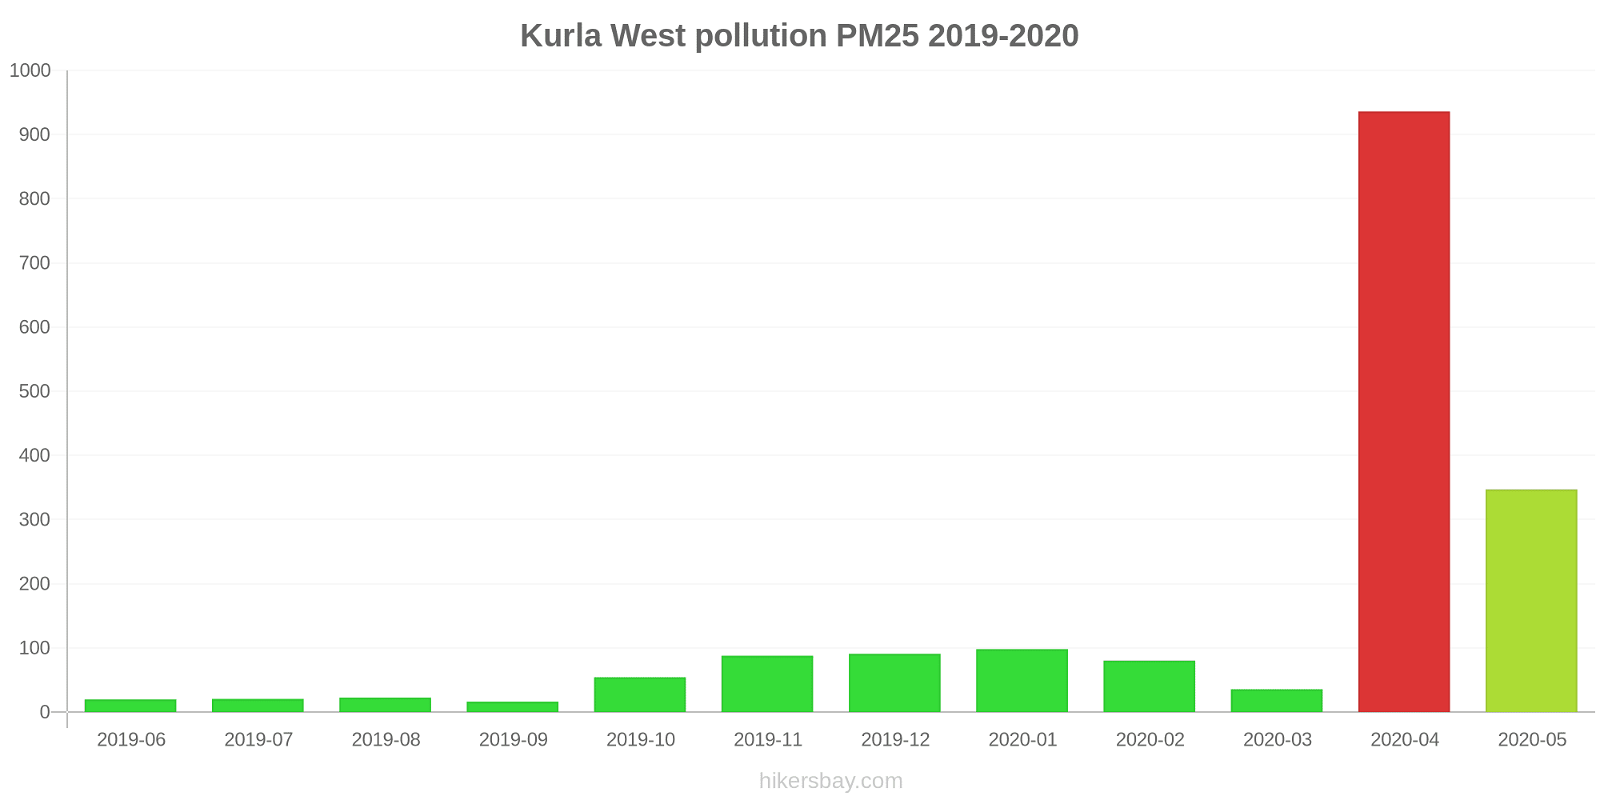
Die höchsten PM2,5-Werte wurden gemessen: 936 (April 2020).
Die niedrigste Feinstaubbelastung PM2,5 tritt im Monat auf: September (16).
Wie hoch ist der PM10-Stand heute in Kurla West? (Feinstaub (PM10) Schwebestaub)
Der aktuelle Feinstaubgehalt PM10 in Kurla West is:
67 (Ungesund für sensible Gruppen)
Die höchsten PM10-Werte treten in der Regel im Monat auf: 227 (Mai 2020).
Der niedrigste Wert der Feinstaub-PM10-Belastung in Kurla West ist in der Regel in: September (57).
Wie hoch ist das NO2-Niveau? (Stickstoffdioxid (NO2))
38 (gut)
Wie hoch ist die SO2-Belastung? (Schwefeldioxid (SO2))
13 (gut)
Wie hoch ist der CO-Gehalt? (Kohlenmonoxid (CO))
640 (gut)
Wie ist das O3-Niveau heute in Kurla West? (Ozon (O3))
37 (gut)
Aktuelle Daten Montag, 31. Oktober 2022, 02:00
PM2,5 72 (ungesund)
PM10 67 (Ungesund für sensible Gruppen)
NO2 38 (gut)
SO2 13 (gut)
CO 640 (gut)
O3 37 (gut)
Daten zur Luftverschmutzung der letzten Tage in Kurla West
index
2022-10-31
pm25
72
Unhealthy
pm10
67
Unhealthy for Sensitive Groups
no2
38
Good
so2
13
Good
co
640
Good
o3
37
Good
data source »
Luftverschmutzung in Kurla West von Juni 2019 bis Mai 2020
index
2020-05
2020-04
2020-03
2020-02
2020-01
2019-12
2019-11
2019-10
2019-09
2019-08
2019-07
2019-06
pm25
347 (Very bad Hazardous)
936 (Very bad Hazardous)
36 (Unhealthy for Sensitive Groups)
80 (Very Unhealthy)
98 (Very Unhealthy)
91 (Very Unhealthy)
88 (Very Unhealthy)
54 (Unhealthy for Sensitive Groups)
16 (Moderate)
23 (Moderate)
21 (Moderate)
20 (Moderate)
pm10
227 (Very bad Hazardous)
74 (Unhealthy for Sensitive Groups)
151 (Very bad Hazardous)
212 (Very bad Hazardous)
199 (Very bad Hazardous)
201 (Very bad Hazardous)
196 (Very bad Hazardous)
113 (Very Unhealthy)
57 (Unhealthy for Sensitive Groups)
93 (Unhealthy)
68 (Unhealthy for Sensitive Groups)
97 (Unhealthy)
no2
5.3 (Good)
6.5 (Good)
37 (Good)
72 (Moderate)
65 (Moderate)
67 (Moderate)
70 (Moderate)
40 (Good)
23 (Good)
15 (Good)
10 (Good)
8.9 (Good)
so2
45 (Good)
3 (Good)
65 (Moderate)
21 (Good)
6.2 (Good)
230 (Unhealthy)
98 (Moderate)
13 (Good)
11 (Good)
13 (Good)
16 (Good)
24 (Good)
co
179 (Good)
84 (Good)
382 (Good)
775 (Good)
727 (Good)
726 (Good)
754 (Good)
518 (Good)
349 (Good)
246 (Good)
267 (Good)
304 (Good)
o3
17 (Good)
32 (Good)
40 (Good)
57 (Good)
51 (Good)
47 (Good)
47 (Good)
29 (Good)
16 (Good)
7.9 (Good)
5.6 (Good)
4.7 (Good)
data source »
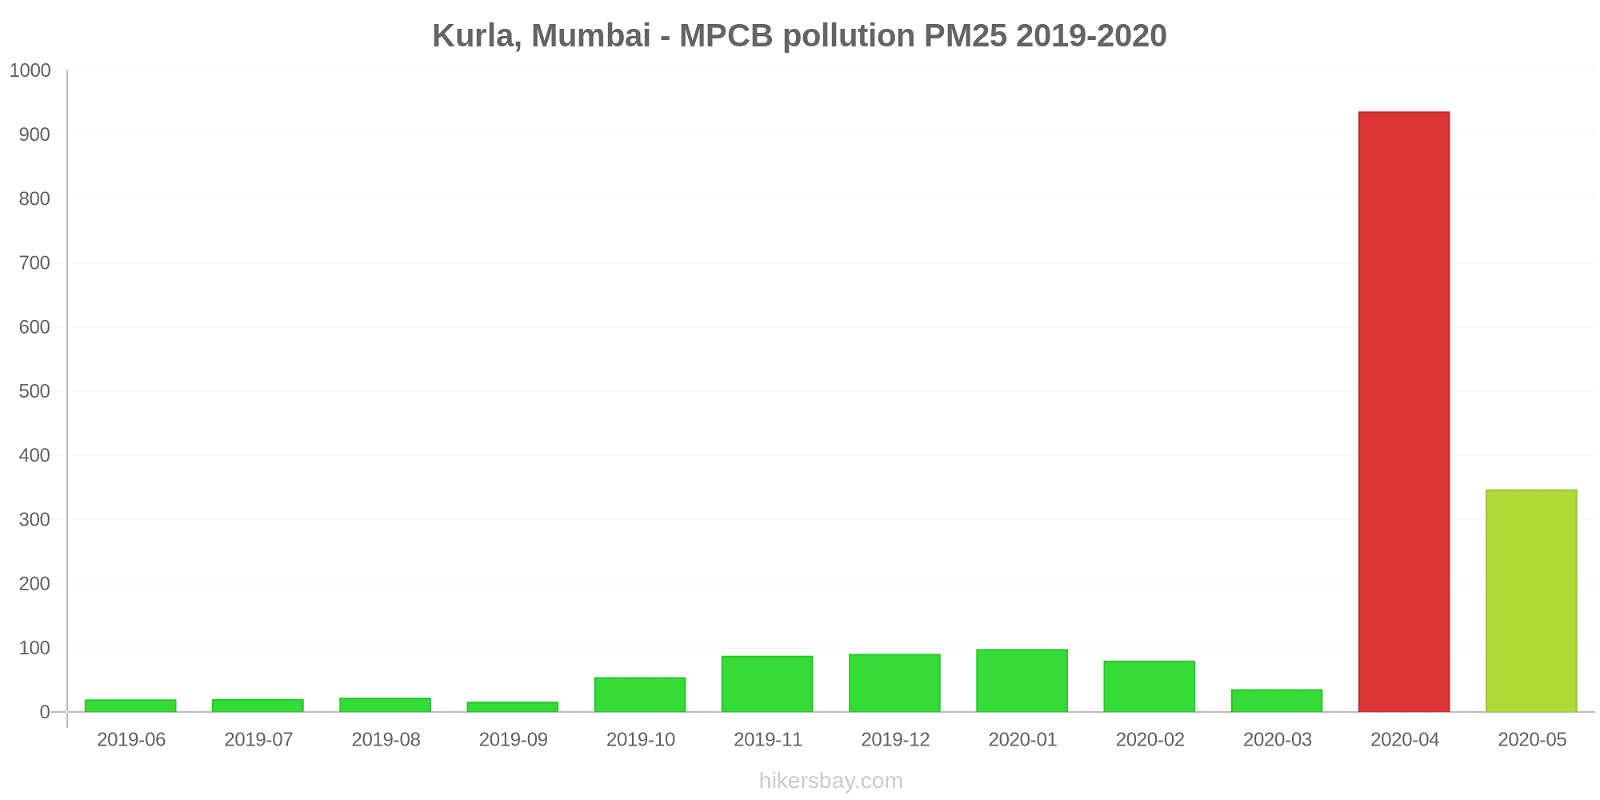
Kurla, Mumbai - MPCB
Montag, 31. Oktober 2022, 02:00
PM2,5 72 (ungesund)
Feinstaub (PM2,5)
PM10 67 (Ungesund für sensible Gruppen)
Feinstaub (PM10) Schwebestaub
NO2 38 (gut)
Stickstoffdioxid (NO2)
SO2 13 (gut)
Schwefeldioxid (SO2)
CO 640 (gut)
Kohlenmonoxid (CO)
O3 37 (gut)
Ozon (O3)
Kurla, Mumbai - MPCB
index
2022-10-31
pm25
72
pm10
67
no2
38
so2
13
co
640
o3
37
Kurla, Mumbai - MPCB
2019-06 2020-05
index
2020-05
2020-04
2020-03
2020-02
2020-01
2019-12
2019-11
2019-10
2019-09
2019-08
2019-07
2019-06
pm25
347
936
36
80
98
91
88
54
16
23
21
20
pm10
227
74
151
212
199
201
196
113
57
93
68
97
no2
5.3
6.5
37
72
65
67
70
40
23
15
10
8.9
so2
45
3
65
21
6.2
230
98
13
11
13
16
24
co
179
84
382
775
727
726
754
518
349
246
267
304
o3
17
32
40
57
51
47
47
29
16
7.9
5.6
4.7
* Pollution data source:
https://openaq.org
(caaqm)
The data is licensed under CC-By 4.0
PM2,5 72 (ungesund)
PM10 67 (Ungesund für sensible Gruppen)
NO2 38 (gut)
SO2 13 (gut)
CO 640 (gut)
O3 37 (gut)
Daten zur Luftverschmutzung der letzten Tage in Kurla West
| index | 2022-10-31 |
|---|---|
| pm25 | 72 Unhealthy |
| pm10 | 67 Unhealthy for Sensitive Groups |
| no2 | 38 Good |
| so2 | 13 Good |
| co | 640 Good |
| o3 | 37 Good |

| index | 2020-05 | 2020-04 | 2020-03 | 2020-02 | 2020-01 | 2019-12 | 2019-11 | 2019-10 | 2019-09 | 2019-08 | 2019-07 | 2019-06 |
|---|---|---|---|---|---|---|---|---|---|---|---|---|
| pm25 | 347 (Very bad Hazardous) | 936 (Very bad Hazardous) | 36 (Unhealthy for Sensitive Groups) | 80 (Very Unhealthy) | 98 (Very Unhealthy) | 91 (Very Unhealthy) | 88 (Very Unhealthy) | 54 (Unhealthy for Sensitive Groups) | 16 (Moderate) | 23 (Moderate) | 21 (Moderate) | 20 (Moderate) |
| pm10 | 227 (Very bad Hazardous) | 74 (Unhealthy for Sensitive Groups) | 151 (Very bad Hazardous) | 212 (Very bad Hazardous) | 199 (Very bad Hazardous) | 201 (Very bad Hazardous) | 196 (Very bad Hazardous) | 113 (Very Unhealthy) | 57 (Unhealthy for Sensitive Groups) | 93 (Unhealthy) | 68 (Unhealthy for Sensitive Groups) | 97 (Unhealthy) |
| no2 | 5.3 (Good) | 6.5 (Good) | 37 (Good) | 72 (Moderate) | 65 (Moderate) | 67 (Moderate) | 70 (Moderate) | 40 (Good) | 23 (Good) | 15 (Good) | 10 (Good) | 8.9 (Good) |
| so2 | 45 (Good) | 3 (Good) | 65 (Moderate) | 21 (Good) | 6.2 (Good) | 230 (Unhealthy) | 98 (Moderate) | 13 (Good) | 11 (Good) | 13 (Good) | 16 (Good) | 24 (Good) |
| co | 179 (Good) | 84 (Good) | 382 (Good) | 775 (Good) | 727 (Good) | 726 (Good) | 754 (Good) | 518 (Good) | 349 (Good) | 246 (Good) | 267 (Good) | 304 (Good) |
| o3 | 17 (Good) | 32 (Good) | 40 (Good) | 57 (Good) | 51 (Good) | 47 (Good) | 47 (Good) | 29 (Good) | 16 (Good) | 7.9 (Good) | 5.6 (Good) | 4.7 (Good) |
PM2,5 72 (ungesund)
Feinstaub (PM2,5)PM10 67 (Ungesund für sensible Gruppen)
Feinstaub (PM10) SchwebestaubNO2 38 (gut)
Stickstoffdioxid (NO2)SO2 13 (gut)
Schwefeldioxid (SO2)CO 640 (gut)
Kohlenmonoxid (CO)O3 37 (gut)
Ozon (O3)Kurla, Mumbai - MPCB
| index | 2022-10-31 |
|---|---|
| pm25 | 72 |
| pm10 | 67 |
| no2 | 38 |
| so2 | 13 |
| co | 640 |
| o3 | 37 |
Kurla, Mumbai - MPCB

| index | 2020-05 | 2020-04 | 2020-03 | 2020-02 | 2020-01 | 2019-12 | 2019-11 | 2019-10 | 2019-09 | 2019-08 | 2019-07 | 2019-06 |
|---|---|---|---|---|---|---|---|---|---|---|---|---|
| pm25 | 347 | 936 | 36 | 80 | 98 | 91 | 88 | 54 | 16 | 23 | 21 | 20 |
| pm10 | 227 | 74 | 151 | 212 | 199 | 201 | 196 | 113 | 57 | 93 | 68 | 97 |
| no2 | 5.3 | 6.5 | 37 | 72 | 65 | 67 | 70 | 40 | 23 | 15 | 10 | 8.9 |
| so2 | 45 | 3 | 65 | 21 | 6.2 | 230 | 98 | 13 | 11 | 13 | 16 | 24 |
| co | 179 | 84 | 382 | 775 | 727 | 726 | 754 | 518 | 349 | 246 | 267 | 304 |
| o3 | 17 | 32 | 40 | 57 | 51 | 47 | 47 | 29 | 16 | 7.9 | 5.6 | 4.7 |