Luftverschmutzung in Rewari: Echtzeit-Luft-Qualitätsindex und Smog-Alarm.
Für die Rewari. Heute ist Donnerstag, 4. Juni 2026. Für Rewari wurden folgende Luftverschmutzungswerte gemessen:- Feinstaub (PM10) Schwebestaub - 259 (Sehr schlecht Gefährlich)
- Schwefeldioxid (SO2) - 5 (gut)
- Feinstaub (PM2,5) - 212 (Sehr schlecht Gefährlich)
- Kohlenmonoxid (CO) - 1010 (gut)
- Stickstoffdioxid (NO2) - 21 (gut)
- Ozon (O3) - 39 (gut)

Wie ist die Luftqualität Rewari heute? Ist die Luft in Rewari? verschmutzt. Gibt es Smog?
Wie hoch ist der PM10-Stand heute in Rewari? (Feinstaub (PM10) Schwebestaub)
Der aktuelle Feinstaubgehalt PM10 in Rewari is:
259 (Sehr schlecht Gefährlich)
Die höchsten PM10-Werte treten in der Regel im Monat auf: 242 (November 2019).
Der niedrigste Wert der Feinstaub-PM10-Belastung in Rewari ist in der Regel in: Mai (40).
Wie hoch ist die SO2-Belastung? (Schwefeldioxid (SO2))
5 (gut)
Wie hoch ist der aktuelle PM2,5-Wert in Rewari? (Feinstaub (PM2,5))
Die heutige PM2.5-Stufe ist:
212 (Sehr schlecht Gefährlich)
Zum Vergleich: Der höchste PM2,5-Wert in Rewari in den letzten 7 Tagen war: 214 (Montag, 31. Oktober 2022) und der niedrigste: 214 (Montag, 31. Oktober 2022).
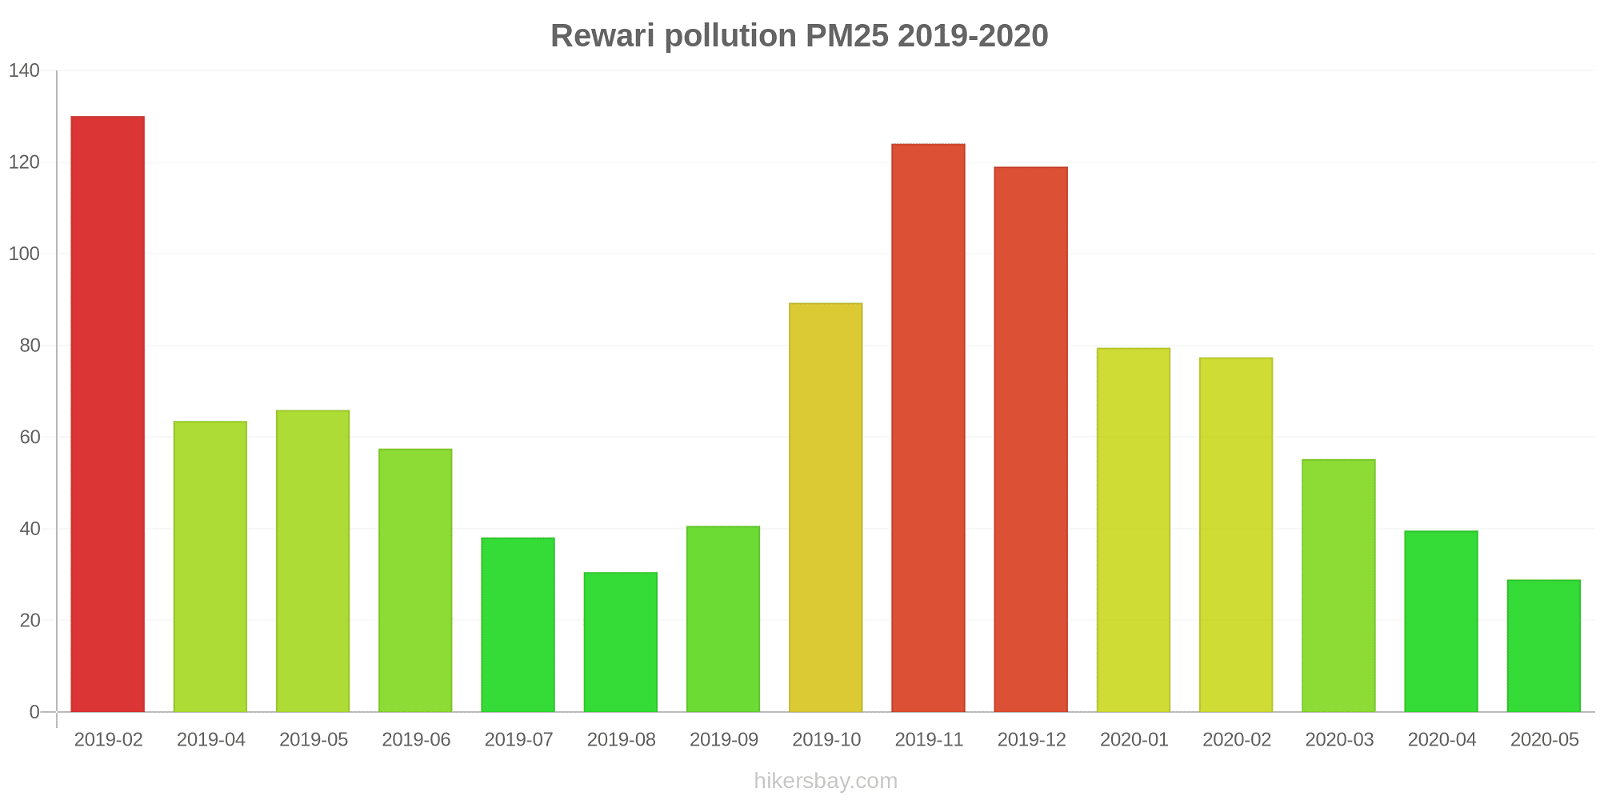
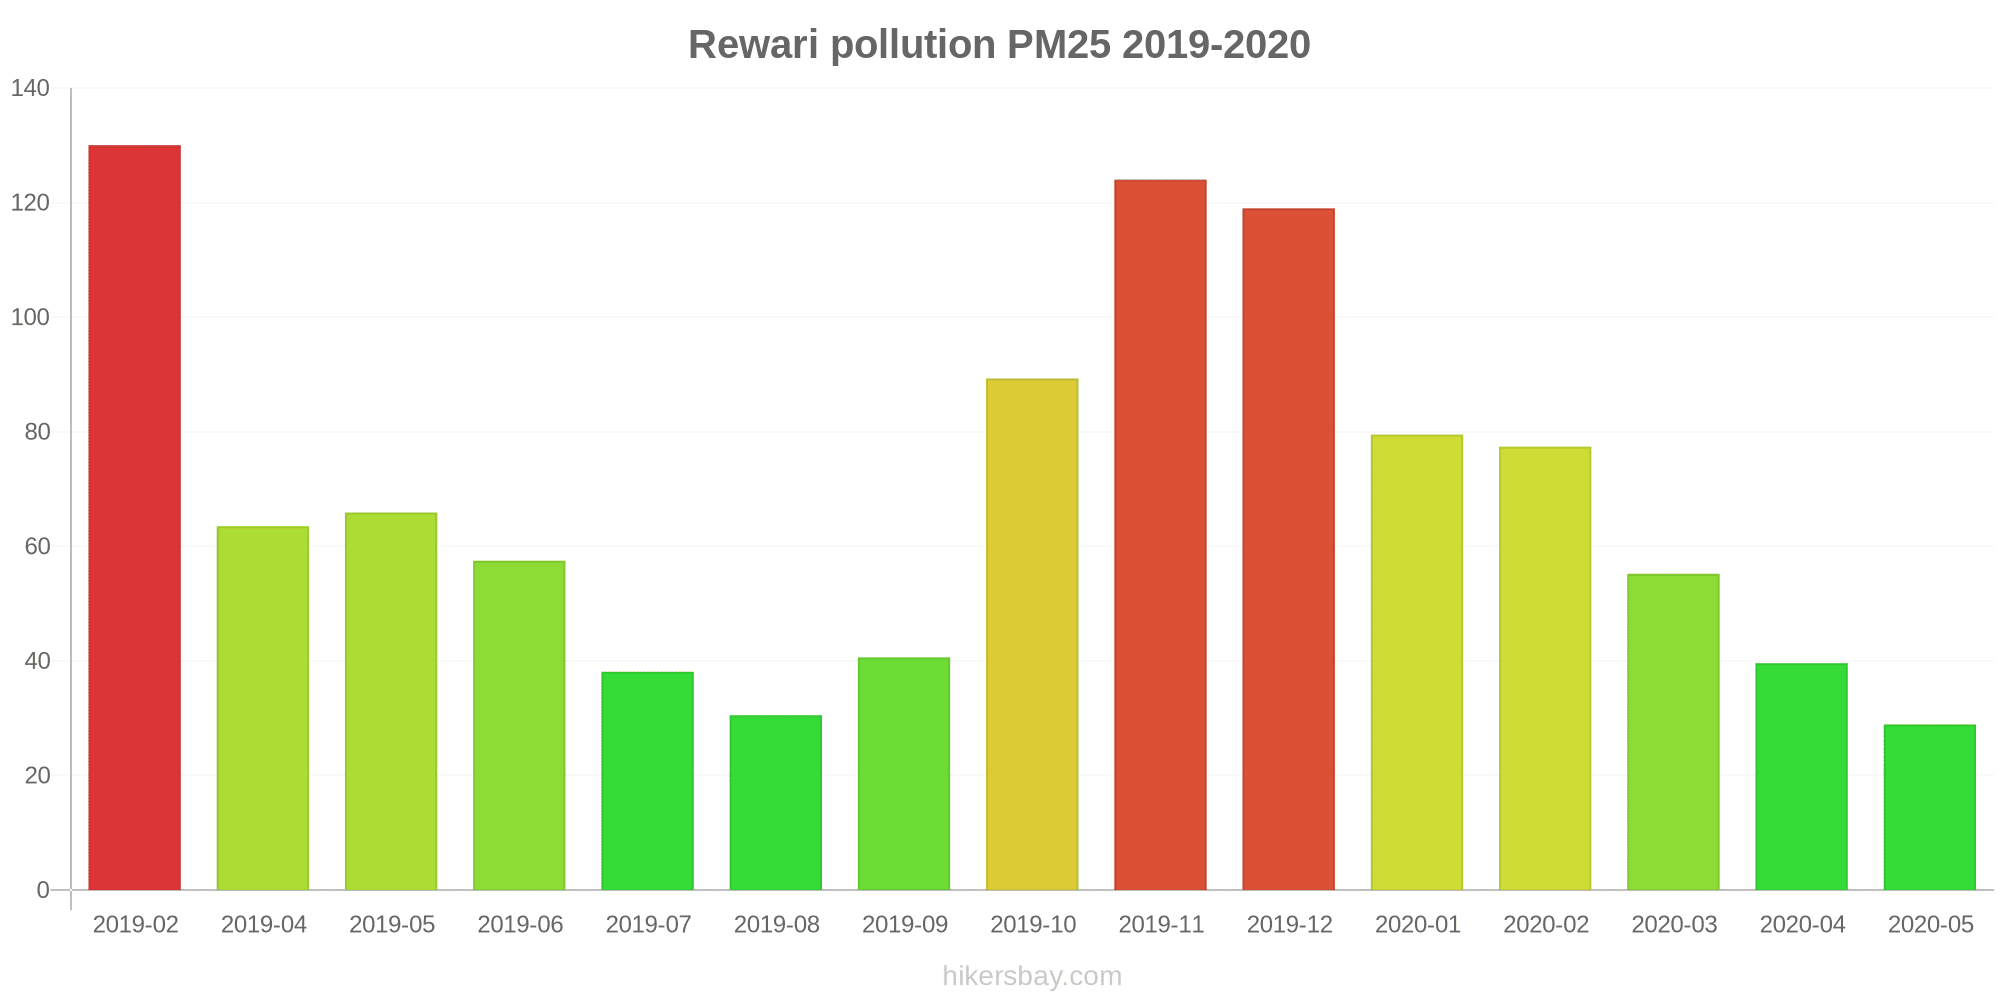
Die höchsten PM2,5-Werte wurden gemessen: 130 (Februar 2019).
Die niedrigste Feinstaubbelastung PM2,5 tritt im Monat auf: Mai (29).
Wie hoch ist der CO-Gehalt? (Kohlenmonoxid (CO))
1010 (gut)
Wie hoch ist das NO2-Niveau? (Stickstoffdioxid (NO2))
21 (gut)
Wie ist das O3-Niveau heute in Rewari? (Ozon (O3))
39 (gut)
Aktuelle Daten Montag, 31. Oktober 2022, 01:45
PM10 259 (Sehr schlecht Gefährlich)
SO2 5 (gut)
PM2,5 212 (Sehr schlecht Gefährlich)
CO 1010 (gut)
NO2 21 (gut)
O3 39 (gut)
Daten zur Luftverschmutzung der letzten Tage in Rewari
index
2022-10-31
pm10
257
Very bad Hazardous
so2
5
Good
pm25
214
Very bad Hazardous
co
910
Good
no2
21
Good
o3
39
Good
data source »
Luftverschmutzung in Rewari von Februar 2019 bis Mai 2020
index
2020-05
2020-04
2020-03
2020-02
2020-01
2019-12
2019-11
2019-10
2019-09
2019-08
2019-07
2019-06
2019-05
2019-04
2019-02
pm25
29 (Moderate)
40 (Unhealthy for Sensitive Groups)
55 (Unhealthy)
77 (Very Unhealthy)
80 (Very Unhealthy)
119 (Very bad Hazardous)
124 (Very bad Hazardous)
89 (Very Unhealthy)
41 (Unhealthy for Sensitive Groups)
31 (Moderate)
38 (Unhealthy for Sensitive Groups)
58 (Unhealthy)
66 (Unhealthy)
64 (Unhealthy)
130 (Very bad Hazardous)
pm10
40 (Moderate)
56 (Unhealthy for Sensitive Groups)
137 (Very Unhealthy)
208 (Very bad Hazardous)
183 (Very bad Hazardous)
207 (Very bad Hazardous)
242 (Very bad Hazardous)
222 (Very bad Hazardous)
92 (Unhealthy)
74 (Unhealthy for Sensitive Groups)
127 (Very Unhealthy)
194 (Very bad Hazardous)
185 (Very bad Hazardous)
205 (Very bad Hazardous)
196 (Very bad Hazardous)
no2
19 (Good)
9.1 (Good)
36 (Good)
56 (Moderate)
54 (Moderate)
57 (Moderate)
75 (Moderate)
45 (Moderate)
19 (Good)
16 (Good)
15 (Good)
24 (Good)
61 (Moderate)
39 (Good)
61 (Moderate)
so2
59 (Moderate)
13 (Good)
22 (Good)
20 (Good)
19 (Good)
14 (Good)
14 (Good)
14 (Good)
6.8 (Good)
3 (Good)
7.8 (Good)
11 (Good)
22 (Good)
15 (Good)
32 (Good)
co
1 (Good)
976 (Good)
1 (Good)
1 (Good)
2 (Good)
1 (Good)
2 (Good)
1 (Good)
2 (Good)
2 (Good)
1 (Good)
1 (Good)
1 (Good)
784 (Good)
2 (Good)
o3
69 (Good)
54 (Good)
35 (Good)
43 (Good)
25 (Good)
29 (Good)
41 (Good)
58 (Good)
56 (Good)
40 (Good)
50 (Good)
45 (Good)
18 (Good)
19 (Good)
25 (Good)
data source »
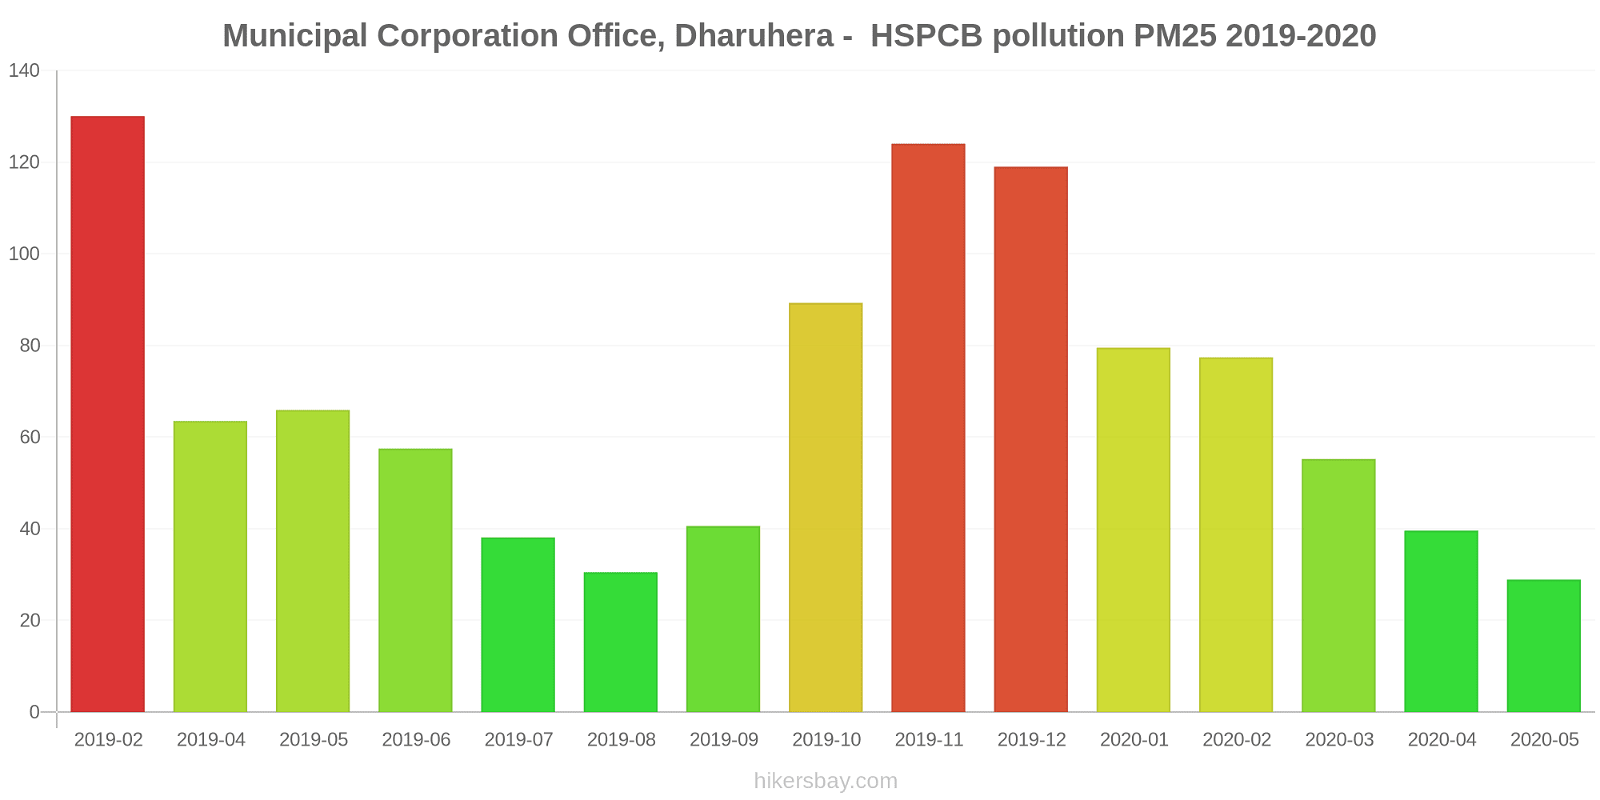
Municipal Corporation Office, Dharuhera - HSPCB
Montag, 31. Oktober 2022, 01:45
PM10 259 (Sehr schlecht Gefährlich)
Feinstaub (PM10) Schwebestaub
SO2 4.8 (gut)
Schwefeldioxid (SO2)
PM2,5 212 (Sehr schlecht Gefährlich)
Feinstaub (PM2,5)
CO 1010 (gut)
Kohlenmonoxid (CO)
NO2 21 (gut)
Stickstoffdioxid (NO2)
O3 39 (gut)
Ozon (O3)
Municipal Corporation Office, Dharuhera - HSPCB
index
2022-10-31
pm10
257
so2
4.6
pm25
214
co
910
no2
21
o3
39
Municipal Corporation Office, Dharuhera - HSPCB
2019-02 2020-05
index
2020-05
2020-04
2020-03
2020-02
2020-01
2019-12
2019-11
2019-10
2019-09
2019-08
2019-07
2019-06
2019-05
2019-04
2019-02
pm25
29
40
55
77
80
119
124
89
41
31
38
58
66
64
130
pm10
40
56
137
208
183
207
242
222
92
74
127
194
185
205
196
no2
19
9.1
36
56
54
57
75
45
19
16
15
24
61
39
61
so2
59
13
22
20
19
14
14
14
6.8
3
7.8
11
22
15
32
co
1
976
1
1
2
1
2
1
2
2
1
1
1
784
2
o3
69
54
35
43
25
29
41
58
56
40
50
45
18
19
25
* Pollution data source:
https://openaq.org
(caaqm)
The data is licensed under CC-By 4.0
PM10 259 (Sehr schlecht Gefährlich)
SO2 5 (gut)
PM2,5 212 (Sehr schlecht Gefährlich)
CO 1010 (gut)
NO2 21 (gut)
O3 39 (gut)
Daten zur Luftverschmutzung der letzten Tage in Rewari
| index | 2022-10-31 |
|---|---|
| pm10 | 257 Very bad Hazardous |
| so2 | 5 Good |
| pm25 | 214 Very bad Hazardous |
| co | 910 Good |
| no2 | 21 Good |
| o3 | 39 Good |
| index | 2020-05 | 2020-04 | 2020-03 | 2020-02 | 2020-01 | 2019-12 | 2019-11 | 2019-10 | 2019-09 | 2019-08 | 2019-07 | 2019-06 | 2019-05 | 2019-04 | 2019-02 |
|---|---|---|---|---|---|---|---|---|---|---|---|---|---|---|---|
| pm25 | 29 (Moderate) | 40 (Unhealthy for Sensitive Groups) | 55 (Unhealthy) | 77 (Very Unhealthy) | 80 (Very Unhealthy) | 119 (Very bad Hazardous) | 124 (Very bad Hazardous) | 89 (Very Unhealthy) | 41 (Unhealthy for Sensitive Groups) | 31 (Moderate) | 38 (Unhealthy for Sensitive Groups) | 58 (Unhealthy) | 66 (Unhealthy) | 64 (Unhealthy) | 130 (Very bad Hazardous) |
| pm10 | 40 (Moderate) | 56 (Unhealthy for Sensitive Groups) | 137 (Very Unhealthy) | 208 (Very bad Hazardous) | 183 (Very bad Hazardous) | 207 (Very bad Hazardous) | 242 (Very bad Hazardous) | 222 (Very bad Hazardous) | 92 (Unhealthy) | 74 (Unhealthy for Sensitive Groups) | 127 (Very Unhealthy) | 194 (Very bad Hazardous) | 185 (Very bad Hazardous) | 205 (Very bad Hazardous) | 196 (Very bad Hazardous) |
| no2 | 19 (Good) | 9.1 (Good) | 36 (Good) | 56 (Moderate) | 54 (Moderate) | 57 (Moderate) | 75 (Moderate) | 45 (Moderate) | 19 (Good) | 16 (Good) | 15 (Good) | 24 (Good) | 61 (Moderate) | 39 (Good) | 61 (Moderate) |
| so2 | 59 (Moderate) | 13 (Good) | 22 (Good) | 20 (Good) | 19 (Good) | 14 (Good) | 14 (Good) | 14 (Good) | 6.8 (Good) | 3 (Good) | 7.8 (Good) | 11 (Good) | 22 (Good) | 15 (Good) | 32 (Good) |
| co | 1 (Good) | 976 (Good) | 1 (Good) | 1 (Good) | 2 (Good) | 1 (Good) | 2 (Good) | 1 (Good) | 2 (Good) | 2 (Good) | 1 (Good) | 1 (Good) | 1 (Good) | 784 (Good) | 2 (Good) |
| o3 | 69 (Good) | 54 (Good) | 35 (Good) | 43 (Good) | 25 (Good) | 29 (Good) | 41 (Good) | 58 (Good) | 56 (Good) | 40 (Good) | 50 (Good) | 45 (Good) | 18 (Good) | 19 (Good) | 25 (Good) |
PM10 259 (Sehr schlecht Gefährlich)
Feinstaub (PM10) SchwebestaubSO2 4.8 (gut)
Schwefeldioxid (SO2)PM2,5 212 (Sehr schlecht Gefährlich)
Feinstaub (PM2,5)CO 1010 (gut)
Kohlenmonoxid (CO)NO2 21 (gut)
Stickstoffdioxid (NO2)O3 39 (gut)
Ozon (O3)Municipal Corporation Office, Dharuhera - HSPCB
| index | 2022-10-31 |
|---|---|
| pm10 | 257 |
| so2 | 4.6 |
| pm25 | 214 |
| co | 910 |
| no2 | 21 |
| o3 | 39 |
Municipal Corporation Office, Dharuhera - HSPCB
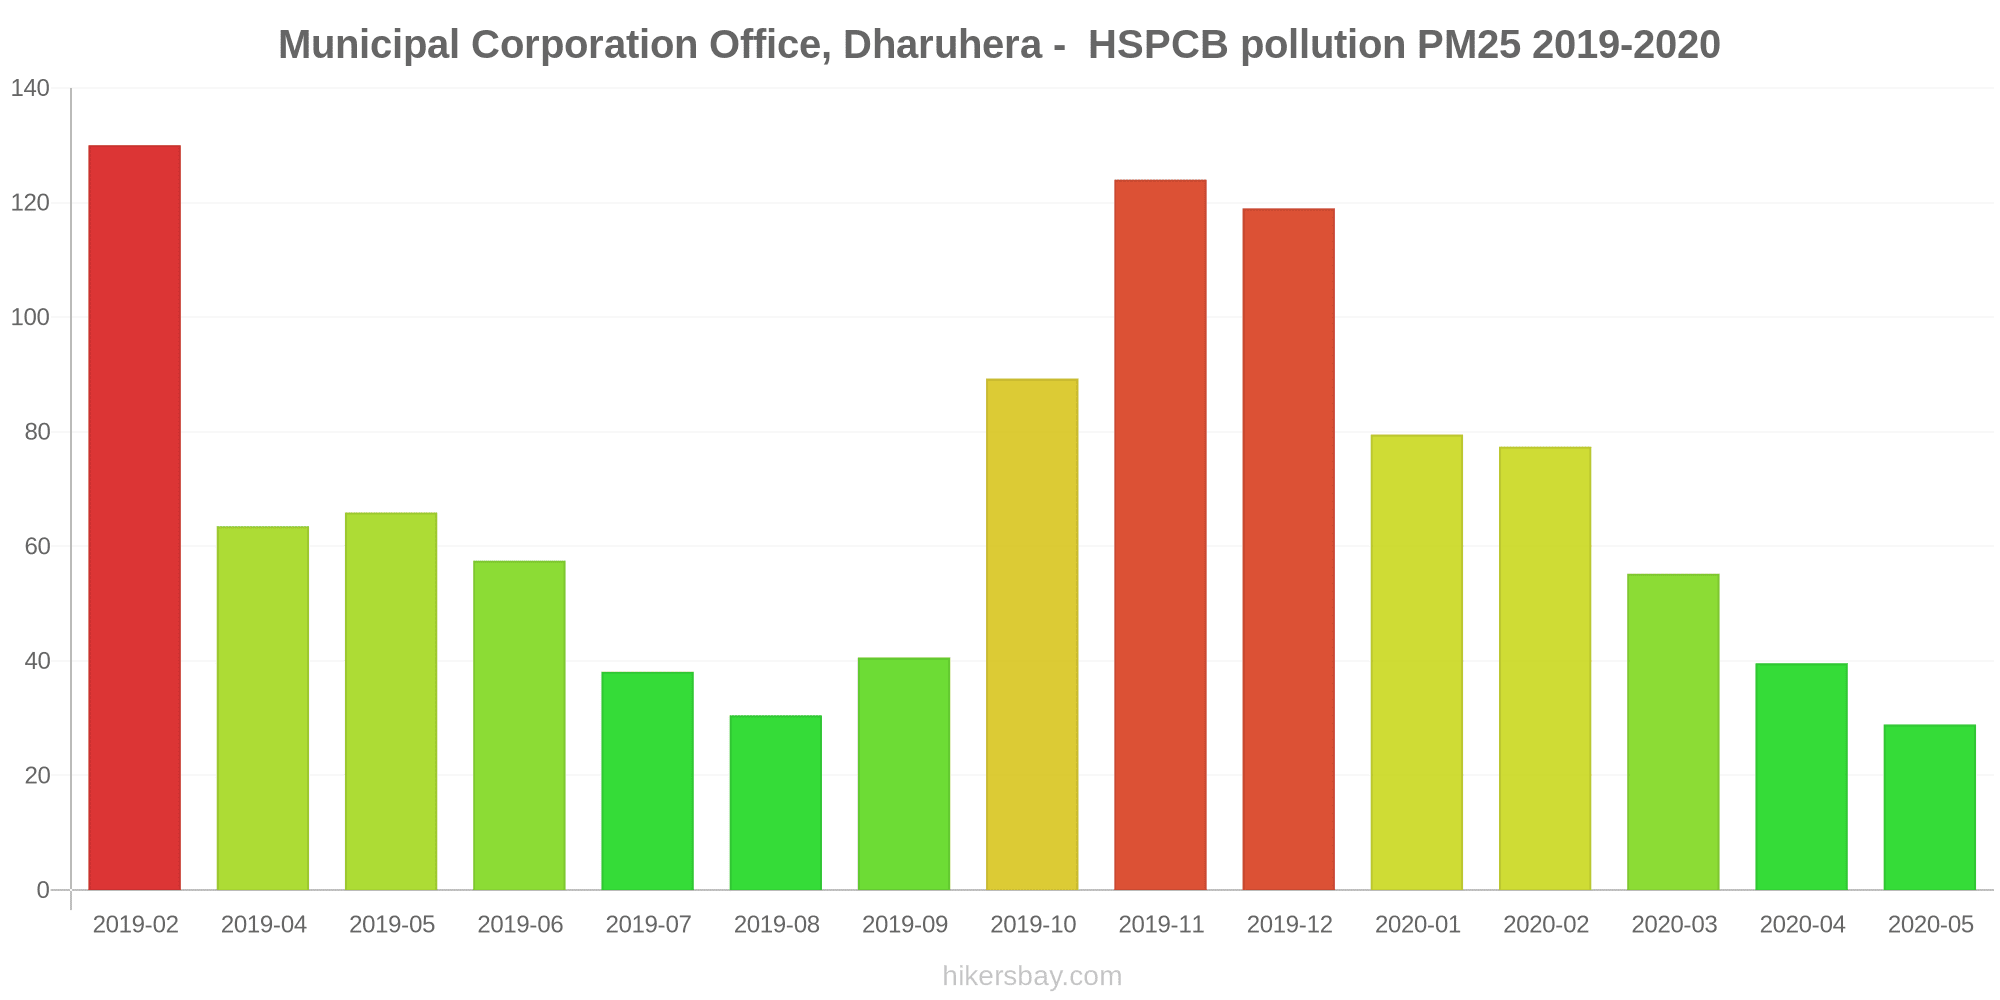
| index | 2020-05 | 2020-04 | 2020-03 | 2020-02 | 2020-01 | 2019-12 | 2019-11 | 2019-10 | 2019-09 | 2019-08 | 2019-07 | 2019-06 | 2019-05 | 2019-04 | 2019-02 |
|---|---|---|---|---|---|---|---|---|---|---|---|---|---|---|---|
| pm25 | 29 | 40 | 55 | 77 | 80 | 119 | 124 | 89 | 41 | 31 | 38 | 58 | 66 | 64 | 130 |
| pm10 | 40 | 56 | 137 | 208 | 183 | 207 | 242 | 222 | 92 | 74 | 127 | 194 | 185 | 205 | 196 |
| no2 | 19 | 9.1 | 36 | 56 | 54 | 57 | 75 | 45 | 19 | 16 | 15 | 24 | 61 | 39 | 61 |
| so2 | 59 | 13 | 22 | 20 | 19 | 14 | 14 | 14 | 6.8 | 3 | 7.8 | 11 | 22 | 15 | 32 |
| co | 1 | 976 | 1 | 1 | 2 | 1 | 2 | 1 | 2 | 2 | 1 | 1 | 1 | 784 | 2 |
| o3 | 69 | 54 | 35 | 43 | 25 | 29 | 41 | 58 | 56 | 40 | 50 | 45 | 18 | 19 | 25 |