Luftverschmutzung in Palwal: Echtzeit-Luft-Qualitätsindex und Smog-Alarm.
Für die Palwal. Heute ist Donnerstag, 4. Juni 2026. Für Palwal wurden folgende Luftverschmutzungswerte gemessen:- Feinstaub (PM10) Schwebestaub - 121 (Sehr ungesund)
- Schwefeldioxid (SO2) - 11 (gut)
- Feinstaub (PM2,5) - 17 (Moderate)
- Kohlenmonoxid (CO) - 750 (gut)
- Stickstoffdioxid (NO2) - 6 (gut)
- Ozon (O3) - 13 (gut)

Wie ist die Luftqualität Palwal heute? Ist die Luft in Palwal? verschmutzt. Gibt es Smog?
Wie hoch ist der PM10-Stand heute in Palwal? (Feinstaub (PM10) Schwebestaub)
Der aktuelle Feinstaubgehalt PM10 in Palwal is:
121 (Sehr ungesund)
Die höchsten PM10-Werte treten in der Regel im Monat auf: 296 (April 2019).
Der niedrigste Wert der Feinstaub-PM10-Belastung in Palwal ist in der Regel in: August (70).
Wie hoch ist die SO2-Belastung? (Schwefeldioxid (SO2))
11 (gut)
Wie hoch ist der aktuelle PM2,5-Wert in Palwal? (Feinstaub (PM2,5))
Die heutige PM2.5-Stufe ist:
17 (Moderate)
Zum Vergleich: Der höchste PM2,5-Wert in Palwal in den letzten 7 Tagen war: 17 (Montag, 31. Oktober 2022) und der niedrigste: 17 (Montag, 31. Oktober 2022).
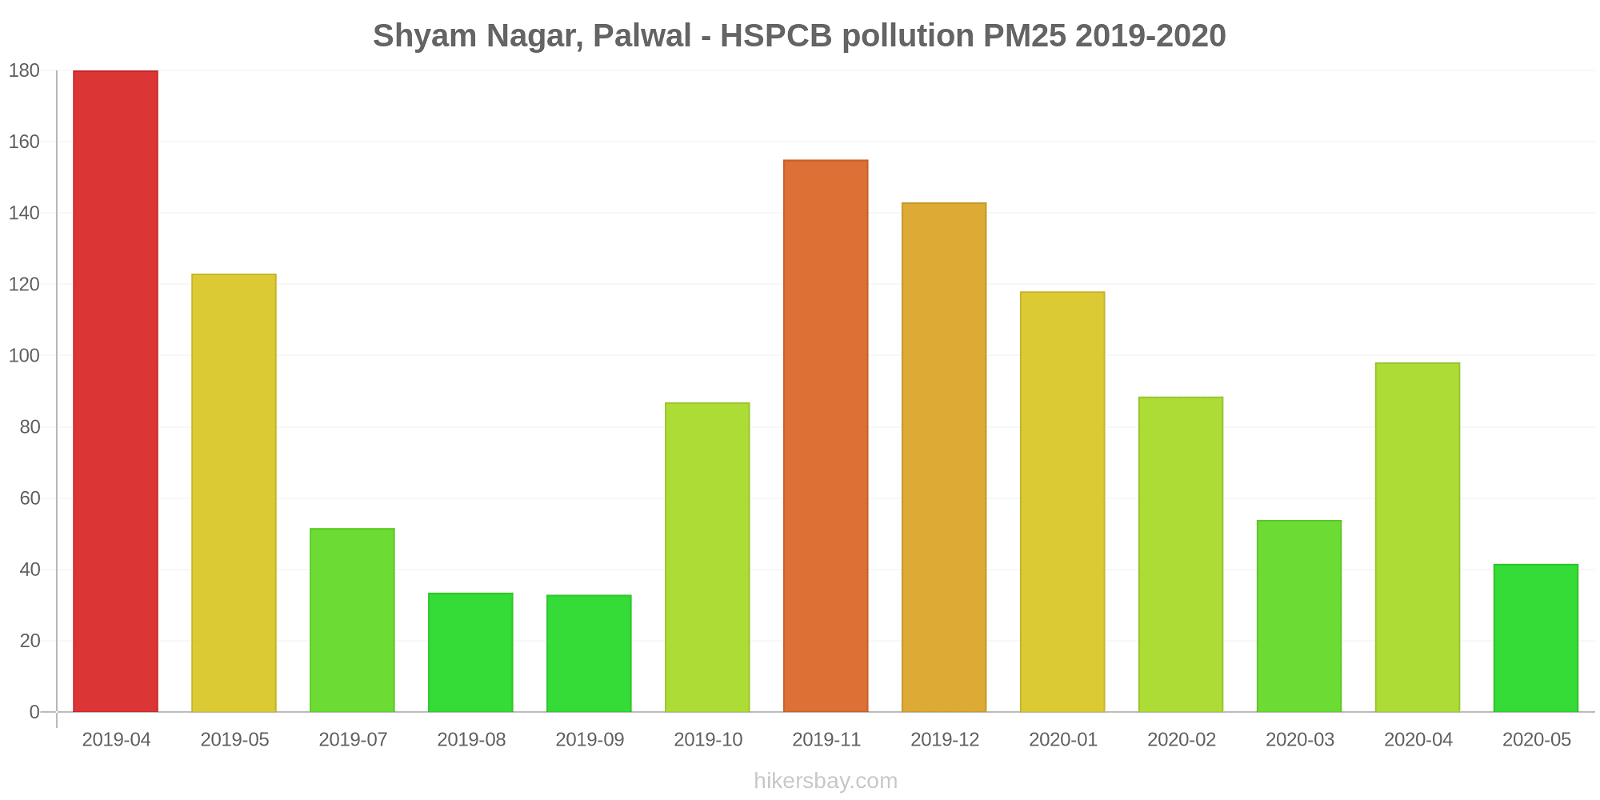
Die höchsten PM2,5-Werte wurden gemessen: 180 (April 2019).
Die niedrigste Feinstaubbelastung PM2,5 tritt im Monat auf: September (33).
Wie hoch ist der CO-Gehalt? (Kohlenmonoxid (CO))
750 (gut)
Wie hoch ist das NO2-Niveau? (Stickstoffdioxid (NO2))
6 (gut)
Wie ist das O3-Niveau heute in Palwal? (Ozon (O3))
13 (gut)
Aktuelle Daten Montag, 31. Oktober 2022, 01:30
PM10 121 (Sehr ungesund)
SO2 11 (gut)
PM2,5 17 (Moderate)
CO 750 (gut)
NO2 6 (gut)
O3 13 (gut)
Daten zur Luftverschmutzung der letzten Tage in Palwal
index
2022-10-31
pm10
122
Very Unhealthy
so2
11
Good
pm25
17
Moderate
co
755
Good
no2
6
Good
o3
13
Good
data source »
Luftverschmutzung in Palwal von April 2019 bis Mai 2020

index
2020-05
2020-04
2020-03
2020-02
2020-01
2019-12
2019-11
2019-10
2019-09
2019-08
2019-07
2019-05
2019-04
pm25
42 (Unhealthy for Sensitive Groups)
98 (Very Unhealthy)
54 (Unhealthy for Sensitive Groups)
89 (Very Unhealthy)
118 (Very bad Hazardous)
143 (Very bad Hazardous)
155 (Very bad Hazardous)
87 (Very Unhealthy)
33 (Moderate)
34 (Moderate)
52 (Unhealthy for Sensitive Groups)
123 (Very bad Hazardous)
180 (Very bad Hazardous)
pm10
98 (Unhealthy)
124 (Very Unhealthy)
113 (Very Unhealthy)
166 (Very bad Hazardous)
172 (Very bad Hazardous)
186 (Very bad Hazardous)
235 (Very bad Hazardous)
172 (Very bad Hazardous)
74 (Unhealthy for Sensitive Groups)
70 (Unhealthy for Sensitive Groups)
96 (Unhealthy)
217 (Very bad Hazardous)
296 (Very bad Hazardous)
no2
6.3 (Good)
6 (Good)
9.4 (Good)
10 (Good)
10 (Good)
28 (Good)
34 (Good)
20 (Good)
9.6 (Good)
12 (Good)
12 (Good)
19 (Good)
25 (Good)
so2
9.2 (Good)
16 (Good)
12 (Good)
15 (Good)
11 (Good)
2.8 (Good)
3.2 (Good)
2.9 (Good)
1.9 (Good)
2.1 (Good)
2.6 (Good)
7.1 (Good)
8.2 (Good)
co
895 (Good)
1 (Good)
1 (Good)
1 (Good)
1 (Good)
953 (Good)
757 (Good)
1 (Good)
796 (Good)
967 (Good)
1 (Good)
720 (Good)
797 (Good)
o3
9.9 (Good)
10 (Good)
9.8 (Good)
11 (Good)
9.9 (Good)
9.6 (Good)
15 (Good)
20 (Good)
13 (Good)
16 (Good)
21 (Good)
31 (Good)
28 (Good)
data source »
Shyam Nagar, Palwal - HSPCB
Montag, 31. Oktober 2022, 01:30
PM10 121 (Sehr ungesund)
Feinstaub (PM10) Schwebestaub
SO2 11 (gut)
Schwefeldioxid (SO2)
PM2,5 17 (Moderate)
Feinstaub (PM2,5)
CO 750 (gut)
Kohlenmonoxid (CO)
NO2 6.2 (gut)
Stickstoffdioxid (NO2)
O3 13 (gut)
Ozon (O3)
Shyam Nagar, Palwal - HSPCB
index
2022-10-31
pm10
122
so2
11
pm25
17
co
755
no2
5.9
o3
13
Shyam Nagar, Palwal - HSPCB
2019-04 2020-05
index
2020-05
2020-04
2020-03
2020-02
2020-01
2019-12
2019-11
2019-10
2019-09
2019-08
2019-07
2019-05
2019-04
pm25
42
98
54
89
118
143
155
87
33
34
52
123
180
pm10
98
124
113
166
172
186
235
172
74
70
96
217
296
no2
6.3
6
9.4
10
10
28
34
20
9.6
12
12
19
25
so2
9.2
16
12
15
11
2.8
3.2
2.9
1.9
2.1
2.6
7.1
8.2
co
895
1
1
1
1
953
757
1
796
967
1
720
797
o3
9.9
10
9.8
11
9.9
9.6
15
20
13
16
21
31
28
* Pollution data source:
https://openaq.org
(caaqm)
The data is licensed under CC-By 4.0
PM10 121 (Sehr ungesund)
SO2 11 (gut)
PM2,5 17 (Moderate)
CO 750 (gut)
NO2 6 (gut)
O3 13 (gut)
Daten zur Luftverschmutzung der letzten Tage in Palwal
| index | 2022-10-31 |
|---|---|
| pm10 | 122 Very Unhealthy |
| so2 | 11 Good |
| pm25 | 17 Moderate |
| co | 755 Good |
| no2 | 6 Good |
| o3 | 13 Good |

| index | 2020-05 | 2020-04 | 2020-03 | 2020-02 | 2020-01 | 2019-12 | 2019-11 | 2019-10 | 2019-09 | 2019-08 | 2019-07 | 2019-05 | 2019-04 |
|---|---|---|---|---|---|---|---|---|---|---|---|---|---|
| pm25 | 42 (Unhealthy for Sensitive Groups) | 98 (Very Unhealthy) | 54 (Unhealthy for Sensitive Groups) | 89 (Very Unhealthy) | 118 (Very bad Hazardous) | 143 (Very bad Hazardous) | 155 (Very bad Hazardous) | 87 (Very Unhealthy) | 33 (Moderate) | 34 (Moderate) | 52 (Unhealthy for Sensitive Groups) | 123 (Very bad Hazardous) | 180 (Very bad Hazardous) |
| pm10 | 98 (Unhealthy) | 124 (Very Unhealthy) | 113 (Very Unhealthy) | 166 (Very bad Hazardous) | 172 (Very bad Hazardous) | 186 (Very bad Hazardous) | 235 (Very bad Hazardous) | 172 (Very bad Hazardous) | 74 (Unhealthy for Sensitive Groups) | 70 (Unhealthy for Sensitive Groups) | 96 (Unhealthy) | 217 (Very bad Hazardous) | 296 (Very bad Hazardous) |
| no2 | 6.3 (Good) | 6 (Good) | 9.4 (Good) | 10 (Good) | 10 (Good) | 28 (Good) | 34 (Good) | 20 (Good) | 9.6 (Good) | 12 (Good) | 12 (Good) | 19 (Good) | 25 (Good) |
| so2 | 9.2 (Good) | 16 (Good) | 12 (Good) | 15 (Good) | 11 (Good) | 2.8 (Good) | 3.2 (Good) | 2.9 (Good) | 1.9 (Good) | 2.1 (Good) | 2.6 (Good) | 7.1 (Good) | 8.2 (Good) |
| co | 895 (Good) | 1 (Good) | 1 (Good) | 1 (Good) | 1 (Good) | 953 (Good) | 757 (Good) | 1 (Good) | 796 (Good) | 967 (Good) | 1 (Good) | 720 (Good) | 797 (Good) |
| o3 | 9.9 (Good) | 10 (Good) | 9.8 (Good) | 11 (Good) | 9.9 (Good) | 9.6 (Good) | 15 (Good) | 20 (Good) | 13 (Good) | 16 (Good) | 21 (Good) | 31 (Good) | 28 (Good) |
PM10 121 (Sehr ungesund)
Feinstaub (PM10) SchwebestaubSO2 11 (gut)
Schwefeldioxid (SO2)PM2,5 17 (Moderate)
Feinstaub (PM2,5)CO 750 (gut)
Kohlenmonoxid (CO)NO2 6.2 (gut)
Stickstoffdioxid (NO2)O3 13 (gut)
Ozon (O3)Shyam Nagar, Palwal - HSPCB
| index | 2022-10-31 |
|---|---|
| pm10 | 122 |
| so2 | 11 |
| pm25 | 17 |
| co | 755 |
| no2 | 5.9 |
| o3 | 13 |
Shyam Nagar, Palwal - HSPCB

| index | 2020-05 | 2020-04 | 2020-03 | 2020-02 | 2020-01 | 2019-12 | 2019-11 | 2019-10 | 2019-09 | 2019-08 | 2019-07 | 2019-05 | 2019-04 |
|---|---|---|---|---|---|---|---|---|---|---|---|---|---|
| pm25 | 42 | 98 | 54 | 89 | 118 | 143 | 155 | 87 | 33 | 34 | 52 | 123 | 180 |
| pm10 | 98 | 124 | 113 | 166 | 172 | 186 | 235 | 172 | 74 | 70 | 96 | 217 | 296 |
| no2 | 6.3 | 6 | 9.4 | 10 | 10 | 28 | 34 | 20 | 9.6 | 12 | 12 | 19 | 25 |
| so2 | 9.2 | 16 | 12 | 15 | 11 | 2.8 | 3.2 | 2.9 | 1.9 | 2.1 | 2.6 | 7.1 | 8.2 |
| co | 895 | 1 | 1 | 1 | 1 | 953 | 757 | 1 | 796 | 967 | 1 | 720 | 797 |
| o3 | 9.9 | 10 | 9.8 | 11 | 9.9 | 9.6 | 15 | 20 | 13 | 16 | 21 | 31 | 28 |