Luftverschmutzung in Klaipėda County: Echtzeit-Luft-Qualitätsindex und Smog-Alarm.
Für die Klaipėda County. Heute ist Donnerstag, 4. Juni 2026. Für Klaipėda County wurden folgende Luftverschmutzungswerte gemessen:- Feinstaub (PM10) Schwebestaub - 7 (gut)
- Schwefeldioxid (SO2) - 6 (gut)
- Kohlenmonoxid (CO) - 279 (gut)
- Stickstoffdioxid (NO2) - 31 (gut)
- Feinstaub (PM2,5) - 9 (gut)
- Ozon (O3) - 41 (gut)

Wie ist die Luftqualität Klaipėda County heute? Ist die Luft in Klaipėda County? verschmutzt. Gibt es Smog?
Wie hoch ist der PM10-Stand heute in Klaipėda County? (Feinstaub (PM10) Schwebestaub)
Der aktuelle Feinstaubgehalt PM10 in Klaipėda County is:
7 (gut)
Die höchsten PM10-Werte treten in der Regel im Monat auf: 21 (März 2020).
Der niedrigste Wert der Feinstaub-PM10-Belastung in Klaipėda County ist in der Regel in: September (3.4).
Wie hoch ist die SO2-Belastung? (Schwefeldioxid (SO2))
6 (gut)
Wie hoch ist der CO-Gehalt? (Kohlenmonoxid (CO))
279 (gut)
Wie hoch ist das NO2-Niveau? (Stickstoffdioxid (NO2))
31 (gut)
Wie hoch ist der aktuelle PM2,5-Wert in Klaipėda County? (Feinstaub (PM2,5))
Die heutige PM2.5-Stufe ist:
9 (gut)
Zum Vergleich: Der höchste PM2,5-Wert in Klaipėda County in den letzten 7 Tagen war: 7 (Samstag, 13. Januar 2024) und der niedrigste: 2 (Sonntag, 14. Januar 2024).
Die höchsten PM2,5-Werte wurden gemessen: 16 (November 2018).
Die niedrigste Feinstaubbelastung PM2,5 tritt im Monat auf: September (3.4).
Wie ist das O3-Niveau heute in Klaipėda County? (Ozon (O3))
41 (gut)
Aktuelle Daten Mittwoch, 17. Januar 2024, 04:00
PM10 7 (gut)
SO2 6 (gut)
CO 279 (gut)
NO2 31 (gut)
PM2,5 9 (gut)
O3 41 (gut)
Daten zur Luftverschmutzung der letzten Tage in Klaipėda County
index
2024-01-10
2024-01-11
2024-01-12
2024-01-13
2024-01-14
2024-01-15
2024-01-16
2024-01-17
no2
26
Good
26
Good
28
Good
16
Good
23
Good
22
Good
41
Moderate
28
Good
pm10
8
Good
5
Good
9
Good
7
Good
4
Good
4
Good
12
Good
6
Good
co
203
Good
220
Good
231
Good
251
Good
198
Good
220
Good
345
Good
262
Good
so2
7
Good
6
Good
6
Good
6
Good
6
Good
6
Good
7
Good
6
Good
pm25
4
Good
4
Good
4
Good
7
Good
2
Good
3
Good
7
Good
7
Good
o3
55
Good
54
Good
52
Good
51
Good
51
Good
57
Good
42
Good
56
Good
data source »
Luftverschmutzung in Klaipėda County von September 2017 bis Mai 2020

index
2020-05
2020-04
2020-03
2020-02
2020-01
2019-12
2019-11
2019-10
2019-09
2019-08
2019-07
2019-06
2019-05
2019-04
2019-03
2019-02
2019-01
2018-12
2018-11
2018-10
2018-09
2018-08
2018-07
2018-06
2018-05
2018-04
2018-03
2018-02
2018-01
2017-12
2017-11
2017-10
2017-09
co
0.2 (Good)
0.21 (Good)
0.28 (Good)
0.23 (Good)
0.2 (Good)
0.13 (Good)
0.09 (Good)
0.1 (Good)
0.06 (Good)
0.06 (Good)
0.07 (Good)
0.12 (Good)
0.09 (Good)
0.12 (Good)
0.13 (Good)
0.17 (Good)
0.21 (Good)
0.18 (Good)
0.18 (Good)
0.12 (Good)
0.11 (Good)
0.09 (Good)
0.1 (Good)
0.09 (Good)
0.09 (Good)
0.1 (Good)
0.13 (Good)
0.21 (Good)
0.13 (Good)
0.09 (Good)
0.16 (Good)
0.1 (Good)
0.12 (Good)
pm10
13 (Good)
14 (Good)
21 (Moderate)
15 (Good)
13 (Good)
8.5 (Good)
6.4 (Good)
7.6 (Good)
3.4 (Good)
5.8 (Good)
5.7 (Good)
11 (Good)
8.3 (Good)
16 (Good)
8.3 (Good)
13 (Good)
14 (Good)
13 (Good)
19 (Good)
11 (Good)
9.3 (Good)
9.3 (Good)
12 (Good)
9.7 (Good)
14 (Good)
12 (Good)
12 (Good)
15 (Good)
9.3 (Good)
6.2 (Good)
11 (Good)
5.9 (Good)
7.8 (Good)
no2
11 (Good)
12 (Good)
17 (Good)
13 (Good)
8.5 (Good)
8.2 (Good)
5.2 (Good)
6.4 (Good)
3.4 (Good)
5.7 (Good)
5 (Good)
9.5 (Good)
6.1 (Good)
7.6 (Good)
7.3 (Good)
12 (Good)
11 (Good)
12 (Good)
9.7 (Good)
8 (Good)
9 (Good)
7.8 (Good)
9.9 (Good)
8.3 (Good)
7.6 (Good)
7.1 (Good)
8.9 (Good)
11 (Good)
5.8 (Good)
4.5 (Good)
8.9 (Good)
4.4 (Good)
4.8 (Good)
so2
7.1 (Good)
6 (Good)
5.1 (Good)
5.9 (Good)
4.7 (Good)
1.7 (Good)
0.93 (Good)
2.2 (Good)
2.3 (Good)
2.3 (Good)
2.3 (Good)
3.5 (Good)
2.5 (Good)
2.5 (Good)
2.5 (Good)
2.7 (Good)
2.4 (Good)
2.1 (Good)
2.1 (Good)
1.4 (Good)
1.1 (Good)
0.9 (Good)
1.6 (Good)
1 (Good)
1.7 (Good)
1.1 (Good)
0.66 (Good)
1.1 (Good)
0.9 (Good)
0.28 (Good)
5.1 (Good)
2.3 (Good)
1.7 (Good)
pm25
6.2 (Good)
6.9 (Good)
12 (Good)
9.9 (Good)
11 (Good)
7.4 (Good)
6.9 (Good)
8.9 (Good)
3.4 (Good)
5 (Good)
4.2 (Good)
7.7 (Good)
6.5 (Good)
8.7 (Good)
6.3 (Good)
9.4 (Good)
13 (Moderate)
12 (Good)
16 (Moderate)
8.6 (Good)
6.2 (Good)
6.6 (Good)
9 (Good)
6.5 (Good)
7.2 (Good)
8.5 (Good)
6.6 (Good)
11 (Good)
7.5 (Good)
6.6 (Good)
9.3 (Good)
5 (Good)
6.9 (Good)
o3
46 (Good)
55 (Good)
39 (Good)
54 (Good)
46 (Good)
18 (Good)
10 (Good)
18 (Good)
15 (Good)
14 (Good)
20 (Good)
39 (Good)
29 (Good)
31 (Good)
29 (Good)
29 (Good)
27 (Good)
15 (Good)
13 (Good)
14 (Good)
20 (Good)
29 (Good)
31 (Good)
23 (Good)
26 (Good)
27 (Good)
15 (Good)
11 (Good)
14 (Good)
8.9 (Good)
15 (Good)
8.7 (Good)
7 (Good)
data source »
Lebensqualität in Klaipėda County
Grün und Parks in der Stadt
Klaipėda County
92 %
Lettland: 88 %
Weißrussland: 66 %
Estland: 82 %
Polen: 62 %
Åland: 75 %
Feinstaub PM2,5
Klaipėda County
9.9 (Good)
Vergnügen, Zeit in der Stadt zu verbringen
Klaipėda County
91 %
Lettland: 82 %
Weißrussland: 69 %
Estland: 90 %
Polen: 48 %
Åland: 92 %
Feinstaub PM10
Klaipėda County
17 (Good)
Luftverschmutzung
Klaipėda County
8,3 %
Lettland: 29 %
Weißrussland: 42 %
Estland: 12 %
Polen: 63 %
Åland: 17 %
Müllentsorgung
Klaipėda County
79 %
Lettland: 70 %
Weißrussland: 67 %
Estland: 79 %
Polen: 60 %
Åland: 88 %
Verfügbarkeit und Qualität von Trinkwasser
Klaipėda County
97 %
Lettland: 79 %
Weißrussland: 65 %
Estland: 90 %
Polen: 65 %
Åland: 96 %
Sauberkeit und Ordentlichkeit
Klaipėda County
82 %
Lettland: 72 %
Weißrussland: 79 %
Estland: 82 %
Polen: 58 %
Åland: 83 %
Lärm und Lichtverschmutzung
Klaipėda County
30 %
Lettland: 37 %
Weißrussland: 46 %
Estland: 31 %
Polen: 51 %
Åland: 46 %
Wasserverschmutzung
Klaipėda County
26 %
Lettland: 28 %
Weißrussland: 44 %
Estland: 16 %
Polen: 39 %
Åland: 10 %
Source: Numbeo
LT00031
Mittwoch, 17. Januar 2024, 04:00
PM10 4.2 (gut)
Feinstaub (PM10) Schwebestaub
SO2 6.1 (gut)
Schwefeldioxid (SO2)
CO 291 (gut)
Kohlenmonoxid (CO)
NO2 27 (gut)
Stickstoffdioxid (NO2)
LT00033
Mittwoch, 17. Januar 2024, 04:00
PM2,5 9.3 (gut)
Feinstaub (PM2,5)
NO2 35 (gut)
Stickstoffdioxid (NO2)
PM10 10 (gut)
Feinstaub (PM10) Schwebestaub
CO 268 (gut)
Kohlenmonoxid (CO)
O3 41 (gut)
Ozon (O3)
LT00031
index
2024-01-17
2024-01-16
2024-01-15
2024-01-14
2024-01-13
2024-01-12
2024-01-11
2024-01-10
no2
37
43
27
29
21
32
26
34
pm10
4
11
3.9
3.4
4.4
8.5
4
6.2
co
279
388
244
218
275
258
237
222
so2
6
6.6
6.4
6.4
5.9
6.1
6.5
6.6
LT00033
index
2024-01-17
2024-01-16
2024-01-15
2024-01-14
2024-01-13
2024-01-12
2024-01-11
2024-01-10
no2
20
38
18
16
10
24
25
19
co
244
302
197
178
227
205
203
184
pm10
7.5
12
4.8
4.2
8.8
10
6.6
10
pm25
6.6
6.9
3
2.3
7.2
4.2
3.7
4.5
o3
56
42
57
51
51
52
54
55
LT00031
index
2020-05
2020-04
2020-03
2020-02
2020-01
2019-12
2019-11
2019-10
2019-09
2019-08
2019-07
2019-06
2019-05
2019-04
2019-03
2019-02
2019-01
2018-12
2018-11
2018-10
2018-09
2018-08
2018-07
2018-06
2018-05
2018-04
2018-03
2018-02
2018-01
2017-12
2017-11
2017-10
2017-09
pm10
13
13
21
14
11
7.2
5.5
7
2.8
5.3
5
12
8.8
17
8.3
11
16
12
16
9.3
5.3
5
6.3
7.6
12
7.8
7.9
14
7.8
3.5
7.7
2.5
1.6
co
0.18
0.18
0.28
0.23
0.2
0.13
0.09
0.1
0.06
0.07
0.07
0.13
0.11
0.14
0.15
0.2
0.22
0.2
0.21
0.13
0.11
0.08
0.1
0.09
0.1
0.1
0.13
0.24
0.13
0.08
0.17
0.08
0.1
so2
7.1
6
5.1
5.9
4.7
1.7
0.93
2.2
2.3
2.3
2.3
3.5
2.5
2.5
2.5
2.7
2.4
2.1
2.1
1.4
1.1
0.9
1.6
1
1.7
1.1
0.66
1.1
0.9
0.28
5.1
2.3
1.7
no2
8.3
9.6
16
9.6
7.2
7.2
5.3
5.9
3.1
4.3
3.6
8.3
5.2
6.2
6.8
13
8.9
11
9.1
7.4
6.8
5.9
5.8
6.8
6.8
4.5
6.5
12
6
4.6
9.9
3.1
2.6
LT00033
2017-09 2020-05
index
2020-05
2020-04
2020-03
2020-02
2020-01
2019-12
2019-11
2019-10
2019-09
2019-08
2019-07
2019-06
2019-05
2019-04
2019-03
2019-02
2019-01
2018-12
2018-11
2018-10
2018-09
2018-08
2018-07
2018-06
2018-05
2018-04
2018-03
2018-02
2018-01
2017-12
2017-11
2017-10
2017-09
co
0.22
0.24
0.28
0.22
0.2
0.13
0.09
0.1
0.05
0.06
0.07
0.11
0.08
0.1
0.11
0.15
0.19
0.16
0.16
0.1
0.11
0.09
0.1
0.08
0.08
0.1
0.13
0.18
0.12
0.1
0.15
0.11
0.14
pm25
6.2
6.9
12
9.9
11
7.4
6.9
8.9
3.4
5
4.2
7.7
6.5
8.7
6.3
9.4
13
12
16
8.6
6.2
6.6
9
6.5
7.2
8.5
6.6
11
7.5
6.6
9.3
5
6.9
pm10
14
15
20
17
15
9.9
7.3
8.2
4
6.4
6.5
11
7.7
14
8.3
15
12
14
21
12
13
14
18
12
16
16
16
17
11
8.9
14
9.3
14
no2
14
15
19
17
9.8
9.3
5.2
7
3.7
7.1
6.3
11
7.1
9
7.8
12
13
12
10
8.6
11
9.7
14
9.9
8.4
9.8
11
10
5.6
4.4
8
5.6
7
o3
46
55
39
54
46
18
10
18
15
14
20
39
29
31
29
29
27
15
13
14
20
29
31
23
26
27
15
11
14
8.9
15
8.7
7
* Pollution data source:
https://openaq.org
(EEA Lithuania)
The data is licensed under CC-By 4.0
PM10 7 (gut)
SO2 6 (gut)
CO 279 (gut)
NO2 31 (gut)
PM2,5 9 (gut)
O3 41 (gut)
Daten zur Luftverschmutzung der letzten Tage in Klaipėda County
| index | 2024-01-10 | 2024-01-11 | 2024-01-12 | 2024-01-13 | 2024-01-14 | 2024-01-15 | 2024-01-16 | 2024-01-17 |
|---|---|---|---|---|---|---|---|---|
| no2 | 26 Good |
26 Good |
28 Good |
16 Good |
23 Good |
22 Good |
41 Moderate |
28 Good |
| pm10 | 8 Good |
5 Good |
9 Good |
7 Good |
4 Good |
4 Good |
12 Good |
6 Good |
| co | 203 Good |
220 Good |
231 Good |
251 Good |
198 Good |
220 Good |
345 Good |
262 Good |
| so2 | 7 Good |
6 Good |
6 Good |
6 Good |
6 Good |
6 Good |
7 Good |
6 Good |
| pm25 | 4 Good |
4 Good |
4 Good |
7 Good |
2 Good |
3 Good |
7 Good |
7 Good |
| o3 | 55 Good |
54 Good |
52 Good |
51 Good |
51 Good |
57 Good |
42 Good |
56 Good |

| index | 2020-05 | 2020-04 | 2020-03 | 2020-02 | 2020-01 | 2019-12 | 2019-11 | 2019-10 | 2019-09 | 2019-08 | 2019-07 | 2019-06 | 2019-05 | 2019-04 | 2019-03 | 2019-02 | 2019-01 | 2018-12 | 2018-11 | 2018-10 | 2018-09 | 2018-08 | 2018-07 | 2018-06 | 2018-05 | 2018-04 | 2018-03 | 2018-02 | 2018-01 | 2017-12 | 2017-11 | 2017-10 | 2017-09 |
|---|---|---|---|---|---|---|---|---|---|---|---|---|---|---|---|---|---|---|---|---|---|---|---|---|---|---|---|---|---|---|---|---|---|
| co | 0.2 (Good) | 0.21 (Good) | 0.28 (Good) | 0.23 (Good) | 0.2 (Good) | 0.13 (Good) | 0.09 (Good) | 0.1 (Good) | 0.06 (Good) | 0.06 (Good) | 0.07 (Good) | 0.12 (Good) | 0.09 (Good) | 0.12 (Good) | 0.13 (Good) | 0.17 (Good) | 0.21 (Good) | 0.18 (Good) | 0.18 (Good) | 0.12 (Good) | 0.11 (Good) | 0.09 (Good) | 0.1 (Good) | 0.09 (Good) | 0.09 (Good) | 0.1 (Good) | 0.13 (Good) | 0.21 (Good) | 0.13 (Good) | 0.09 (Good) | 0.16 (Good) | 0.1 (Good) | 0.12 (Good) |
| pm10 | 13 (Good) | 14 (Good) | 21 (Moderate) | 15 (Good) | 13 (Good) | 8.5 (Good) | 6.4 (Good) | 7.6 (Good) | 3.4 (Good) | 5.8 (Good) | 5.7 (Good) | 11 (Good) | 8.3 (Good) | 16 (Good) | 8.3 (Good) | 13 (Good) | 14 (Good) | 13 (Good) | 19 (Good) | 11 (Good) | 9.3 (Good) | 9.3 (Good) | 12 (Good) | 9.7 (Good) | 14 (Good) | 12 (Good) | 12 (Good) | 15 (Good) | 9.3 (Good) | 6.2 (Good) | 11 (Good) | 5.9 (Good) | 7.8 (Good) |
| no2 | 11 (Good) | 12 (Good) | 17 (Good) | 13 (Good) | 8.5 (Good) | 8.2 (Good) | 5.2 (Good) | 6.4 (Good) | 3.4 (Good) | 5.7 (Good) | 5 (Good) | 9.5 (Good) | 6.1 (Good) | 7.6 (Good) | 7.3 (Good) | 12 (Good) | 11 (Good) | 12 (Good) | 9.7 (Good) | 8 (Good) | 9 (Good) | 7.8 (Good) | 9.9 (Good) | 8.3 (Good) | 7.6 (Good) | 7.1 (Good) | 8.9 (Good) | 11 (Good) | 5.8 (Good) | 4.5 (Good) | 8.9 (Good) | 4.4 (Good) | 4.8 (Good) |
| so2 | 7.1 (Good) | 6 (Good) | 5.1 (Good) | 5.9 (Good) | 4.7 (Good) | 1.7 (Good) | 0.93 (Good) | 2.2 (Good) | 2.3 (Good) | 2.3 (Good) | 2.3 (Good) | 3.5 (Good) | 2.5 (Good) | 2.5 (Good) | 2.5 (Good) | 2.7 (Good) | 2.4 (Good) | 2.1 (Good) | 2.1 (Good) | 1.4 (Good) | 1.1 (Good) | 0.9 (Good) | 1.6 (Good) | 1 (Good) | 1.7 (Good) | 1.1 (Good) | 0.66 (Good) | 1.1 (Good) | 0.9 (Good) | 0.28 (Good) | 5.1 (Good) | 2.3 (Good) | 1.7 (Good) |
| pm25 | 6.2 (Good) | 6.9 (Good) | 12 (Good) | 9.9 (Good) | 11 (Good) | 7.4 (Good) | 6.9 (Good) | 8.9 (Good) | 3.4 (Good) | 5 (Good) | 4.2 (Good) | 7.7 (Good) | 6.5 (Good) | 8.7 (Good) | 6.3 (Good) | 9.4 (Good) | 13 (Moderate) | 12 (Good) | 16 (Moderate) | 8.6 (Good) | 6.2 (Good) | 6.6 (Good) | 9 (Good) | 6.5 (Good) | 7.2 (Good) | 8.5 (Good) | 6.6 (Good) | 11 (Good) | 7.5 (Good) | 6.6 (Good) | 9.3 (Good) | 5 (Good) | 6.9 (Good) |
| o3 | 46 (Good) | 55 (Good) | 39 (Good) | 54 (Good) | 46 (Good) | 18 (Good) | 10 (Good) | 18 (Good) | 15 (Good) | 14 (Good) | 20 (Good) | 39 (Good) | 29 (Good) | 31 (Good) | 29 (Good) | 29 (Good) | 27 (Good) | 15 (Good) | 13 (Good) | 14 (Good) | 20 (Good) | 29 (Good) | 31 (Good) | 23 (Good) | 26 (Good) | 27 (Good) | 15 (Good) | 11 (Good) | 14 (Good) | 8.9 (Good) | 15 (Good) | 8.7 (Good) | 7 (Good) |
Grün und Parks in der Stadt
Klaipėda County 92 %
Lettland: 88 % Weißrussland: 66 % Estland: 82 % Polen: 62 % Åland: 75 %Feinstaub PM2,5
Klaipėda County 9.9 (Good)
Vergnügen, Zeit in der Stadt zu verbringen
Klaipėda County 91 %
Lettland: 82 % Weißrussland: 69 % Estland: 90 % Polen: 48 % Åland: 92 %Feinstaub PM10
Klaipėda County 17 (Good)
Luftverschmutzung
Klaipėda County 8,3 %
Lettland: 29 % Weißrussland: 42 % Estland: 12 % Polen: 63 % Åland: 17 %Müllentsorgung
Klaipėda County 79 %
Lettland: 70 % Weißrussland: 67 % Estland: 79 % Polen: 60 % Åland: 88 %Verfügbarkeit und Qualität von Trinkwasser
Klaipėda County 97 %
Lettland: 79 % Weißrussland: 65 % Estland: 90 % Polen: 65 % Åland: 96 %Sauberkeit und Ordentlichkeit
Klaipėda County 82 %
Lettland: 72 % Weißrussland: 79 % Estland: 82 % Polen: 58 % Åland: 83 %Lärm und Lichtverschmutzung
Klaipėda County 30 %
Lettland: 37 % Weißrussland: 46 % Estland: 31 % Polen: 51 % Åland: 46 %Wasserverschmutzung
Klaipėda County 26 %
Lettland: 28 % Weißrussland: 44 % Estland: 16 % Polen: 39 % Åland: 10 %PM10 4.2 (gut)
Feinstaub (PM10) SchwebestaubSO2 6.1 (gut)
Schwefeldioxid (SO2)CO 291 (gut)
Kohlenmonoxid (CO)NO2 27 (gut)
Stickstoffdioxid (NO2)PM2,5 9.3 (gut)
Feinstaub (PM2,5)NO2 35 (gut)
Stickstoffdioxid (NO2)PM10 10 (gut)
Feinstaub (PM10) SchwebestaubCO 268 (gut)
Kohlenmonoxid (CO)O3 41 (gut)
Ozon (O3)LT00031
| index | 2024-01-17 | 2024-01-16 | 2024-01-15 | 2024-01-14 | 2024-01-13 | 2024-01-12 | 2024-01-11 | 2024-01-10 |
|---|---|---|---|---|---|---|---|---|
| no2 | 37 | 43 | 27 | 29 | 21 | 32 | 26 | 34 |
| pm10 | 4 | 11 | 3.9 | 3.4 | 4.4 | 8.5 | 4 | 6.2 |
| co | 279 | 388 | 244 | 218 | 275 | 258 | 237 | 222 |
| so2 | 6 | 6.6 | 6.4 | 6.4 | 5.9 | 6.1 | 6.5 | 6.6 |
LT00033
| index | 2024-01-17 | 2024-01-16 | 2024-01-15 | 2024-01-14 | 2024-01-13 | 2024-01-12 | 2024-01-11 | 2024-01-10 |
|---|---|---|---|---|---|---|---|---|
| no2 | 20 | 38 | 18 | 16 | 10 | 24 | 25 | 19 |
| co | 244 | 302 | 197 | 178 | 227 | 205 | 203 | 184 |
| pm10 | 7.5 | 12 | 4.8 | 4.2 | 8.8 | 10 | 6.6 | 10 |
| pm25 | 6.6 | 6.9 | 3 | 2.3 | 7.2 | 4.2 | 3.7 | 4.5 |
| o3 | 56 | 42 | 57 | 51 | 51 | 52 | 54 | 55 |
LT00031
| index | 2020-05 | 2020-04 | 2020-03 | 2020-02 | 2020-01 | 2019-12 | 2019-11 | 2019-10 | 2019-09 | 2019-08 | 2019-07 | 2019-06 | 2019-05 | 2019-04 | 2019-03 | 2019-02 | 2019-01 | 2018-12 | 2018-11 | 2018-10 | 2018-09 | 2018-08 | 2018-07 | 2018-06 | 2018-05 | 2018-04 | 2018-03 | 2018-02 | 2018-01 | 2017-12 | 2017-11 | 2017-10 | 2017-09 |
|---|---|---|---|---|---|---|---|---|---|---|---|---|---|---|---|---|---|---|---|---|---|---|---|---|---|---|---|---|---|---|---|---|---|
| pm10 | 13 | 13 | 21 | 14 | 11 | 7.2 | 5.5 | 7 | 2.8 | 5.3 | 5 | 12 | 8.8 | 17 | 8.3 | 11 | 16 | 12 | 16 | 9.3 | 5.3 | 5 | 6.3 | 7.6 | 12 | 7.8 | 7.9 | 14 | 7.8 | 3.5 | 7.7 | 2.5 | 1.6 |
| co | 0.18 | 0.18 | 0.28 | 0.23 | 0.2 | 0.13 | 0.09 | 0.1 | 0.06 | 0.07 | 0.07 | 0.13 | 0.11 | 0.14 | 0.15 | 0.2 | 0.22 | 0.2 | 0.21 | 0.13 | 0.11 | 0.08 | 0.1 | 0.09 | 0.1 | 0.1 | 0.13 | 0.24 | 0.13 | 0.08 | 0.17 | 0.08 | 0.1 |
| so2 | 7.1 | 6 | 5.1 | 5.9 | 4.7 | 1.7 | 0.93 | 2.2 | 2.3 | 2.3 | 2.3 | 3.5 | 2.5 | 2.5 | 2.5 | 2.7 | 2.4 | 2.1 | 2.1 | 1.4 | 1.1 | 0.9 | 1.6 | 1 | 1.7 | 1.1 | 0.66 | 1.1 | 0.9 | 0.28 | 5.1 | 2.3 | 1.7 |
| no2 | 8.3 | 9.6 | 16 | 9.6 | 7.2 | 7.2 | 5.3 | 5.9 | 3.1 | 4.3 | 3.6 | 8.3 | 5.2 | 6.2 | 6.8 | 13 | 8.9 | 11 | 9.1 | 7.4 | 6.8 | 5.9 | 5.8 | 6.8 | 6.8 | 4.5 | 6.5 | 12 | 6 | 4.6 | 9.9 | 3.1 | 2.6 |
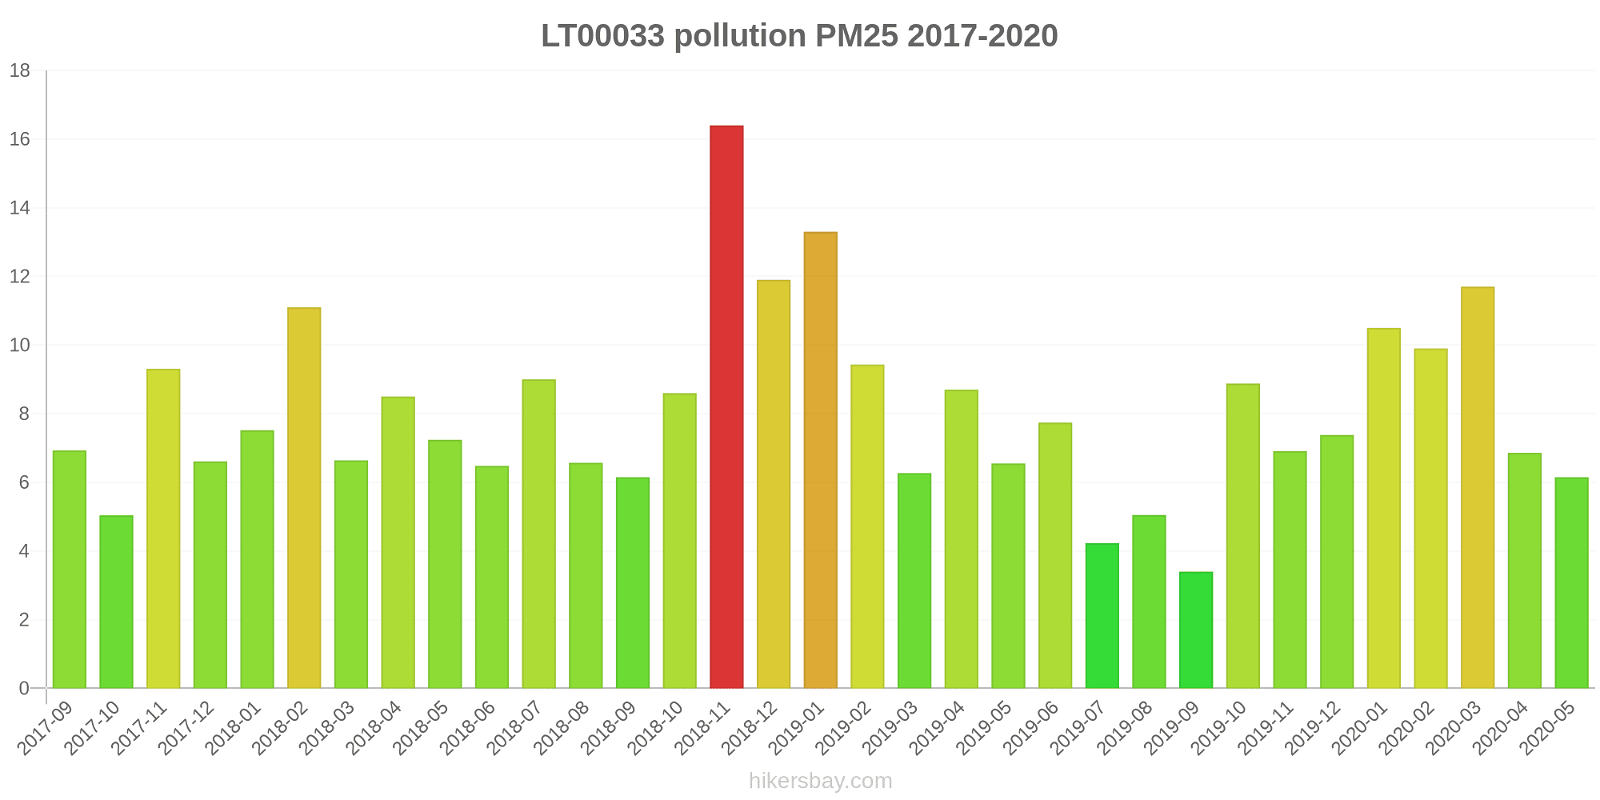
LT00033

| index | 2020-05 | 2020-04 | 2020-03 | 2020-02 | 2020-01 | 2019-12 | 2019-11 | 2019-10 | 2019-09 | 2019-08 | 2019-07 | 2019-06 | 2019-05 | 2019-04 | 2019-03 | 2019-02 | 2019-01 | 2018-12 | 2018-11 | 2018-10 | 2018-09 | 2018-08 | 2018-07 | 2018-06 | 2018-05 | 2018-04 | 2018-03 | 2018-02 | 2018-01 | 2017-12 | 2017-11 | 2017-10 | 2017-09 |
|---|---|---|---|---|---|---|---|---|---|---|---|---|---|---|---|---|---|---|---|---|---|---|---|---|---|---|---|---|---|---|---|---|---|
| co | 0.22 | 0.24 | 0.28 | 0.22 | 0.2 | 0.13 | 0.09 | 0.1 | 0.05 | 0.06 | 0.07 | 0.11 | 0.08 | 0.1 | 0.11 | 0.15 | 0.19 | 0.16 | 0.16 | 0.1 | 0.11 | 0.09 | 0.1 | 0.08 | 0.08 | 0.1 | 0.13 | 0.18 | 0.12 | 0.1 | 0.15 | 0.11 | 0.14 |
| pm25 | 6.2 | 6.9 | 12 | 9.9 | 11 | 7.4 | 6.9 | 8.9 | 3.4 | 5 | 4.2 | 7.7 | 6.5 | 8.7 | 6.3 | 9.4 | 13 | 12 | 16 | 8.6 | 6.2 | 6.6 | 9 | 6.5 | 7.2 | 8.5 | 6.6 | 11 | 7.5 | 6.6 | 9.3 | 5 | 6.9 |
| pm10 | 14 | 15 | 20 | 17 | 15 | 9.9 | 7.3 | 8.2 | 4 | 6.4 | 6.5 | 11 | 7.7 | 14 | 8.3 | 15 | 12 | 14 | 21 | 12 | 13 | 14 | 18 | 12 | 16 | 16 | 16 | 17 | 11 | 8.9 | 14 | 9.3 | 14 |
| no2 | 14 | 15 | 19 | 17 | 9.8 | 9.3 | 5.2 | 7 | 3.7 | 7.1 | 6.3 | 11 | 7.1 | 9 | 7.8 | 12 | 13 | 12 | 10 | 8.6 | 11 | 9.7 | 14 | 9.9 | 8.4 | 9.8 | 11 | 10 | 5.6 | 4.4 | 8 | 5.6 | 7 |
| o3 | 46 | 55 | 39 | 54 | 46 | 18 | 10 | 18 | 15 | 14 | 20 | 39 | 29 | 31 | 29 | 29 | 27 | 15 | 13 | 14 | 20 | 29 | 31 | 23 | 26 | 27 | 15 | 11 | 14 | 8.9 | 15 | 8.7 | 7 |