Luftverschmutzung in Kathmandu: Echtzeit-Luft-Qualitätsindex und Smog-Alarm.
Für die Kathmandu. Heute ist Donnerstag, 4. Juni 2026. Für Kathmandu wurden folgende Luftverschmutzungswerte gemessen:- Feinstaub (PM2,5) - -273 (gut)
- Ozon (O3) - -1 (gut)

Wie ist die Luftqualität Kathmandu heute? Ist die Luft in Kathmandu? verschmutzt. Gibt es Smog?
Wie hoch ist der aktuelle PM2,5-Wert in Kathmandu? (Feinstaub (PM2,5))
Die heutige PM2.5-Stufe ist:
-273 (gut)
Zum Vergleich: Der höchste PM2,5-Wert in Kathmandu in den letzten 7 Tagen war: 104 (Mittwoch, 31. Januar 2024) und der niedrigste: -999 (Samstag, 23. Dezember 2023).
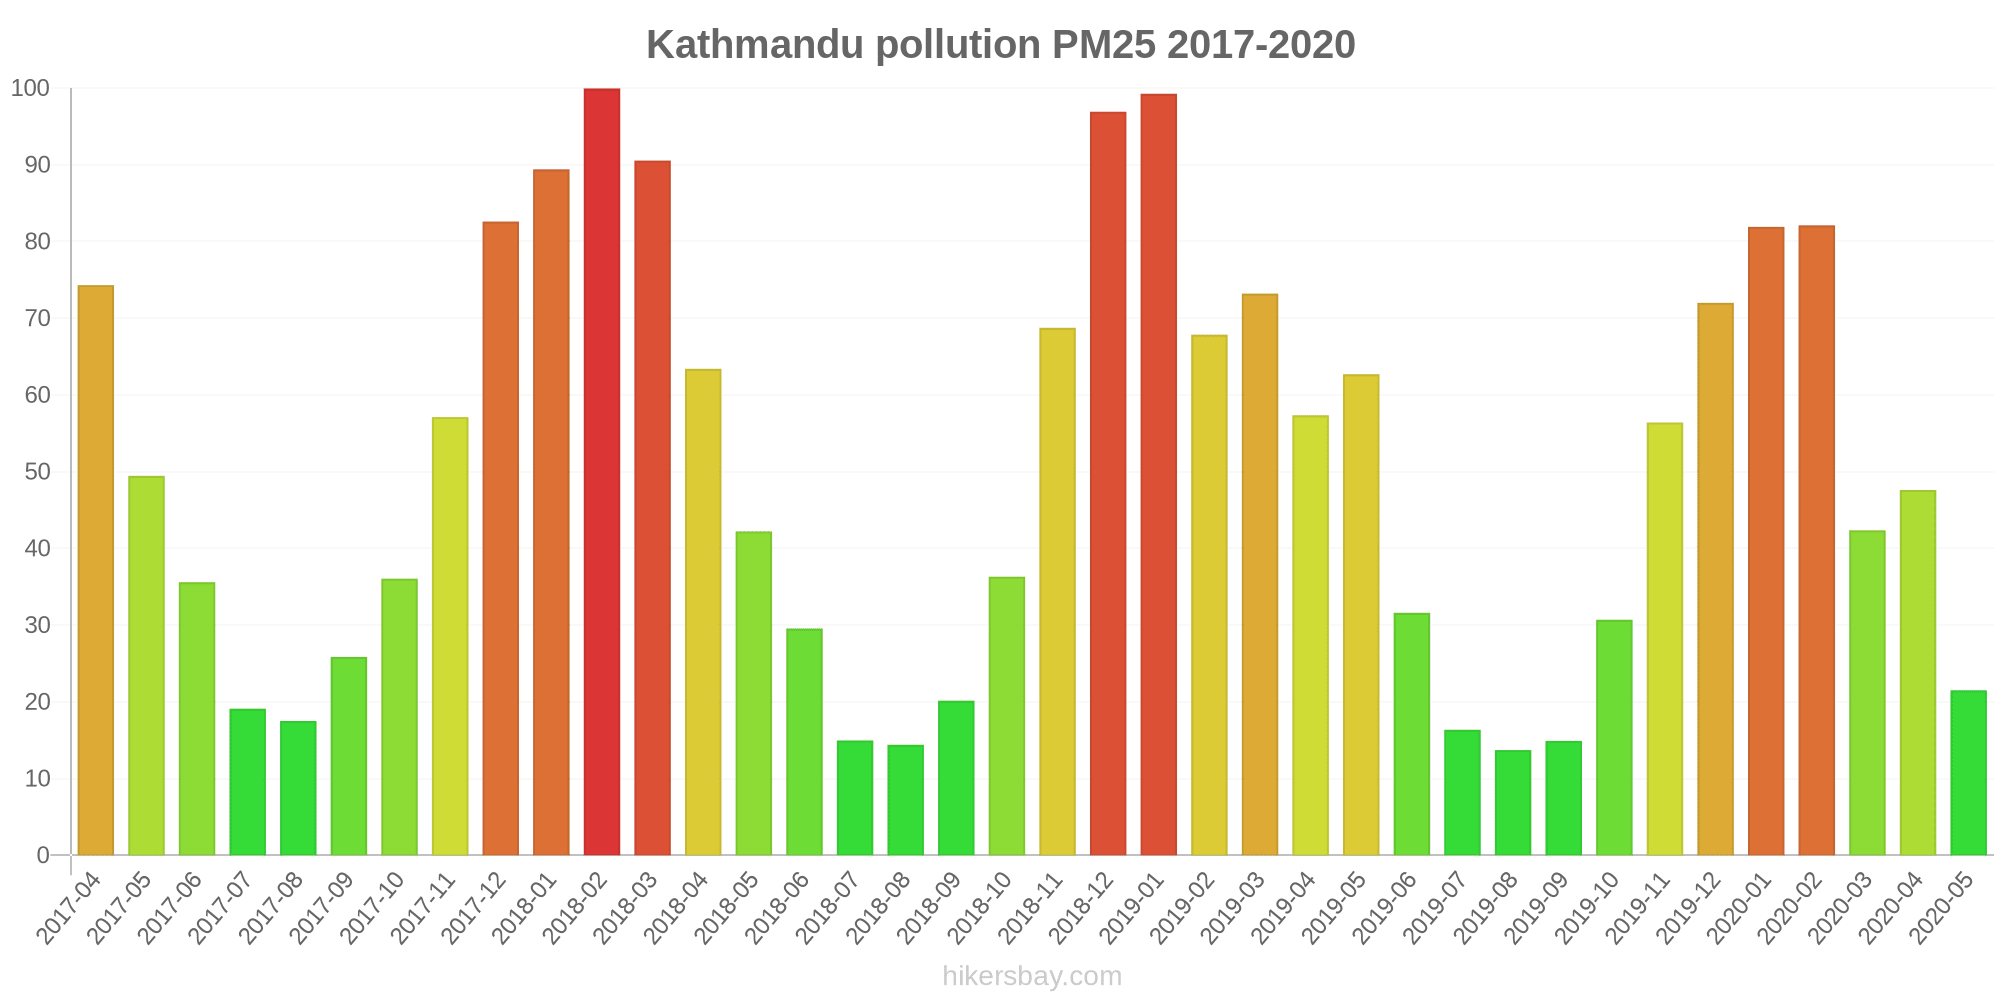
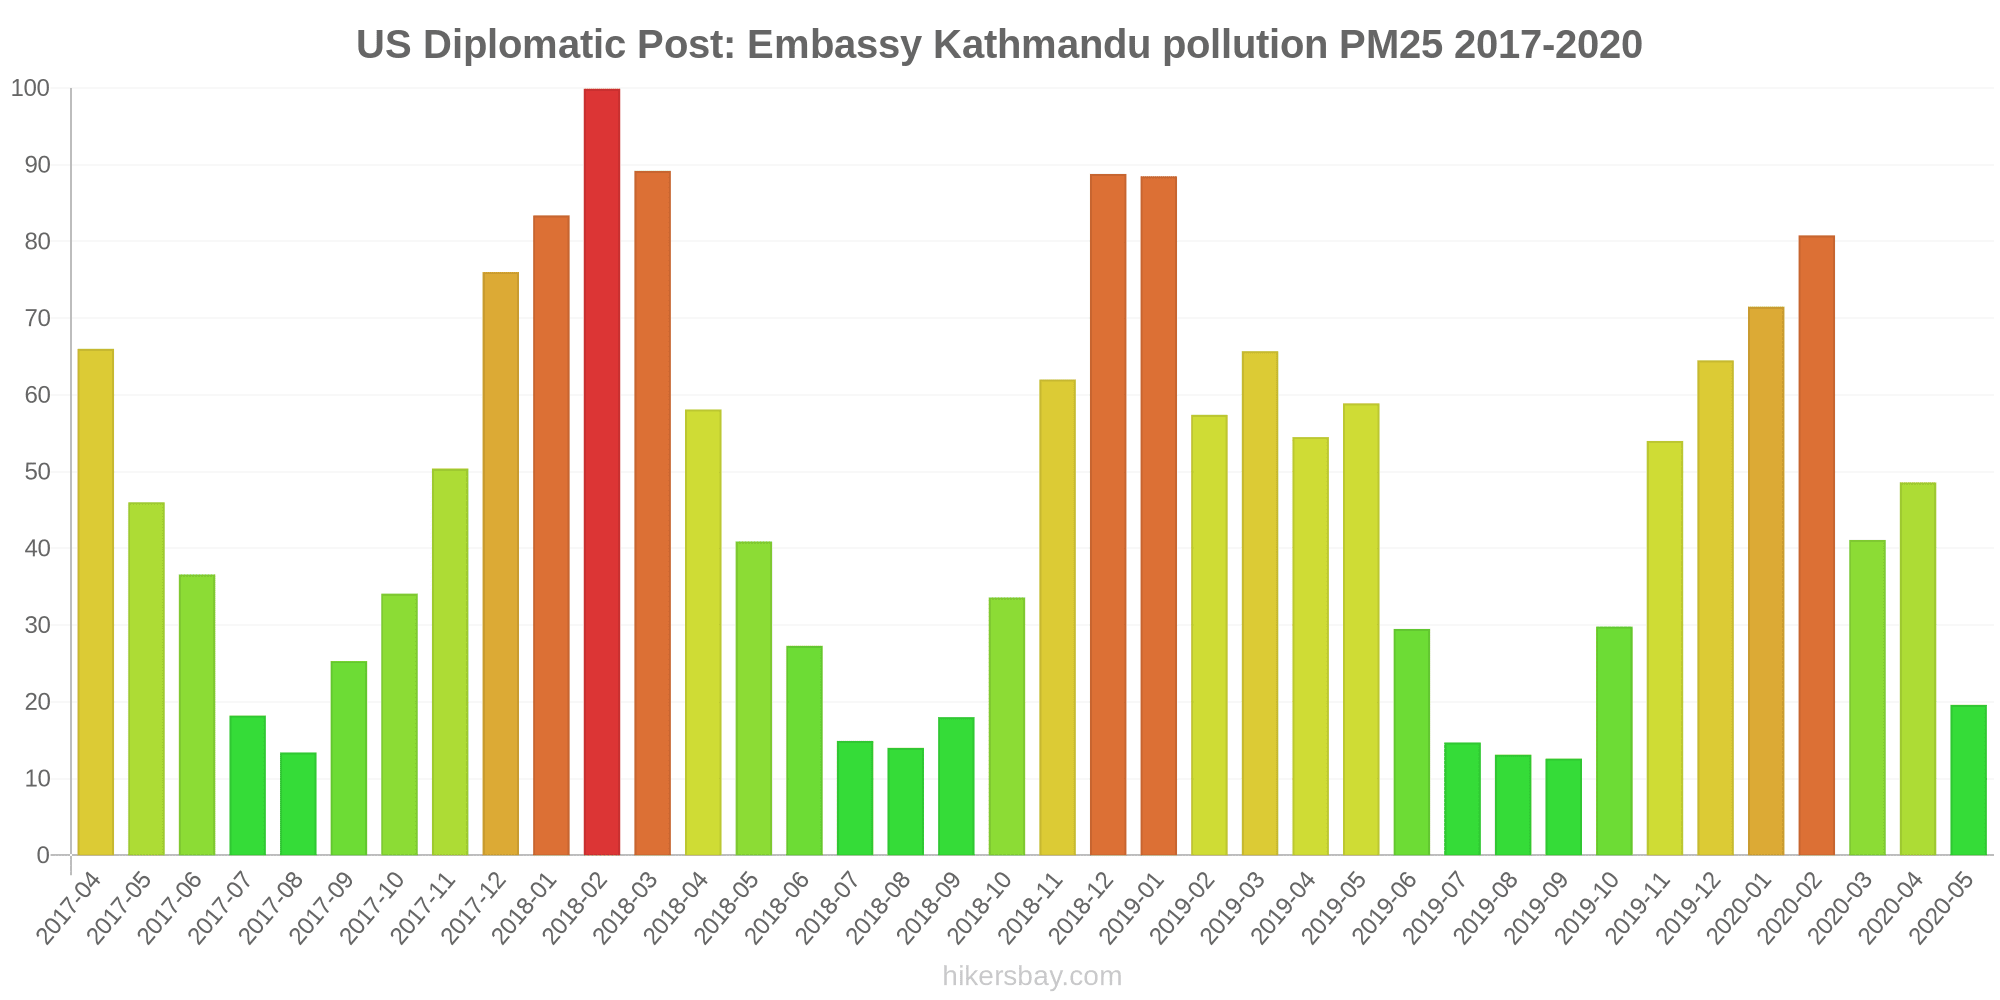
Die höchsten PM2,5-Werte wurden gemessen: 100 (Februar 2018).
Die niedrigste Feinstaubbelastung PM2,5 tritt im Monat auf: August (14).
Wie ist das O3-Niveau heute in Kathmandu? (Ozon (O3))
-1 (gut)
Aktuelle Daten Mittwoch, 17. Januar 2024, 10:00
PM2,5 -273 (gut)
O3 -1 (gut)
Daten zur Luftverschmutzung der letzten Tage in Kathmandu
index
2023-12-23
2023-12-24
2023-12-25
2023-12-26
2023-12-27
2023-12-28
2023-12-29
2023-12-30
2024-01-31
2024-02-01
2024-02-02
2024-02-03
2024-02-04
2024-02-05
2024-02-06
2024-02-07
2024-01-10
2024-01-11
2024-01-12
2024-01-13
2024-01-14
2024-01-15
2024-01-16
2024-01-17
pm25
-999
Good
-999
Good
-999
Good
-999
Good
-999
Good
-756
Good
-442
Good
-285
Good
104
Very Unhealthy
73
Unhealthy
57
Unhealthy
61
Unhealthy
93
Very Unhealthy
79
Very Unhealthy
63
Unhealthy
84
Very Unhealthy
-50
Good
-772
Good
92
Very Unhealthy
92
Very Unhealthy
47
Unhealthy for Sensitive Groups
92
Very Unhealthy
92
Very Unhealthy
92
Very Unhealthy
o3
-1
Good
-1
Good
-1
Good
-1
Good
-1
Good
-1
Good
-1
Good
-1
Good
0
Good
0
Good
0
Good
0
Good
0
Good
0
Good
0
Good
0
Good
-1
Good
-1
Good
-1
Good
-1
Good
-1
Good
-1
Good
-1
Good
-1
Good
data source »
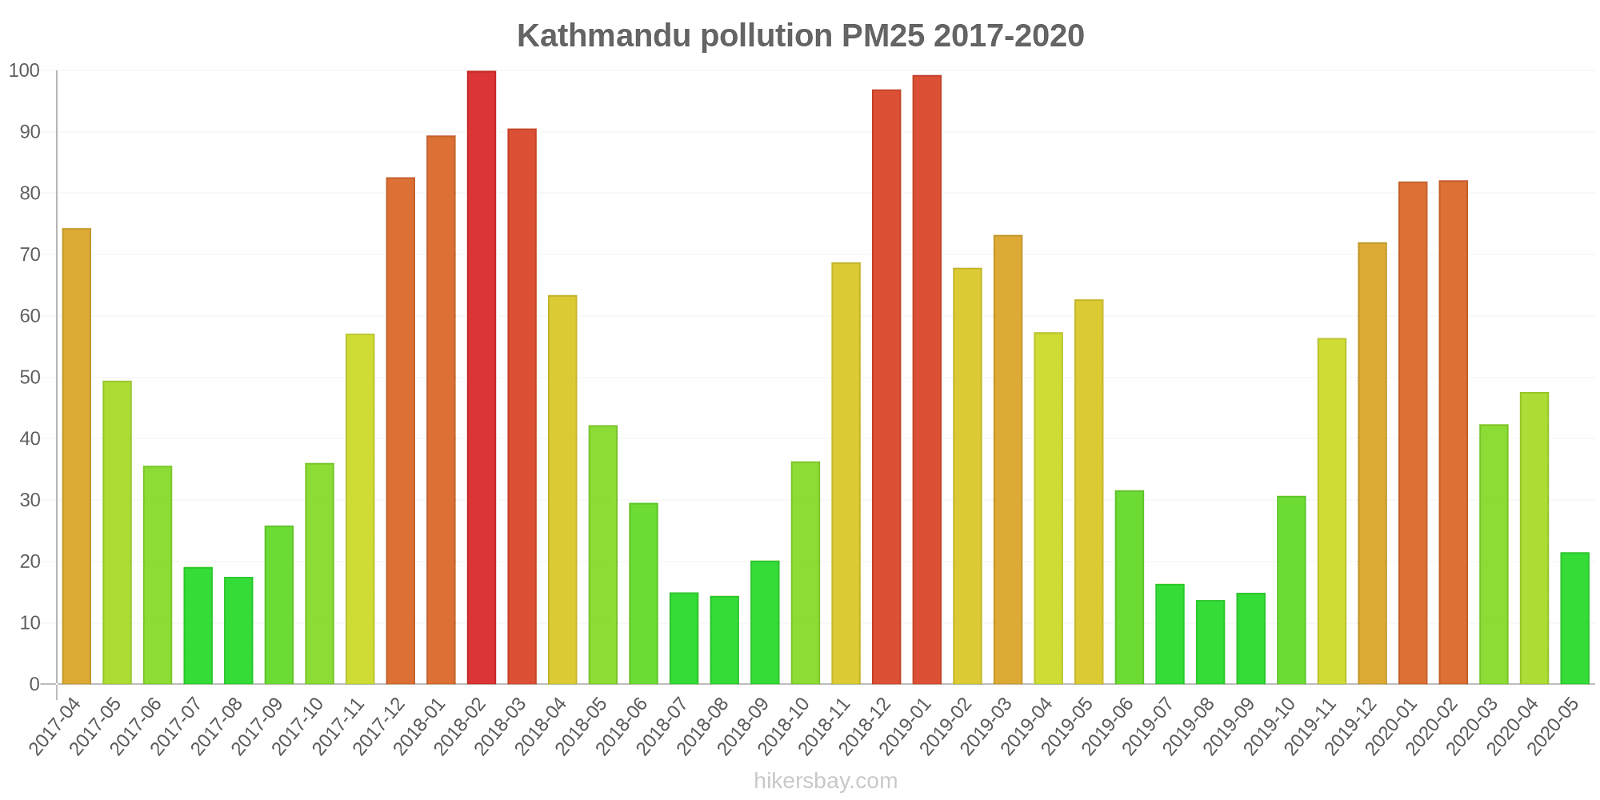
Luftverschmutzung in Kathmandu von April 2017 bis Mai 2020
index
2020-05
2020-04
2020-03
2020-02
2020-01
2019-12
2019-11
2019-10
2019-09
2019-08
2019-07
2019-06
2019-05
2019-04
2019-03
2019-02
2019-01
2018-12
2018-11
2018-10
2018-09
2018-08
2018-07
2018-06
2018-05
2018-04
2018-03
2018-02
2018-01
2017-12
2017-11
2017-10
2017-09
2017-08
2017-07
2017-06
2017-05
2017-04
o3:ppm
0.03 (Good)
0.04 (Good)
0.03 (Good)
0.02 (Good)
0.01 (Good)
0.02 (Good)
0.02 (Good)
0.02 (Good)
0.01 (Good)
0.02 (Good)
0.02 (Good)
0.04 (Good)
0.05 (Good)
0.03 (Good)
0.03 (Good)
0.02 (Good)
0.01 (Good)
0.01 (Good)
0.02 (Good)
0.03 (Good)
0.02 (Good)
0.02 (Good)
0.02 (Good)
0.03 (Good)
0.04 (Good)
0.04 (Good)
0.04 (Good)
0.02 (Good)
0.02 (Good)
0.02 (Good)
0.02 (Good)
0.02 (Good)
0.02 (Good)
0.01 (Good)
0.01 (Good)
0.04 (Good)
0.04 (Good)
0.04 (Good)
pm25
22 (Moderate)
48 (Unhealthy for Sensitive Groups)
42 (Unhealthy for Sensitive Groups)
82 (Very Unhealthy)
82 (Very Unhealthy)
72 (Unhealthy)
56 (Unhealthy)
31 (Moderate)
15 (Moderate)
14 (Moderate)
16 (Moderate)
32 (Moderate)
63 (Unhealthy)
57 (Unhealthy)
73 (Unhealthy)
68 (Unhealthy)
99 (Very Unhealthy)
97 (Very Unhealthy)
69 (Unhealthy)
36 (Unhealthy for Sensitive Groups)
20 (Moderate)
14 (Moderate)
15 (Moderate)
30 (Moderate)
42 (Unhealthy for Sensitive Groups)
63 (Unhealthy)
91 (Very Unhealthy)
100 (Very Unhealthy)
89 (Very Unhealthy)
83 (Very Unhealthy)
57 (Unhealthy)
36 (Unhealthy for Sensitive Groups)
26 (Moderate)
18 (Moderate)
19 (Moderate)
36 (Unhealthy for Sensitive Groups)
49 (Unhealthy for Sensitive Groups)
74 (Unhealthy)
data source »
Lebensqualität in Kathmandu
Grün und Parks in der Stadt
Kathmandu
22 %
Bhutan: 82 %
Bangladesch: 33 %
Indien: 48 %
Myanmar: 33 %
Pakistan: 49 %
Feinstaub PM2,5
Kathmandu
49 (Unhealthy for Sensitive Groups)
Vergnügen, Zeit in der Stadt zu verbringen
Kathmandu
20 %
Bhutan: 61 %
Bangladesch: 26 %
Indien: 40 %
Myanmar: 24 %
Pakistan: 43 %
Feinstaub PM10
Kathmandu
87 (Unhealthy)
Luftverschmutzung
Kathmandu
89 %
Bhutan: 45 %
Bangladesch: 78 %
Indien: 65 %
Myanmar: 83 %
Pakistan: 64 %
Müllentsorgung
Kathmandu
17 %
Bhutan: 47 %
Bangladesch: 22 %
Indien: 34 %
Myanmar: 12 %
Pakistan: 34 %
Verfügbarkeit und Qualität von Trinkwasser
Kathmandu
28 %
Bhutan: 64 %
Bangladesch: 44 %
Indien: 48 %
Myanmar: 34 %
Pakistan: 44 %
Sauberkeit und Ordentlichkeit
Kathmandu
17 %
Bhutan: 57 %
Bangladesch: 23 %
Indien: 37 %
Myanmar: 18 %
Pakistan: 40 %
Lärm und Lichtverschmutzung
Kathmandu
57 %
Bhutan: 55 %
Bangladesch: 63 %
Indien: 59 %
Myanmar: 52 %
Pakistan: 59 %
Wasserverschmutzung
Kathmandu
81 %
Bhutan: 56 %
Bangladesch: 74 %
Indien: 69 %
Myanmar: 74 %
Pakistan: 70 %
Source: Numbeo
Samstag, 30. Dezember 2023, 08:00
PM2,5 -999 (gut)
Feinstaub (PM2,5)
O3 -1 (gut)
Ozon (O3)
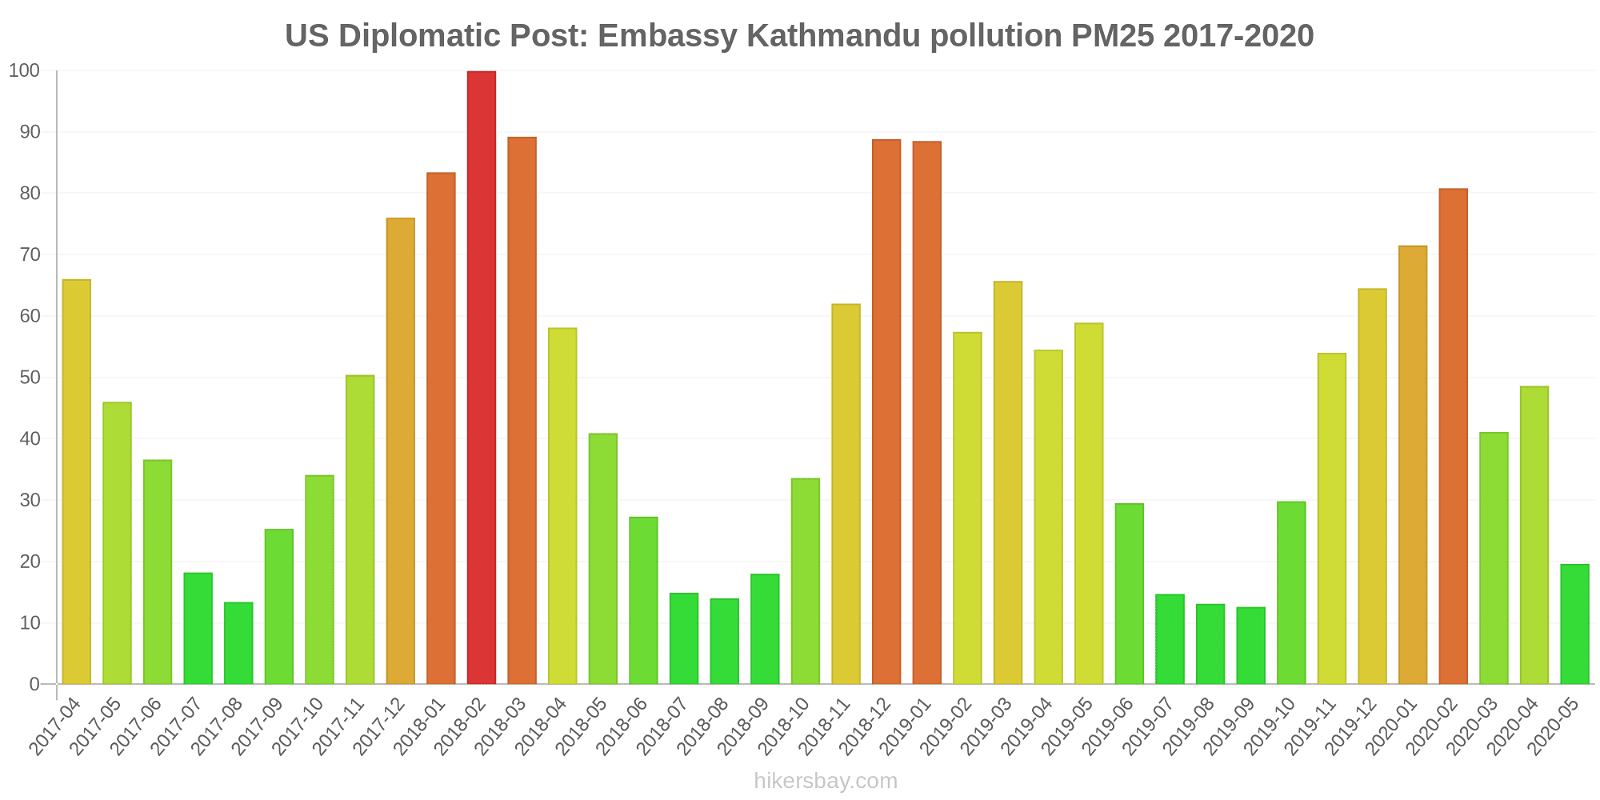
US Diplomatic Post: Embassy Kathmandu
Mittwoch, 7. Februar 2024, 07:00
O3 0.04 (gut)
Ozon (O3)
PM2,5 88 (Sehr ungesund)
Feinstaub (PM2,5)
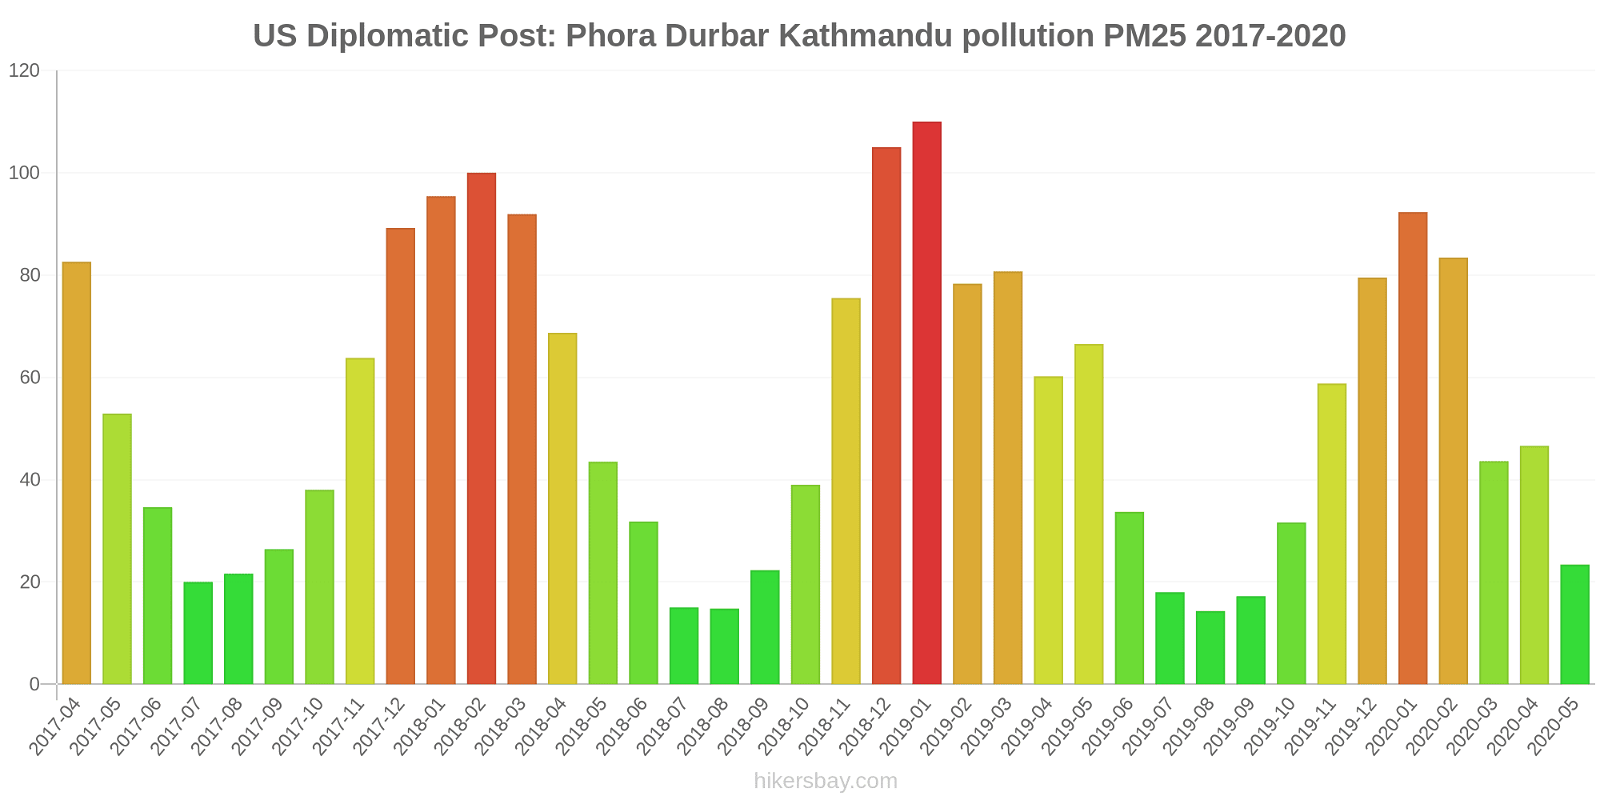
US Diplomatic Post: Phora Durbar Kathmandu
Mittwoch, 17. Januar 2024, 10:00
PM2,5 92 (Sehr ungesund)
Feinstaub (PM2,5)
O3 -1 (gut)
Ozon (O3)
index
2023-12-30
2023-12-29
2023-12-28
2023-12-27
2023-12-26
2023-12-25
2023-12-24
2023-12-23
pm25
-285.22
-441.85
-755.79
-999
-999
-999
-999
-999
o3
-1
-1
-1
-1
-1
-1
-1
-1
US Diplomatic Post: Embassy Kathmandu
index
2024-02-07
2024-02-06
2024-02-05
2024-02-04
2024-02-03
2024-02-02
2024-02-01
2024-01-31
o3
-0.11
0.02
0.02
0.02
-0.02
0.02
0.01
0.03
pm25
84
63
79
93
61
57
73
104
US Diplomatic Post: Phora Durbar Kathmandu
index
2024-01-17
2024-01-16
2024-01-15
2024-01-14
2024-01-13
2024-01-12
2024-01-11
2024-01-10
pm25
92
92
92
47
92
92
-771.71
-50.3
o3
-1
-1
-1
-1
-1
-1
-1
-1
US Diplomatic Post: Embassy Kathmandu
2017-04 2020-05
index
2020-05
2020-04
2020-03
2020-02
2020-01
2019-12
2019-11
2019-10
2019-09
2019-08
2019-07
2019-06
2019-05
2019-04
2019-03
2019-02
2019-01
2018-12
2018-11
2018-10
2018-09
2018-08
2018-07
2018-06
2018-05
2018-04
2018-03
2018-02
2018-01
2017-12
2017-11
2017-10
2017-09
2017-08
2017-07
2017-06
2017-05
2017-04
pm25
20
49
41
81
72
65
54
30
13
13
15
30
59
55
66
57
89
89
62
34
18
14
15
27
41
58
89
100
83
76
50
34
25
13
18
37
46
66
o3:ppm
0.04
0.05
0.03
0.01
0.02
0.02
0.02
0.02
0.02
0.02
0.03
0.04
0.05
0.04
0.04
0.02
0.01
0.01
0.02
0.03
0.02
0.02
0.02
0.04
0.04
0.04
0.04
0.02
0.02
0.02
0.02
0
0
0
0
0.04
0.05
0.04
US Diplomatic Post: Phora Durbar Kathmandu
2017-04 2020-05
index
2020-05
2020-04
2020-03
2020-02
2020-01
2019-12
2019-11
2019-10
2019-09
2019-08
2019-07
2019-06
2019-05
2019-04
2019-03
2019-02
2019-01
2018-12
2018-11
2018-10
2018-09
2018-08
2018-07
2018-06
2018-05
2018-04
2018-03
2018-02
2018-01
2017-12
2017-11
2017-10
2017-09
2017-08
2017-07
2017-06
2017-05
2017-04
pm25
23
47
44
83
92
80
59
32
17
14
18
34
67
60
81
78
110
105
76
39
22
15
15
32
44
69
92
100
95
89
64
38
26
22
20
35
53
83
o3:ppm
0.02
0.03
0.02
0.02
0.01
0.01
0.01
0.02
0.01
0.02
0.02
0.03
0.04
0.03
0.03
0.02
0.01
0.01
0.01
0.02
0.02
0.01
0.01
0.03
0.03
0.03
0.03
0.02
0.02
0.02
0.03
0.03
0.03
0.02
0.02
0.04
0.04
0.04
* Pollution data source:
https://openaq.org
(StateAir_Kathmandu, StateAir_PhoraDurbar)
The data is licensed under CC-By 4.0
PM2,5 -273 (gut)
O3 -1 (gut)
Daten zur Luftverschmutzung der letzten Tage in Kathmandu
| index | 2023-12-23 | 2023-12-24 | 2023-12-25 | 2023-12-26 | 2023-12-27 | 2023-12-28 | 2023-12-29 | 2023-12-30 | 2024-01-31 | 2024-02-01 | 2024-02-02 | 2024-02-03 | 2024-02-04 | 2024-02-05 | 2024-02-06 | 2024-02-07 | 2024-01-10 | 2024-01-11 | 2024-01-12 | 2024-01-13 | 2024-01-14 | 2024-01-15 | 2024-01-16 | 2024-01-17 |
|---|---|---|---|---|---|---|---|---|---|---|---|---|---|---|---|---|---|---|---|---|---|---|---|---|
| pm25 | -999 Good |
-999 Good |
-999 Good |
-999 Good |
-999 Good |
-756 Good |
-442 Good |
-285 Good |
104 Very Unhealthy |
73 Unhealthy |
57 Unhealthy |
61 Unhealthy |
93 Very Unhealthy |
79 Very Unhealthy |
63 Unhealthy |
84 Very Unhealthy |
-50 Good |
-772 Good |
92 Very Unhealthy |
92 Very Unhealthy |
47 Unhealthy for Sensitive Groups |
92 Very Unhealthy |
92 Very Unhealthy |
92 Very Unhealthy |
| o3 | -1 Good |
-1 Good |
-1 Good |
-1 Good |
-1 Good |
-1 Good |
-1 Good |
-1 Good |
0 Good |
0 Good |
0 Good |
0 Good |
0 Good |
0 Good |
0 Good |
0 Good |
-1 Good |
-1 Good |
-1 Good |
-1 Good |
-1 Good |
-1 Good |
-1 Good |
-1 Good |
| index | 2020-05 | 2020-04 | 2020-03 | 2020-02 | 2020-01 | 2019-12 | 2019-11 | 2019-10 | 2019-09 | 2019-08 | 2019-07 | 2019-06 | 2019-05 | 2019-04 | 2019-03 | 2019-02 | 2019-01 | 2018-12 | 2018-11 | 2018-10 | 2018-09 | 2018-08 | 2018-07 | 2018-06 | 2018-05 | 2018-04 | 2018-03 | 2018-02 | 2018-01 | 2017-12 | 2017-11 | 2017-10 | 2017-09 | 2017-08 | 2017-07 | 2017-06 | 2017-05 | 2017-04 |
|---|---|---|---|---|---|---|---|---|---|---|---|---|---|---|---|---|---|---|---|---|---|---|---|---|---|---|---|---|---|---|---|---|---|---|---|---|---|---|
| o3:ppm | 0.03 (Good) | 0.04 (Good) | 0.03 (Good) | 0.02 (Good) | 0.01 (Good) | 0.02 (Good) | 0.02 (Good) | 0.02 (Good) | 0.01 (Good) | 0.02 (Good) | 0.02 (Good) | 0.04 (Good) | 0.05 (Good) | 0.03 (Good) | 0.03 (Good) | 0.02 (Good) | 0.01 (Good) | 0.01 (Good) | 0.02 (Good) | 0.03 (Good) | 0.02 (Good) | 0.02 (Good) | 0.02 (Good) | 0.03 (Good) | 0.04 (Good) | 0.04 (Good) | 0.04 (Good) | 0.02 (Good) | 0.02 (Good) | 0.02 (Good) | 0.02 (Good) | 0.02 (Good) | 0.02 (Good) | 0.01 (Good) | 0.01 (Good) | 0.04 (Good) | 0.04 (Good) | 0.04 (Good) |
| pm25 | 22 (Moderate) | 48 (Unhealthy for Sensitive Groups) | 42 (Unhealthy for Sensitive Groups) | 82 (Very Unhealthy) | 82 (Very Unhealthy) | 72 (Unhealthy) | 56 (Unhealthy) | 31 (Moderate) | 15 (Moderate) | 14 (Moderate) | 16 (Moderate) | 32 (Moderate) | 63 (Unhealthy) | 57 (Unhealthy) | 73 (Unhealthy) | 68 (Unhealthy) | 99 (Very Unhealthy) | 97 (Very Unhealthy) | 69 (Unhealthy) | 36 (Unhealthy for Sensitive Groups) | 20 (Moderate) | 14 (Moderate) | 15 (Moderate) | 30 (Moderate) | 42 (Unhealthy for Sensitive Groups) | 63 (Unhealthy) | 91 (Very Unhealthy) | 100 (Very Unhealthy) | 89 (Very Unhealthy) | 83 (Very Unhealthy) | 57 (Unhealthy) | 36 (Unhealthy for Sensitive Groups) | 26 (Moderate) | 18 (Moderate) | 19 (Moderate) | 36 (Unhealthy for Sensitive Groups) | 49 (Unhealthy for Sensitive Groups) | 74 (Unhealthy) |
Grün und Parks in der Stadt
Kathmandu 22 %
Bhutan: 82 % Bangladesch: 33 % Indien: 48 % Myanmar: 33 % Pakistan: 49 %Feinstaub PM2,5
Kathmandu 49 (Unhealthy for Sensitive Groups)
Vergnügen, Zeit in der Stadt zu verbringen
Kathmandu 20 %
Bhutan: 61 % Bangladesch: 26 % Indien: 40 % Myanmar: 24 % Pakistan: 43 %Feinstaub PM10
Kathmandu 87 (Unhealthy)
Luftverschmutzung
Kathmandu 89 %
Bhutan: 45 % Bangladesch: 78 % Indien: 65 % Myanmar: 83 % Pakistan: 64 %Müllentsorgung
Kathmandu 17 %
Bhutan: 47 % Bangladesch: 22 % Indien: 34 % Myanmar: 12 % Pakistan: 34 %Verfügbarkeit und Qualität von Trinkwasser
Kathmandu 28 %
Bhutan: 64 % Bangladesch: 44 % Indien: 48 % Myanmar: 34 % Pakistan: 44 %Sauberkeit und Ordentlichkeit
Kathmandu 17 %
Bhutan: 57 % Bangladesch: 23 % Indien: 37 % Myanmar: 18 % Pakistan: 40 %Lärm und Lichtverschmutzung
Kathmandu 57 %
Bhutan: 55 % Bangladesch: 63 % Indien: 59 % Myanmar: 52 % Pakistan: 59 %Wasserverschmutzung
Kathmandu 81 %
Bhutan: 56 % Bangladesch: 74 % Indien: 69 % Myanmar: 74 % Pakistan: 70 %PM2,5 -999 (gut)
Feinstaub (PM2,5)O3 -1 (gut)
Ozon (O3)O3 0.04 (gut)
Ozon (O3)PM2,5 88 (Sehr ungesund)
Feinstaub (PM2,5)PM2,5 92 (Sehr ungesund)
Feinstaub (PM2,5)O3 -1 (gut)
Ozon (O3)
| index | 2023-12-30 | 2023-12-29 | 2023-12-28 | 2023-12-27 | 2023-12-26 | 2023-12-25 | 2023-12-24 | 2023-12-23 |
|---|---|---|---|---|---|---|---|---|
| pm25 | -285.22 | -441.85 | -755.79 | -999 | -999 | -999 | -999 | -999 |
| o3 | -1 | -1 | -1 | -1 | -1 | -1 | -1 | -1 |
US Diplomatic Post: Embassy Kathmandu
| index | 2024-02-07 | 2024-02-06 | 2024-02-05 | 2024-02-04 | 2024-02-03 | 2024-02-02 | 2024-02-01 | 2024-01-31 |
|---|---|---|---|---|---|---|---|---|
| o3 | -0.11 | 0.02 | 0.02 | 0.02 | -0.02 | 0.02 | 0.01 | 0.03 |
| pm25 | 84 | 63 | 79 | 93 | 61 | 57 | 73 | 104 |
US Diplomatic Post: Phora Durbar Kathmandu
| index | 2024-01-17 | 2024-01-16 | 2024-01-15 | 2024-01-14 | 2024-01-13 | 2024-01-12 | 2024-01-11 | 2024-01-10 |
|---|---|---|---|---|---|---|---|---|
| pm25 | 92 | 92 | 92 | 47 | 92 | 92 | -771.71 | -50.3 |
| o3 | -1 | -1 | -1 | -1 | -1 | -1 | -1 | -1 |
US Diplomatic Post: Embassy Kathmandu
| index | 2020-05 | 2020-04 | 2020-03 | 2020-02 | 2020-01 | 2019-12 | 2019-11 | 2019-10 | 2019-09 | 2019-08 | 2019-07 | 2019-06 | 2019-05 | 2019-04 | 2019-03 | 2019-02 | 2019-01 | 2018-12 | 2018-11 | 2018-10 | 2018-09 | 2018-08 | 2018-07 | 2018-06 | 2018-05 | 2018-04 | 2018-03 | 2018-02 | 2018-01 | 2017-12 | 2017-11 | 2017-10 | 2017-09 | 2017-08 | 2017-07 | 2017-06 | 2017-05 | 2017-04 |
|---|---|---|---|---|---|---|---|---|---|---|---|---|---|---|---|---|---|---|---|---|---|---|---|---|---|---|---|---|---|---|---|---|---|---|---|---|---|---|
| pm25 | 20 | 49 | 41 | 81 | 72 | 65 | 54 | 30 | 13 | 13 | 15 | 30 | 59 | 55 | 66 | 57 | 89 | 89 | 62 | 34 | 18 | 14 | 15 | 27 | 41 | 58 | 89 | 100 | 83 | 76 | 50 | 34 | 25 | 13 | 18 | 37 | 46 | 66 |
| o3:ppm | 0.04 | 0.05 | 0.03 | 0.01 | 0.02 | 0.02 | 0.02 | 0.02 | 0.02 | 0.02 | 0.03 | 0.04 | 0.05 | 0.04 | 0.04 | 0.02 | 0.01 | 0.01 | 0.02 | 0.03 | 0.02 | 0.02 | 0.02 | 0.04 | 0.04 | 0.04 | 0.04 | 0.02 | 0.02 | 0.02 | 0.02 | 0 | 0 | 0 | 0 | 0.04 | 0.05 | 0.04 |
US Diplomatic Post: Phora Durbar Kathmandu

| index | 2020-05 | 2020-04 | 2020-03 | 2020-02 | 2020-01 | 2019-12 | 2019-11 | 2019-10 | 2019-09 | 2019-08 | 2019-07 | 2019-06 | 2019-05 | 2019-04 | 2019-03 | 2019-02 | 2019-01 | 2018-12 | 2018-11 | 2018-10 | 2018-09 | 2018-08 | 2018-07 | 2018-06 | 2018-05 | 2018-04 | 2018-03 | 2018-02 | 2018-01 | 2017-12 | 2017-11 | 2017-10 | 2017-09 | 2017-08 | 2017-07 | 2017-06 | 2017-05 | 2017-04 |
|---|---|---|---|---|---|---|---|---|---|---|---|---|---|---|---|---|---|---|---|---|---|---|---|---|---|---|---|---|---|---|---|---|---|---|---|---|---|---|
| pm25 | 23 | 47 | 44 | 83 | 92 | 80 | 59 | 32 | 17 | 14 | 18 | 34 | 67 | 60 | 81 | 78 | 110 | 105 | 76 | 39 | 22 | 15 | 15 | 32 | 44 | 69 | 92 | 100 | 95 | 89 | 64 | 38 | 26 | 22 | 20 | 35 | 53 | 83 |
| o3:ppm | 0.02 | 0.03 | 0.02 | 0.02 | 0.01 | 0.01 | 0.01 | 0.02 | 0.01 | 0.02 | 0.02 | 0.03 | 0.04 | 0.03 | 0.03 | 0.02 | 0.01 | 0.01 | 0.01 | 0.02 | 0.02 | 0.01 | 0.01 | 0.03 | 0.03 | 0.03 | 0.03 | 0.02 | 0.02 | 0.02 | 0.03 | 0.03 | 0.03 | 0.02 | 0.02 | 0.04 | 0.04 | 0.04 |