Luftverschmutzung in Peters Corner: Echtzeit-Luft-Qualitätsindex und Smog-Alarm.
Für die Peters Corner. Heute ist Donnerstag, 4. Juni 2026. Für Peters Corner wurden folgende Luftverschmutzungswerte gemessen:- Feinstaub (PM2,5) - 2 (gut)
- Feinstaub (PM10) Schwebestaub - 69 (Ungesund für sensible Gruppen)

Wie ist die Luftqualität Peters Corner heute? Ist die Luft in Peters Corner? verschmutzt. Gibt es Smog?
Wie hoch ist der aktuelle PM2,5-Wert in Peters Corner? (Feinstaub (PM2,5))
Die heutige PM2.5-Stufe ist:
2 (gut)
Zum Vergleich: Der höchste PM2,5-Wert in Peters Corner in den letzten 7 Tagen war: 14 (Freitag, 12. April 2024) und der niedrigste: 5 (Dienstag, 9. April 2024).
Die höchsten PM2,5-Werte wurden gemessen: 15 (Juni 2019).
Die niedrigste Feinstaubbelastung PM2,5 tritt im Monat auf: März (4.2).
Wie hoch ist der PM10-Stand heute in Peters Corner? (Feinstaub (PM10) Schwebestaub)
Der aktuelle Feinstaubgehalt PM10 in Peters Corner is:
69 (Ungesund für sensible Gruppen)
Die höchsten PM10-Werte treten in der Regel im Monat auf: 107 (Juni 2019).
Der niedrigste Wert der Feinstaub-PM10-Belastung in Peters Corner ist in der Regel in: Februar (23).
Aktuelle Daten Dienstag, 16. April 2024, 10:00
PM2,5 2 (gut)
PM10 69 (Ungesund für sensible Gruppen)
Daten zur Luftverschmutzung der letzten Tage in Peters Corner
index
2024-04-09
2024-04-10
2024-04-11
2024-04-12
2024-04-13
2024-04-14
2024-04-15
2024-04-16
pm25
5
Good
8
Good
12
Good
14
Moderate
11
Good
9
Good
7
Good
7
Good
pm10
18
Good
54
Unhealthy for Sensitive Groups
78
Unhealthy for Sensitive Groups
84
Unhealthy
61
Unhealthy for Sensitive Groups
25
Moderate
22
Moderate
31
Moderate
data source »
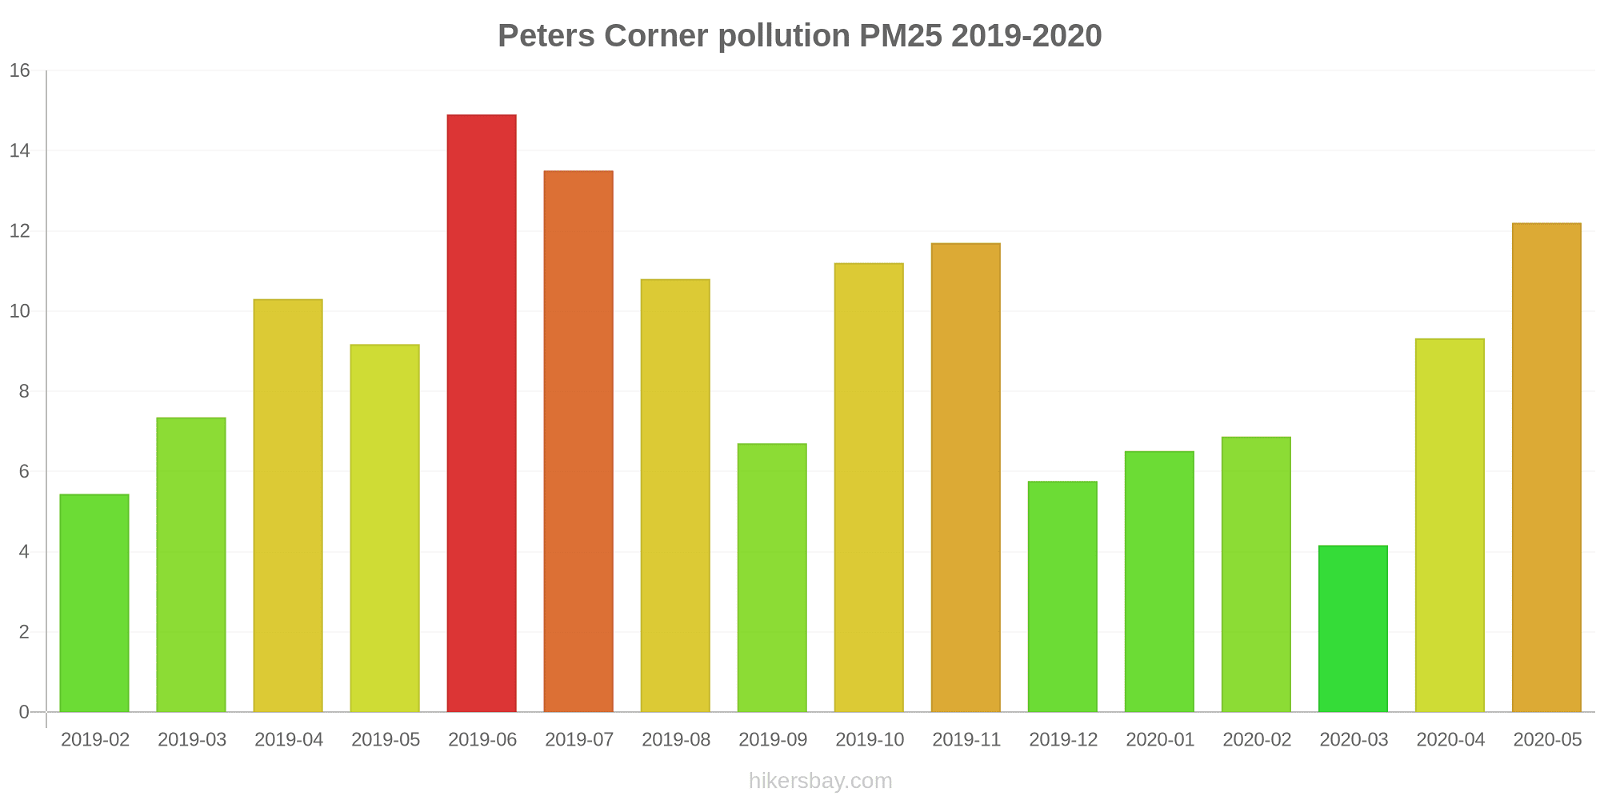
Luftverschmutzung in Peters Corner von August 2016 bis Mai 2020
index
2020-05
2020-04
2020-03
2020-02
2020-01
2019-12
2019-11
2019-10
2019-09
2019-08
2019-07
2019-06
2019-05
2019-04
2019-03
2019-02
2019-01
2018-12
2018-11
2018-10
2018-09
2018-08
2018-07
2018-06
2018-05
2018-04
2018-03
2018-02
2018-01
2017-12
2017-11
2017-10
2017-09
2017-08
2017-07
2017-06
2017-05
2017-04
2017-03
2017-02
2017-01
2016-12
2016-11
2016-10
2016-09
2016-08
pm10
85 (Unhealthy)
61 (Unhealthy for Sensitive Groups)
29 (Moderate)
51 (Unhealthy for Sensitive Groups)
32 (Moderate)
26 (Moderate)
80 (Unhealthy)
92 (Unhealthy)
55 (Unhealthy for Sensitive Groups)
69 (Unhealthy for Sensitive Groups)
87 (Unhealthy)
107 (Unhealthy)
60 (Unhealthy for Sensitive Groups)
70 (Unhealthy for Sensitive Groups)
43 (Moderate)
23 (Moderate)
27 (Moderate)
35 (Moderate)
71 (Unhealthy for Sensitive Groups)
32 (Moderate)
80 (Unhealthy)
56 (Unhealthy for Sensitive Groups)
58 (Unhealthy for Sensitive Groups)
61 (Unhealthy for Sensitive Groups)
51 (Unhealthy for Sensitive Groups)
59 (Unhealthy for Sensitive Groups)
41 (Moderate)
63 (Unhealthy for Sensitive Groups)
51 (Unhealthy for Sensitive Groups)
62 (Unhealthy for Sensitive Groups)
67 (Unhealthy for Sensitive Groups)
82 (Unhealthy)
57 (Unhealthy for Sensitive Groups)
67 (Unhealthy for Sensitive Groups)
56 (Unhealthy for Sensitive Groups)
67 (Unhealthy for Sensitive Groups)
49 (Moderate)
49 (Moderate)
49 (Moderate)
39 (Moderate)
23 (Moderate)
38 (Moderate)
47 (Moderate)
74 (Unhealthy for Sensitive Groups)
54 (Unhealthy for Sensitive Groups)
57 (Unhealthy for Sensitive Groups)
pm25
12 (Good)
9.3 (Good)
4.2 (Good)
6.9 (Good)
6.5 (Good)
5.8 (Good)
12 (Good)
11 (Good)
6.7 (Good)
11 (Good)
14 (Moderate)
15 (Moderate)
9.2 (Good)
10 (Good)
7.3 (Good)
5.4 (Good)
- (Good)
- (Good)
- (Good)
- (Good)
- (Good)
- (Good)
- (Good)
- (Good)
- (Good)
- (Good)
- (Good)
- (Good)
- (Good)
- (Good)
- (Good)
- (Good)
- (Good)
- (Good)
- (Good)
- (Good)
- (Good)
- (Good)
- (Good)
- (Good)
- (Good)
- (Good)
- (Good)
- (Good)
- (Good)
- (Good)
data source »
Hidden Valley
Dienstag, 16. April 2024, 10:00
PM2,5 1.8 (gut)
Feinstaub (PM2,5)
PM10 69 (Ungesund für sensible Gruppen)
Feinstaub (PM10) Schwebestaub
Hidden Valley
index
2024-04-16
2024-04-15
2024-04-14
2024-04-13
2024-04-12
2024-04-11
2024-04-10
2024-04-09
pm25
7
7.1
8.7
11
14
12
8.4
5.5
pm10
31
22
25
61
84
78
54
18
Hidden Valley
2016-08 2020-05

index
2020-05
2020-04
2020-03
2020-02
2020-01
2019-12
2019-11
2019-10
2019-09
2019-08
2019-07
2019-06
2019-05
2019-04
2019-03
2019-02
2019-01
2018-12
2018-11
2018-10
2018-09
2018-08
2018-07
2018-06
2018-05
2018-04
2018-03
2018-02
2018-01
2017-12
2017-11
2017-10
2017-09
2017-08
2017-07
2017-06
2017-05
2017-04
2017-03
2017-02
2017-01
2016-12
2016-11
2016-10
2016-09
2016-08
pm10
85
61
29
51
32
26
80
92
55
69
87
107
60
70
43
23
27
35
71
32
80
56
58
61
51
59
41
63
51
62
67
82
57
67
56
67
49
49
49
39
23
38
47
74
54
57
pm25
12
9.3
4.2
6.9
6.5
5.8
12
11
6.7
11
14
15
9.2
10
7.3
5.4
-
-
-
-
-
-
-
-
-
-
-
-
-
-
-
-
-
-
-
-
-
-
-
-
-
-
-
-
-
-
* Pollution data source:
https://openaq.org
(AirNow)
The data is licensed under CC-By 4.0
PM2,5 2 (gut)
PM10 69 (Ungesund für sensible Gruppen)
Daten zur Luftverschmutzung der letzten Tage in Peters Corner
| index | 2024-04-09 | 2024-04-10 | 2024-04-11 | 2024-04-12 | 2024-04-13 | 2024-04-14 | 2024-04-15 | 2024-04-16 |
|---|---|---|---|---|---|---|---|---|
| pm25 | 5 Good |
8 Good |
12 Good |
14 Moderate |
11 Good |
9 Good |
7 Good |
7 Good |
| pm10 | 18 Good |
54 Unhealthy for Sensitive Groups |
78 Unhealthy for Sensitive Groups |
84 Unhealthy |
61 Unhealthy for Sensitive Groups |
25 Moderate |
22 Moderate |
31 Moderate |

| index | 2020-05 | 2020-04 | 2020-03 | 2020-02 | 2020-01 | 2019-12 | 2019-11 | 2019-10 | 2019-09 | 2019-08 | 2019-07 | 2019-06 | 2019-05 | 2019-04 | 2019-03 | 2019-02 | 2019-01 | 2018-12 | 2018-11 | 2018-10 | 2018-09 | 2018-08 | 2018-07 | 2018-06 | 2018-05 | 2018-04 | 2018-03 | 2018-02 | 2018-01 | 2017-12 | 2017-11 | 2017-10 | 2017-09 | 2017-08 | 2017-07 | 2017-06 | 2017-05 | 2017-04 | 2017-03 | 2017-02 | 2017-01 | 2016-12 | 2016-11 | 2016-10 | 2016-09 | 2016-08 |
|---|---|---|---|---|---|---|---|---|---|---|---|---|---|---|---|---|---|---|---|---|---|---|---|---|---|---|---|---|---|---|---|---|---|---|---|---|---|---|---|---|---|---|---|---|---|---|
| pm10 | 85 (Unhealthy) | 61 (Unhealthy for Sensitive Groups) | 29 (Moderate) | 51 (Unhealthy for Sensitive Groups) | 32 (Moderate) | 26 (Moderate) | 80 (Unhealthy) | 92 (Unhealthy) | 55 (Unhealthy for Sensitive Groups) | 69 (Unhealthy for Sensitive Groups) | 87 (Unhealthy) | 107 (Unhealthy) | 60 (Unhealthy for Sensitive Groups) | 70 (Unhealthy for Sensitive Groups) | 43 (Moderate) | 23 (Moderate) | 27 (Moderate) | 35 (Moderate) | 71 (Unhealthy for Sensitive Groups) | 32 (Moderate) | 80 (Unhealthy) | 56 (Unhealthy for Sensitive Groups) | 58 (Unhealthy for Sensitive Groups) | 61 (Unhealthy for Sensitive Groups) | 51 (Unhealthy for Sensitive Groups) | 59 (Unhealthy for Sensitive Groups) | 41 (Moderate) | 63 (Unhealthy for Sensitive Groups) | 51 (Unhealthy for Sensitive Groups) | 62 (Unhealthy for Sensitive Groups) | 67 (Unhealthy for Sensitive Groups) | 82 (Unhealthy) | 57 (Unhealthy for Sensitive Groups) | 67 (Unhealthy for Sensitive Groups) | 56 (Unhealthy for Sensitive Groups) | 67 (Unhealthy for Sensitive Groups) | 49 (Moderate) | 49 (Moderate) | 49 (Moderate) | 39 (Moderate) | 23 (Moderate) | 38 (Moderate) | 47 (Moderate) | 74 (Unhealthy for Sensitive Groups) | 54 (Unhealthy for Sensitive Groups) | 57 (Unhealthy for Sensitive Groups) |
| pm25 | 12 (Good) | 9.3 (Good) | 4.2 (Good) | 6.9 (Good) | 6.5 (Good) | 5.8 (Good) | 12 (Good) | 11 (Good) | 6.7 (Good) | 11 (Good) | 14 (Moderate) | 15 (Moderate) | 9.2 (Good) | 10 (Good) | 7.3 (Good) | 5.4 (Good) | - (Good) | - (Good) | - (Good) | - (Good) | - (Good) | - (Good) | - (Good) | - (Good) | - (Good) | - (Good) | - (Good) | - (Good) | - (Good) | - (Good) | - (Good) | - (Good) | - (Good) | - (Good) | - (Good) | - (Good) | - (Good) | - (Good) | - (Good) | - (Good) | - (Good) | - (Good) | - (Good) | - (Good) | - (Good) | - (Good) |
PM2,5 1.8 (gut)
Feinstaub (PM2,5)PM10 69 (Ungesund für sensible Gruppen)
Feinstaub (PM10) SchwebestaubHidden Valley
| index | 2024-04-16 | 2024-04-15 | 2024-04-14 | 2024-04-13 | 2024-04-12 | 2024-04-11 | 2024-04-10 | 2024-04-09 |
|---|---|---|---|---|---|---|---|---|
| pm25 | 7 | 7.1 | 8.7 | 11 | 14 | 12 | 8.4 | 5.5 |
| pm10 | 31 | 22 | 25 | 61 | 84 | 78 | 54 | 18 |
Hidden Valley

| index | 2020-05 | 2020-04 | 2020-03 | 2020-02 | 2020-01 | 2019-12 | 2019-11 | 2019-10 | 2019-09 | 2019-08 | 2019-07 | 2019-06 | 2019-05 | 2019-04 | 2019-03 | 2019-02 | 2019-01 | 2018-12 | 2018-11 | 2018-10 | 2018-09 | 2018-08 | 2018-07 | 2018-06 | 2018-05 | 2018-04 | 2018-03 | 2018-02 | 2018-01 | 2017-12 | 2017-11 | 2017-10 | 2017-09 | 2017-08 | 2017-07 | 2017-06 | 2017-05 | 2017-04 | 2017-03 | 2017-02 | 2017-01 | 2016-12 | 2016-11 | 2016-10 | 2016-09 | 2016-08 |
|---|---|---|---|---|---|---|---|---|---|---|---|---|---|---|---|---|---|---|---|---|---|---|---|---|---|---|---|---|---|---|---|---|---|---|---|---|---|---|---|---|---|---|---|---|---|---|
| pm10 | 85 | 61 | 29 | 51 | 32 | 26 | 80 | 92 | 55 | 69 | 87 | 107 | 60 | 70 | 43 | 23 | 27 | 35 | 71 | 32 | 80 | 56 | 58 | 61 | 51 | 59 | 41 | 63 | 51 | 62 | 67 | 82 | 57 | 67 | 56 | 67 | 49 | 49 | 49 | 39 | 23 | 38 | 47 | 74 | 54 | 57 |
| pm25 | 12 | 9.3 | 4.2 | 6.9 | 6.5 | 5.8 | 12 | 11 | 6.7 | 11 | 14 | 15 | 9.2 | 10 | 7.3 | 5.4 | - | - | - | - | - | - | - | - | - | - | - | - | - | - | - | - | - | - | - | - | - | - | - | - | - | - | - | - | - | - |