Luftverschmutzung in Grays Harbor: Echtzeit-Luft-Qualitätsindex und Smog-Alarm.
Für die Grays Harbor. Heute ist Donnerstag, 4. Juni 2026. Für Grays Harbor wurden folgende Luftverschmutzungswerte gemessen:- Feinstaub (PM2,5) - 1 (gut)

Wie ist die Luftqualität Grays Harbor heute? Ist die Luft in Grays Harbor? verschmutzt. Gibt es Smog?
Heute (Montag, 2. Januar 2023) ist die Luftqualität gut.
Die Luftqualität hat keinen Einfluss auf die Gesundheit. Jeder kann seine Aktivitäten im Freien normal in Grays Harbor.
Wie hoch ist der aktuelle PM2,5-Wert in Grays Harbor? (Feinstaub (PM2,5))
Die heutige PM2.5-Stufe ist:
1 (gut)
Zum Vergleich: Der höchste PM2,5-Wert in Grays Harbor in den letzten 7 Tagen war: 10 (Freitag, 30. Dezember 2022) und der niedrigste: 1 (Donnerstag, 29. Dezember 2022).
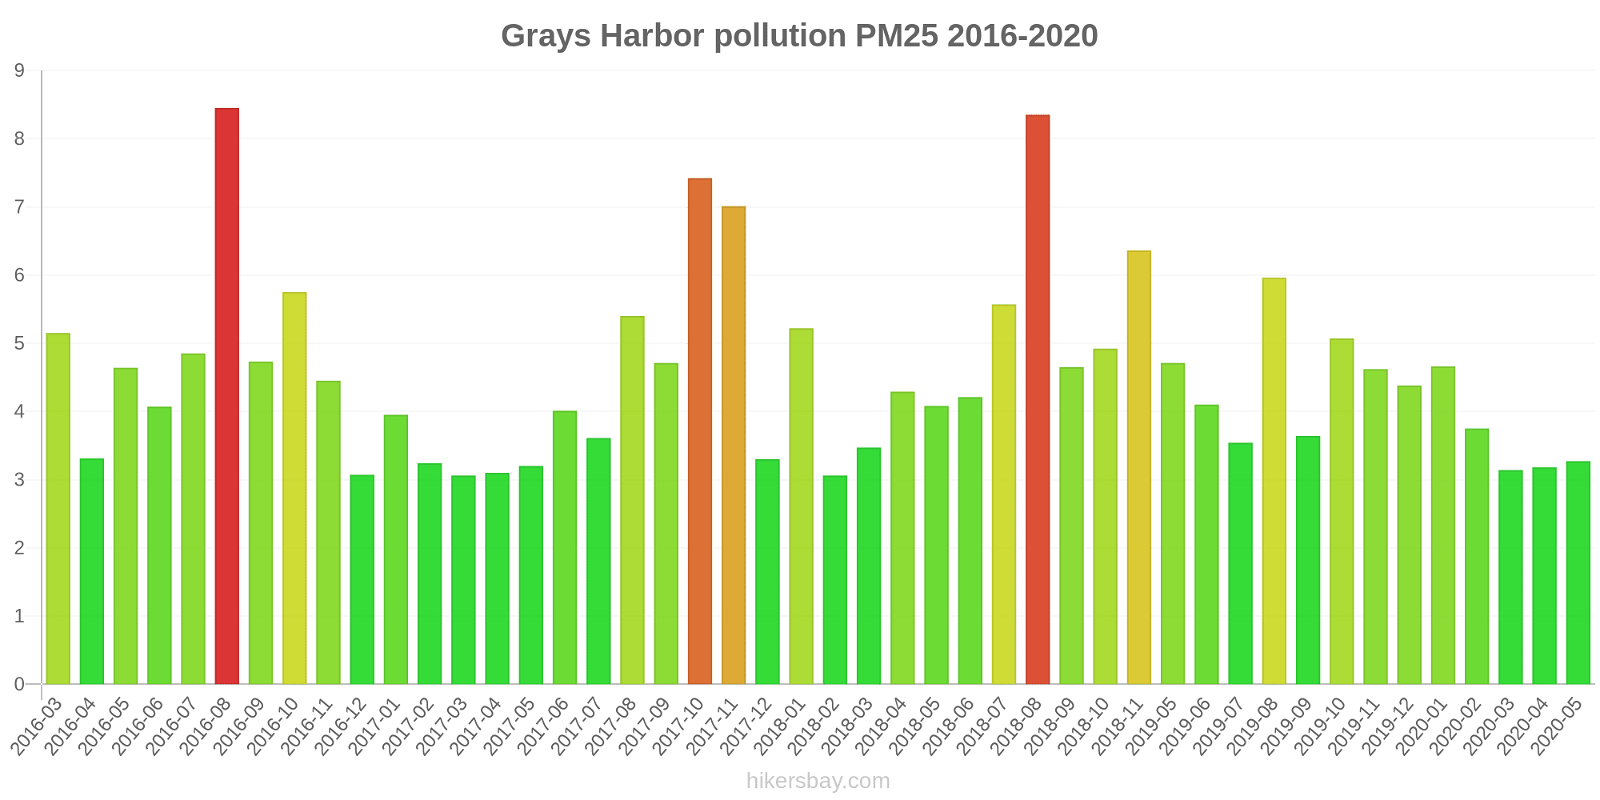
Die höchsten PM2,5-Werte wurden gemessen: 8.4 (August 2016).
Die niedrigste Feinstaubbelastung PM2,5 tritt im Monat auf: Februar (3.1).
Aktuelle Daten Montag, 2. Januar 2023, 13:00
PM2,5 1 (gut)
Daten zur Luftverschmutzung der letzten Tage in Grays Harbor
index
2022-12-28
2022-12-29
2022-12-30
2022-12-31
2023-01-01
2023-01-02
pm25
5
Good
1
Good
10
Good
7
Good
2
Good
3
Good
data source »
Luftverschmutzung in Grays Harbor von März 2016 bis Mai 2020
index
2020-05
2020-04
2020-03
2020-02
2020-01
2019-12
2019-11
2019-10
2019-09
2019-08
2019-07
2019-06
2019-05
2018-11
2018-10
2018-09
2018-08
2018-07
2018-06
2018-05
2018-04
2018-03
2018-02
2018-01
2017-12
2017-11
2017-10
2017-09
2017-08
2017-07
2017-06
2017-05
2017-04
2017-03
2017-02
2017-01
2016-12
2016-11
2016-10
2016-09
2016-08
2016-07
2016-06
2016-05
2016-04
2016-03
pm25
3.3 (Good)
3.2 (Good)
3.1 (Good)
3.8 (Good)
4.7 (Good)
4.4 (Good)
4.6 (Good)
5.1 (Good)
3.6 (Good)
6 (Good)
3.5 (Good)
4.1 (Good)
4.7 (Good)
6.4 (Good)
4.9 (Good)
4.7 (Good)
8.3 (Good)
5.6 (Good)
4.2 (Good)
4.1 (Good)
4.3 (Good)
3.5 (Good)
3.1 (Good)
5.2 (Good)
3.3 (Good)
7 (Good)
7.4 (Good)
4.7 (Good)
5.4 (Good)
3.6 (Good)
4 (Good)
3.2 (Good)
3.1 (Good)
3.1 (Good)
3.2 (Good)
4 (Good)
3.1 (Good)
4.5 (Good)
5.8 (Good)
4.7 (Good)
8.4 (Good)
4.8 (Good)
4.1 (Good)
4.6 (Good)
3.3 (Good)
5.2 (Good)
data source »
Taholah-Quinault Tri
Montag, 2. Januar 2023, 13:00
PM2,5 1.4 (gut)
Feinstaub (PM2,5)
Taholah-Quinault Tri
index
2023-01-02
2023-01-01
2022-12-31
2022-12-30
2022-12-29
2022-12-28
pm25
2.6
1.9
7.3
9.6
1.4
5.4
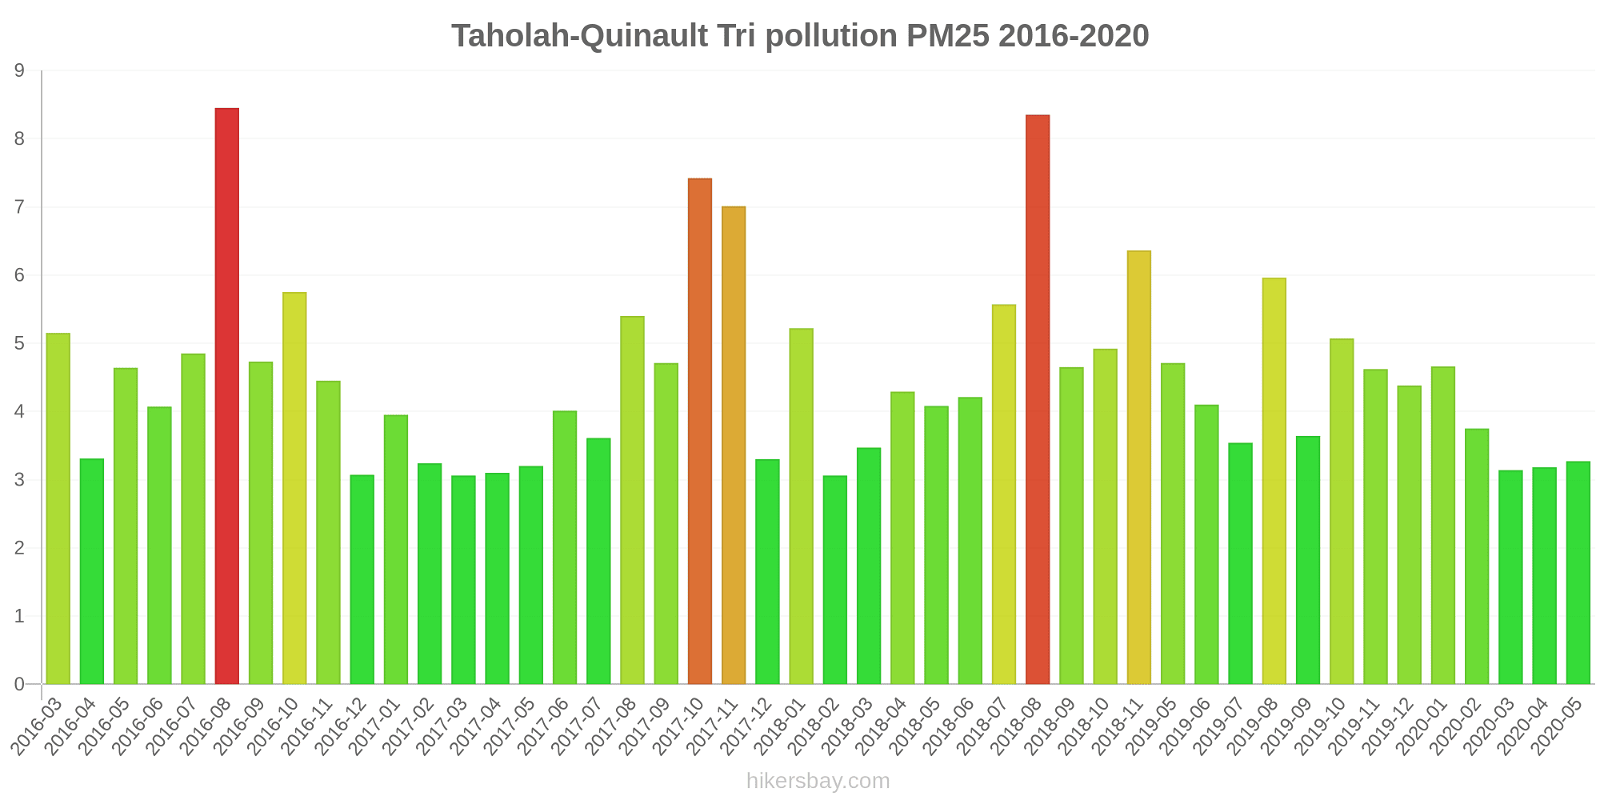
Taholah-Quinault Tri
2016-03 2020-05
index
2020-05
2020-04
2020-03
2020-02
2020-01
2019-12
2019-11
2019-10
2019-09
2019-08
2019-07
2019-06
2019-05
2018-11
2018-10
2018-09
2018-08
2018-07
2018-06
2018-05
2018-04
2018-03
2018-02
2018-01
2017-12
2017-11
2017-10
2017-09
2017-08
2017-07
2017-06
2017-05
2017-04
2017-03
2017-02
2017-01
2016-12
2016-11
2016-10
2016-09
2016-08
2016-07
2016-06
2016-05
2016-04
2016-03
pm25
3.3
3.2
3.1
3.8
4.7
4.4
4.6
5.1
3.6
6
3.5
4.1
4.7
6.4
4.9
4.7
8.3
5.6
4.2
4.1
4.3
3.5
3.1
5.2
3.3
7
7.4
4.7
5.4
3.6
4
3.2
3.1
3.1
3.2
4
3.1
4.5
5.8
4.7
8.4
4.8
4.1
4.6
3.3
5.2
* Pollution data source:
https://openaq.org
(AirNow)
The data is licensed under CC-By 4.0
PM2,5 1 (gut)
Daten zur Luftverschmutzung der letzten Tage in Grays Harbor
| index | 2022-12-28 | 2022-12-29 | 2022-12-30 | 2022-12-31 | 2023-01-01 | 2023-01-02 |
|---|---|---|---|---|---|---|
| pm25 | 5 Good |
1 Good |
10 Good |
7 Good |
2 Good |
3 Good |
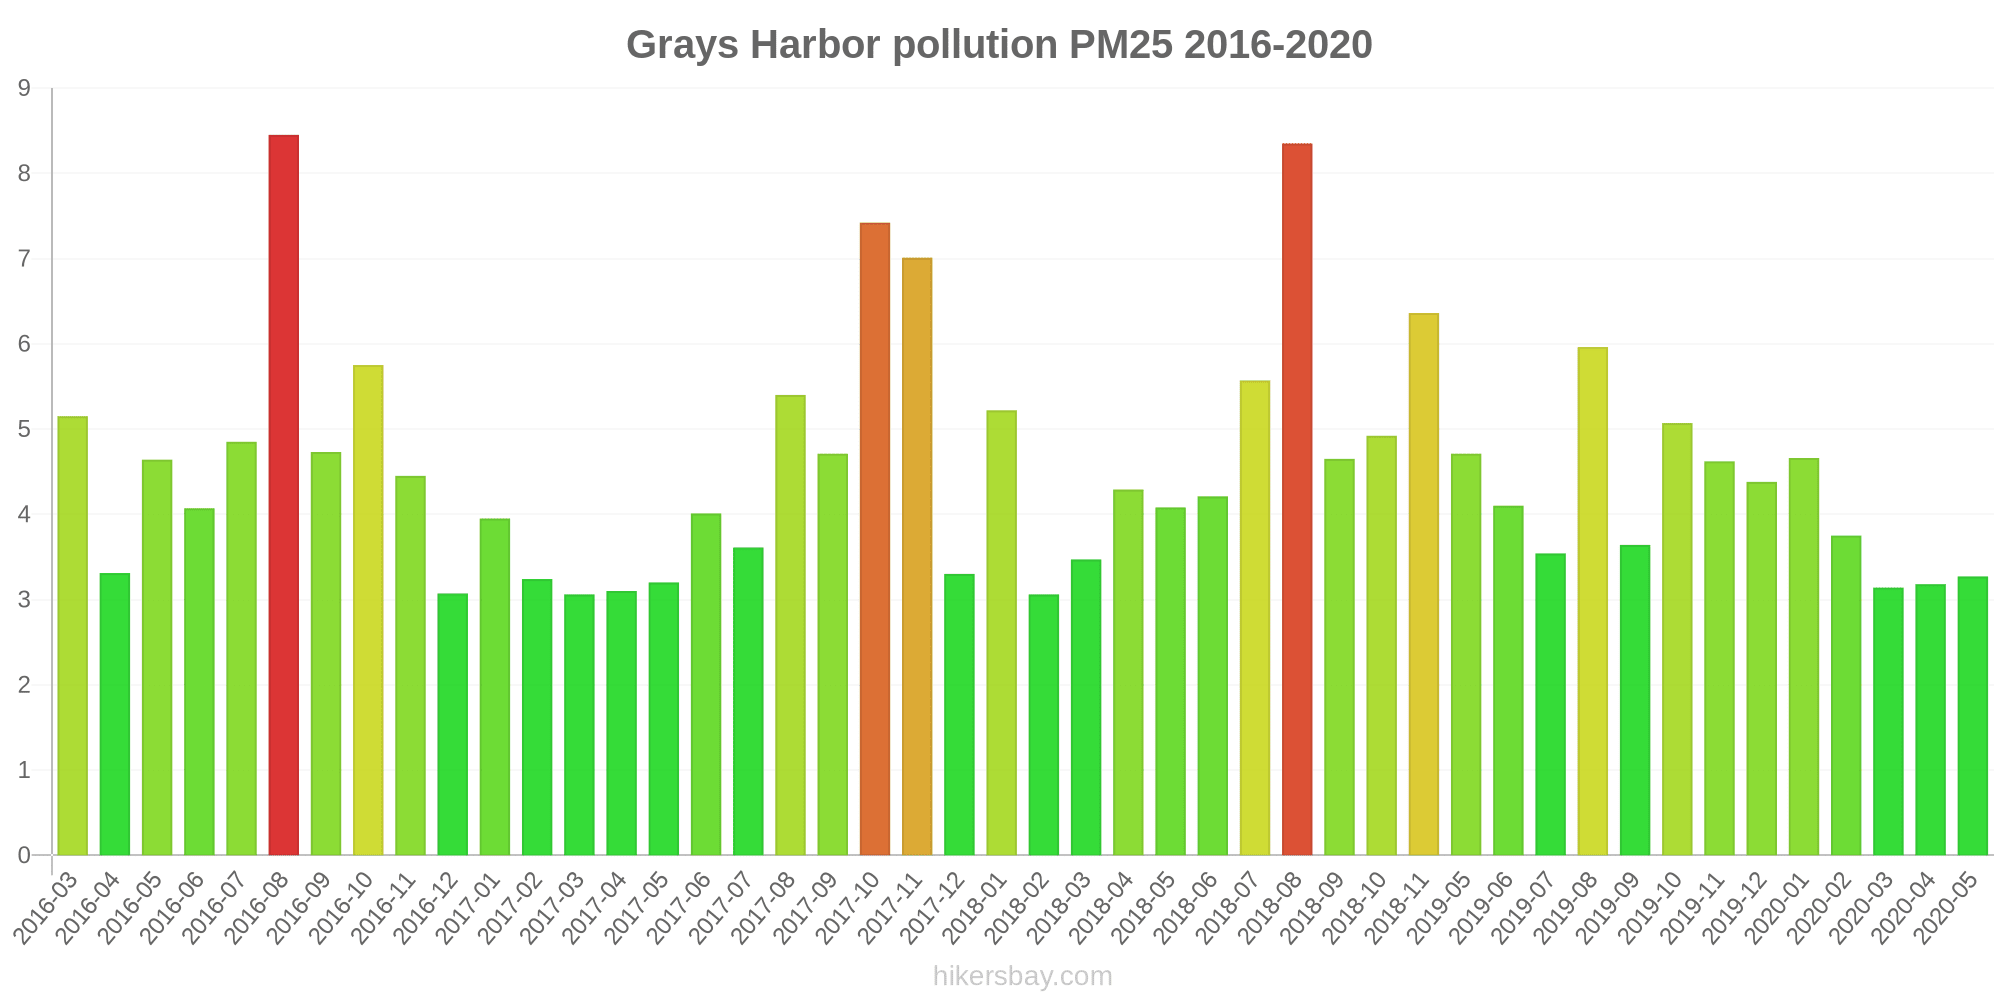
| index | 2020-05 | 2020-04 | 2020-03 | 2020-02 | 2020-01 | 2019-12 | 2019-11 | 2019-10 | 2019-09 | 2019-08 | 2019-07 | 2019-06 | 2019-05 | 2018-11 | 2018-10 | 2018-09 | 2018-08 | 2018-07 | 2018-06 | 2018-05 | 2018-04 | 2018-03 | 2018-02 | 2018-01 | 2017-12 | 2017-11 | 2017-10 | 2017-09 | 2017-08 | 2017-07 | 2017-06 | 2017-05 | 2017-04 | 2017-03 | 2017-02 | 2017-01 | 2016-12 | 2016-11 | 2016-10 | 2016-09 | 2016-08 | 2016-07 | 2016-06 | 2016-05 | 2016-04 | 2016-03 |
|---|---|---|---|---|---|---|---|---|---|---|---|---|---|---|---|---|---|---|---|---|---|---|---|---|---|---|---|---|---|---|---|---|---|---|---|---|---|---|---|---|---|---|---|---|---|---|
| pm25 | 3.3 (Good) | 3.2 (Good) | 3.1 (Good) | 3.8 (Good) | 4.7 (Good) | 4.4 (Good) | 4.6 (Good) | 5.1 (Good) | 3.6 (Good) | 6 (Good) | 3.5 (Good) | 4.1 (Good) | 4.7 (Good) | 6.4 (Good) | 4.9 (Good) | 4.7 (Good) | 8.3 (Good) | 5.6 (Good) | 4.2 (Good) | 4.1 (Good) | 4.3 (Good) | 3.5 (Good) | 3.1 (Good) | 5.2 (Good) | 3.3 (Good) | 7 (Good) | 7.4 (Good) | 4.7 (Good) | 5.4 (Good) | 3.6 (Good) | 4 (Good) | 3.2 (Good) | 3.1 (Good) | 3.1 (Good) | 3.2 (Good) | 4 (Good) | 3.1 (Good) | 4.5 (Good) | 5.8 (Good) | 4.7 (Good) | 8.4 (Good) | 4.8 (Good) | 4.1 (Good) | 4.6 (Good) | 3.3 (Good) | 5.2 (Good) |
PM2,5 1.4 (gut)
Feinstaub (PM2,5)Taholah-Quinault Tri
| index | 2023-01-02 | 2023-01-01 | 2022-12-31 | 2022-12-30 | 2022-12-29 | 2022-12-28 |
|---|---|---|---|---|---|---|
| pm25 | 2.6 | 1.9 | 7.3 | 9.6 | 1.4 | 5.4 |
Taholah-Quinault Tri
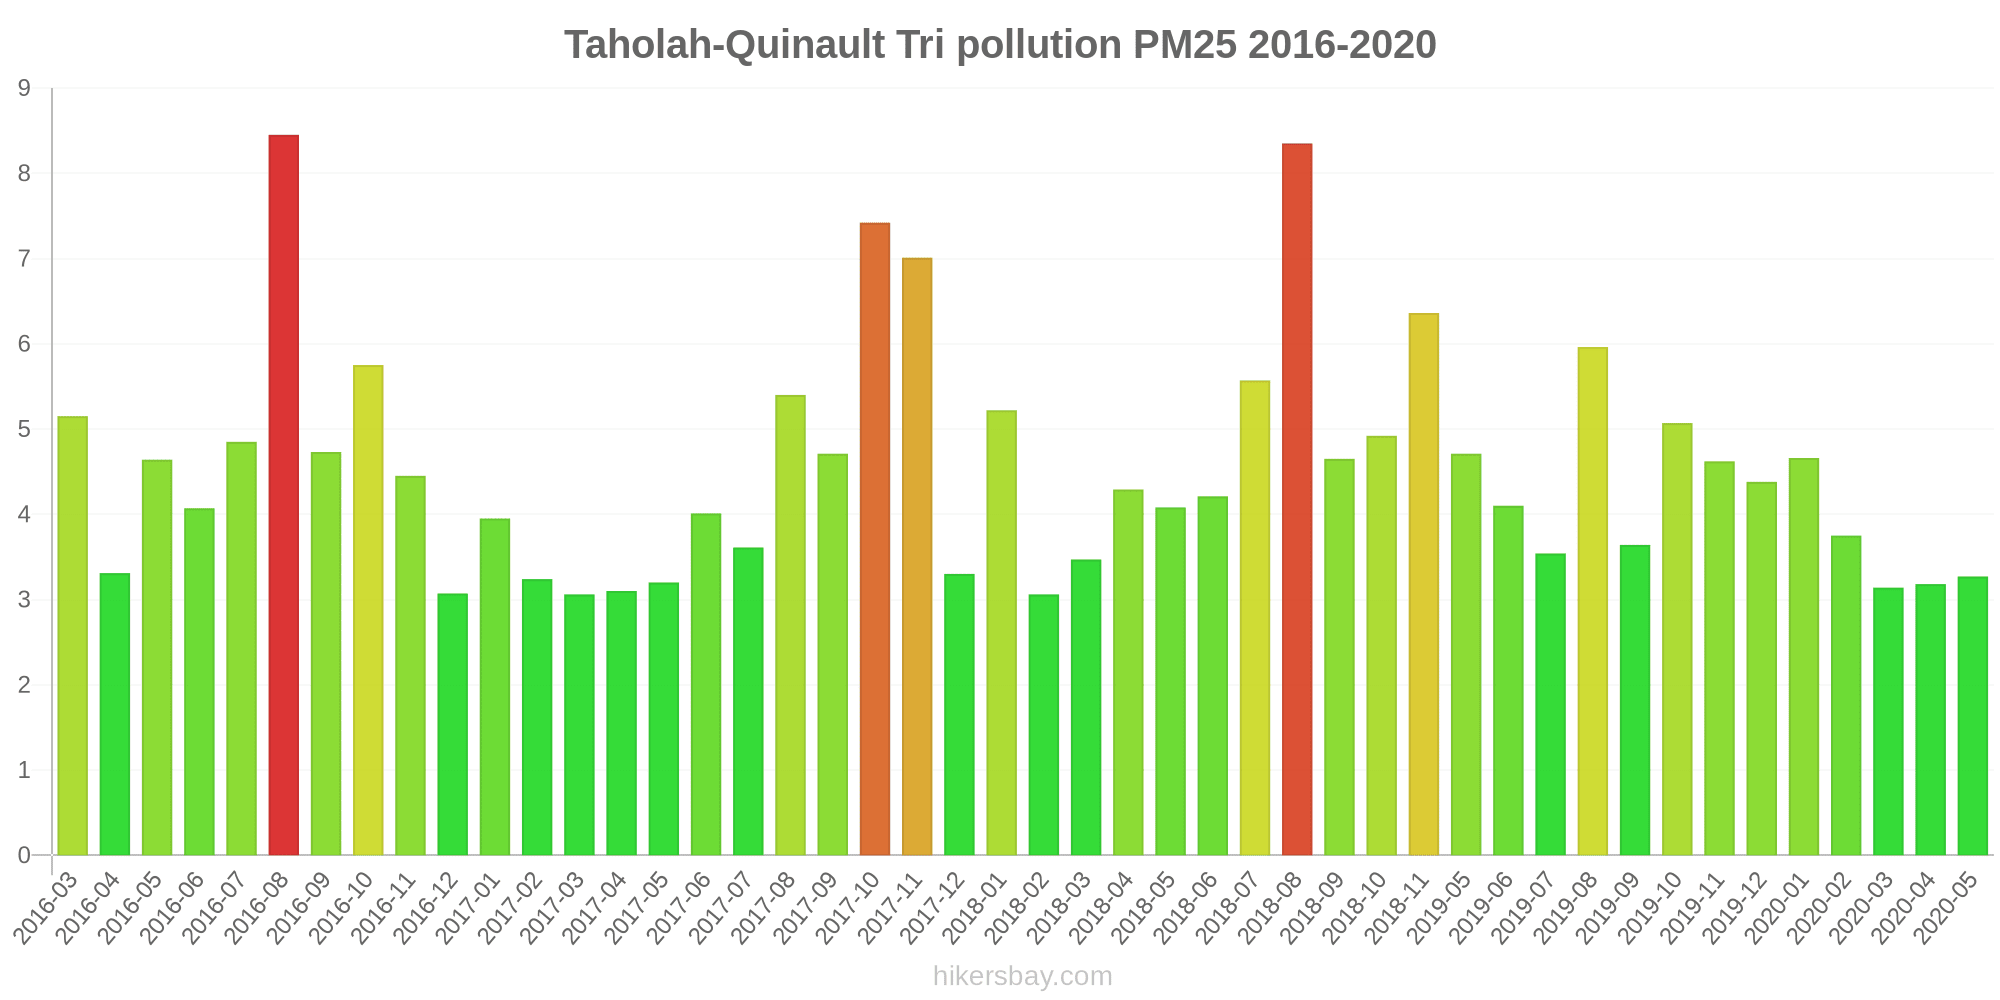
| index | 2020-05 | 2020-04 | 2020-03 | 2020-02 | 2020-01 | 2019-12 | 2019-11 | 2019-10 | 2019-09 | 2019-08 | 2019-07 | 2019-06 | 2019-05 | 2018-11 | 2018-10 | 2018-09 | 2018-08 | 2018-07 | 2018-06 | 2018-05 | 2018-04 | 2018-03 | 2018-02 | 2018-01 | 2017-12 | 2017-11 | 2017-10 | 2017-09 | 2017-08 | 2017-07 | 2017-06 | 2017-05 | 2017-04 | 2017-03 | 2017-02 | 2017-01 | 2016-12 | 2016-11 | 2016-10 | 2016-09 | 2016-08 | 2016-07 | 2016-06 | 2016-05 | 2016-04 | 2016-03 |
|---|---|---|---|---|---|---|---|---|---|---|---|---|---|---|---|---|---|---|---|---|---|---|---|---|---|---|---|---|---|---|---|---|---|---|---|---|---|---|---|---|---|---|---|---|---|---|
| pm25 | 3.3 | 3.2 | 3.1 | 3.8 | 4.7 | 4.4 | 4.6 | 5.1 | 3.6 | 6 | 3.5 | 4.1 | 4.7 | 6.4 | 4.9 | 4.7 | 8.3 | 5.6 | 4.2 | 4.1 | 4.3 | 3.5 | 3.1 | 5.2 | 3.3 | 7 | 7.4 | 4.7 | 5.4 | 3.6 | 4 | 3.2 | 3.1 | 3.1 | 3.2 | 4 | 3.1 | 4.5 | 5.8 | 4.7 | 8.4 | 4.8 | 4.1 | 4.6 | 3.3 | 5.2 |